Part 3. FLOAT Case Studies
3.1 Signifying & Sampling: Visualizing Jay-Z’s Music
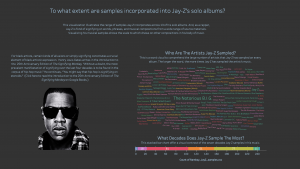
Signifying & Sampling: Visualizing Jay-Z’s Music
Formulate – A Research Question
Exploratory Question:
- To what extent are samples incorporated into Jay-Z’s solo albums?
Explanatory Question (I revised my research questions during the fourth step in process, analyze):
- Who are the artists that Jay-Z sampled?
- How many genres does Jay-Z sample in his music?
- What decades does Jay-Z sample the most?
- How many samples does Jay-Z incorporate into each album?
Locate – A Data Source
For this project, I used The Jay-Z Samples Dataset. This pre-assembled dataset is published on the subverse of the Texas Data Repository. The “Black Studies Data Verse” has datasets related to an assortment of topics in Black literature and Black studies in general. The information is already cleaned and organized in a coherent manner.
You can access this information by going to this website here.
Organize – Your Data
This information already came organized. It has a data dictionary that explains the organization and components of the dataset. The dataset has 12 main categories: Release Date, Album Title, Song Title, Track #, Producer, Number of Samples, Sample Artist, Sample Song Title, Sample Year, Sample Decade, Sample Genre, and Sample Type.
The structure of the dataset is defined in the accompanying data dictionary.
Analyze – Your Data
I used Microsoft Excel to create a pivot table to explore the dataset. I refined my questions after my analysis. I focused on the following columns in order to ask more targeted questions that focused on the specific variables in the dataset.
Explanatory questions:
- How are the artists that Jay-Z sampled? (Column G)
- How many genres does Jay-Z sample in his music? (Column G & K)
- What decades does Jay-Z sample the most? (Column J & H)
- How many samples does Jay-Z incorporate into each album? (Columns B and H)
For this analysis, I focused on columns B, G, H, J, K to answer my revised questions.
I used the following columns in a pivot table to answer my refined research questions.
- Column G
- 195 artists (245 songs)
- Columns G & K
- Hip hop (93); Soul/funk (72); Rock (21); Movie (14); R&B (10); Reggae (8); Jazz (7); Electronic/Disco (6); World (4); Spoken Word (3); Jazz/Blues (2); Other (2); Soundtrack (1); Latin Pop (1); Gospel (1)
- Columns H & J
- 1950s (2); 1960s (11); 1970 (77); 1980 (51); 1990 (81); 2000 (18); 2010 (5);
- Columns B and H
- Reasonable Doubt (26); Vol 1 (15); Vol. 2 (6); Vol. 3 (17); The Dynasty (16); The Blueprint (29); The Blueprint 2 (30); The Black Album (24); Kingdom Come (12); American Gangster (22); The Blueprint 3 (14); Magna Carta (17); 444 (17)
Tell— A Data Story
I used Tableau Public to create a visualization that answered all of the four central research question. I created three different charts to provide answers to these questions. I also used color to point out distinguishing factors.
Step 1 – Create a bar chart (How many samples does Jay-Z incorporate into each album?)
I created a bar chart of each of Jay-Z’s 13 albums to offer a visual contrast of how many samples uses on each album. Each individual block represents a different sample. Hovering over each block reveals the name of the song, the sample artist, and the year the song was released.
-
- Drag “Album Title” from the dimensions menu and place it in the columns bar.
- Drag “Number of Samples” from the measures box and drop the field on the middle of the screen.
- The chart should now reflect a bar display a horizontal bar chart for each album.
- Click the “Show Me” toolbar and select the “horizontal bar” chart option.
- To change the bar chart from horizontal to vertical, click the “swap columns and rows” option on the top tool bar.
- Drag the “Sample song title” from the Tables menu and drop the field on the bar chart.
- Drag and drop the following categories onto the “Label” option on the Marks card: Album Title, Song Title, Sample Song, Sample Artist, Sample Year
- Drag the “Release date” from the dimensions menu and place it above before the “Album title” on the columns header to arrange the albums by release year.
Step 2—Add color to Bar chart (How many genres does Jay-Z sample in his music?)
I used color to represent the different genres Jay-Z uses in his music. On the bar chart, each block is colored to represent the various genres of the songs.
-
- Drag “Sample genre” from the dimensions menu and drop it on the “color” option on the marks card.
- Click the “Color” option on the marks card; scroll down to border, and select black as the option.
Step 3—Create a word cloud (Who are the artists that Jay-Z sampled?)
I created a word cloud to comprehend the large number of artists that Jay-Z has sampled on every album. The larger the word, the more times Jay-Z has sampled the artist’s music.
-
- Drag “Sample artist” from the dimensions menu to the rows column.
- Drag “Measure values” onto the middle of the screen.
- A number next to each artists name should populate depending on the amount of times they have been sampled by Jay-Z.
- Click the “Show me” bar and select “Treemaps” from the menu.
- The image should transform to a treemap that varies in size by how many times an artist was sampled
- Navigate to the “Marks” card, click the drop down menu, and select “text.”
- Drag the “sample genre” from the dimensions tab to color on the Marks Card.
Step 4—Create a stacked bar chart (What decades does Jay-Z sample the most?)
I created a bar chart to offer a visual contrast of the seven decades Jay-Z samples in his music.
-
- Drag “sample decade” from the dimensions menu to the main screen.
- Drag “measure values” from the measures menu to the home screen.
- Click the Show Me menu and select the “stacked bars” option.
Step 5—Create a dashboard and arrange the sheets
I created a dashboard and arranged all of the information on the sheet.
-
-
- Arrange the sheets on the dashboard
- Change to the “floating” option to be able to navigate and arrange the items freely.
- Click the “use filter” option on each visualization to make the charts interact with one another when an option is selected
- Change the color
- Add images
- Add text
- Remove unwanted titles and gridlines
- Arrange the sheets on the dashboard
-
By Lindsey Dixon & Kenton Rambsy
