Part 3. FLOAT Case Studies
3.5 300 African American Titles
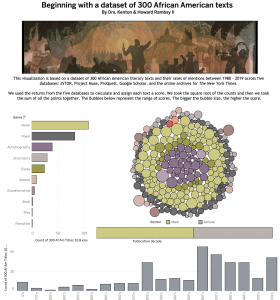
Beginning with a Dataset of 300 African American Texts
Project Rationale: This project charts the mentions of works by Black writers across publications and search engines. This examination focuses on 300 and tabulates and ranks novels based on an accumulation of citations in thousands of articles. The texts were selected from my own interests and knowledge of major, recurring topics in our field as well as works frequently cited by our friends and colleagues. Thus, while many of the texts that appear in this are deemed canonical, some were selected for personal and arbitrary reasons.
Data Story Description:This visualization is based on a dataset of 300 African American literary texts and their rates of mentions between 1980 – 2019 across five databases: JSTOR, Project Muse, ProQuest, Google Scholar, and the online archives for The New York Times. The bigger the bubble size, the higher the score for the text (and number of mentions).
Formulate – A Research Question
Exploratory Question:
- How can we rank the scholarly significance of Black texts?
Explanatory Question (I revised my research questions during the analyzing process):
- What works are have the most citations?
- What decades were these works originally published?
- What genres are included in the dataset?
- What is the gender ratio of writers included in the dataset?
Locate – A Data Source
For this project, I used 300 Key African American Literary Texts. This pre-assembled dataset is published on the subverse of the Texas Data Repository. The “Black Studies Data Verse” has datasets related to an assortment of topics in Black literature and Black studies in general. The information is already cleaned and organized in a coherent manner.
You can access this information by going to this website here.
Organize – Your Data
This information already came organized. It has a data dictionary that explains the organization and components of the dataset. The dataset has 23 main categories: Book title, Author, Gender, Publication Year, Publication decade, JSTOR ,Project Muse, ProQuest, Google Scholar, NYTimes, Weighted Score B, Genre, Number of Words in Title, Birthplace/Origin 1, State, Region, Country, Birthday, Birth Year, Birth Decade, Death Date, Death Year, Death Decade;
The structure of the dataset is defined in the accompanying data dictionary.
Analyze – Your Data
I used Tableau Public to analyze my data.
Tell— A Data Story
Pre-Step: Gathering the Data
- Go to the Texas Data Repository
- Search “300 Key African American Literary Texts
- Download the option that is called comma separated values
- Separated Values)
- Open tableau then drag and drop your dataset into the software
- Or you can go to Connect on the left bar and select the kind of file you have and upload your dataset that way
- Make Sure tableau read your data right and correct categories if they were read wrong
- PUBLICATION year should be a string along with decade
- State and country should be geographical lcocations
- Birthday, year, death date, and death year should be dates
- Decade should be a string
- Death decade should be a string
Step 1 – Create a stacked bar chart (What is the author’s gender?)
I created this bar chart to easily sift through the works published by women and men writers.
- I dragged the number from the measures menu to the middle of the screen
- I dropped gender on top of the bar chart
- The chart now reflects a stacked bar chart.
Step 2 – Create a packed bubble (What works are have more citations?)
I created a packed bubble chart to illustrate which texts carried a higher score. The bigger the bubble, the more weight it carries meaning it was cited more collectively across all search engines.
- I dragged book title from the dimensions menu to the middle of the screen.
- I dragged “Weighted score b” from the measure menu and placed it next to the book titles
- I used the “show me” menu and selected the “packed bubble” chart to change the display.
- I dragged “Genre” from the dimensions menu to the marks card and dropped it on color
-
- Now the bubbles are color coded by genre
Step 3 – Create a bar chart (What genres are included in the dataset?)
I created a bar chart to make it easy to search the various genres included in the dataset. This would allow users to easily search the dataset.
- I dragged genre from the dimensions menu to the rows column
- I dragged the number of selections from the measures menu to the rows chart
- I used the “show me” menu to select horizontal bars
- I dragged genre from the dimensions menu on top of the chart to change the colors
- I am going to use the emblem with the arrow going down at the top to order the bars from greatest to least
Step 4 – Create a bar chart (What decades were texts works originally published?)
I created a bar chart to easily interpret which decades works were published across the dataset.
- I dragged publication decade from the dimensions menu to the columns bar
- I dragged the number of selections from the measures menu to the rows chart
- I used the “show me” menu to select horizontal bars
- I used the “swap rows and columns” button to change the orientation of the graph
- I dragged book title from the dimensions menu and placed it on the rows.
- Now individual blocks are represented by specific texts.
Step 5 – Create a dashboard and arrange the sheets
I created a dashboard and arranged all of the information on the sheet.
- Arrange the sheets on the dashboard
- Change to the “floating” option to be able to navigate and arrange the items freely.
- Click the “use filter” option on each visualization to make the charts interact with one another when an option is selected
- Change the color
- Add images
- Add text
- Remove unwanted titles and gridlines
By Lindsey Dixon & Kenton Rambsy
