Part 4. Digital Tools Explained
4.2 Tableau Public
What is Tableau Public?
Tableau Public is free software that facilitates the creation of interactive data visualizations. Tableau Public vizzes can be embedded into web pages and blogs, and they can be shared via social media or email. Tableau Public is one tool used for data storytelling. Users employ data to create various visualizations such as bar charts, word clouds, scatterplots, and so forth. Tableau has customization options for visualizations, which makes it possible to build basic coding skills. The site has a gallery of visualizations that users can view to get ideas about charts. For some visualizations, users can download the workbook and explore the various components of a visualization. This allows users to reverse engineer visualizations and draw inspiration from already existing vizzes.
Overview of Tableau Public
Tableau is a software company that makes a suite of software for creating and publishing data visualizations including Tableau Public, Tableau Desktop, Tableau Server, and Tableau Prep. (Tableau Public and Tableau Desktop are the core free and paid versions, respectively, so we will focus on them here.)
Tableau Public/Desktop share some similarities with Microsoft Excel. They are fully-featured software that allow you to import data and apply a number of different transformations to that data, and eventually create a number of different visualizations. But while Excel is limited to the metaphor of a spreadsheet and a relatively simple set of charts, Tableau is capable of complex data modeling and a wide variety of visualization outputs. These include graphs, plots, maps, etc. Furthermore, Tableau can compose multiple visualizations together and add interactive elements like filters, point-and-click functionality, etc. You may wish to produce static images at the end of your analysis, or perhaps interactive web elements.
Tableau Public is the free version of this tool. There are several things to be aware of with regard to Tableau Public. It’s free to download and use, but, aside from screenshots, the only way to share Tableau Public visualizations is to publish them to the Tableau Public website. That means they will be freely available on the web, and you will need to create a Tableau account in order to do this.
Tableau Public is a powerful data visualization tool, in heavy use among both laypeople and data professionals.
Tableau Home Screen
Saving & Publishing Your Tableau Dashboard
Dashboards are comprised of more than one Sheet. First, click on the Dashboard icon and in the window that appears, arrange the Sheets as you see fit. Next, you can place text and images in the boxes in the “objects” panel at the bottom left of the screen.
Once you complete your Dashboard, save the workbook to Tableau Public in three simple steps, which is available to other users to view and discuss. Before you begin, make sure you are signed into your Tableau Public account. With your workbook open in Tableau:
- Click “file” from the menu in the top, righthand corner of the screen
- Click “Save to Tableau Public As”
- Type a file name and press enter.
After the workbook is published, you are redirected to your account on the Tableau Public website (Link opens in a new window).
Joining Data in Tableau
It is often necessary to combine data from multiple places—different tables or even data sources—to perform a desired analysis. Depending on the structure of the data and the needs of the analysis, there are several ways to combine the tables.
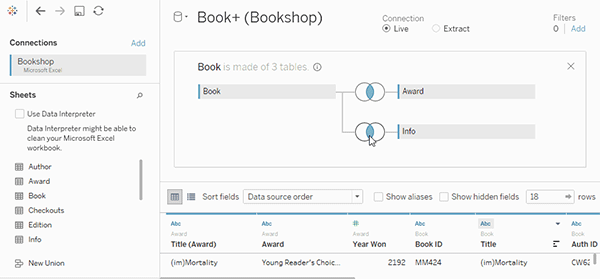
The default method in Tableau Desktop is to use relationships. Relationships preserve the original tables’ level of detail when combining information. Relationships also allow for context-based joins to be performed on a sheet-by-sheet basis, making each data source more flexible. Relationships are the recommended method of combining data in most instances.
However, there may be times when you want to directly establish a join, either for control or for desired aspects of a join compared to a relationship, such as deliberate filtering or duplication.
Create a join
1. To create a join, connect to the relevant data source or sources. These can be in the same data source (such as tables in a database or sheets in an Excel spreadsheet) or different data sources (this is known as a cross-database join). If you combined tables using a cross-database join, Tableau colors the tables in the canvas and the columns in the data grid to show you which connection the data comes from. see Connect to Your Data.
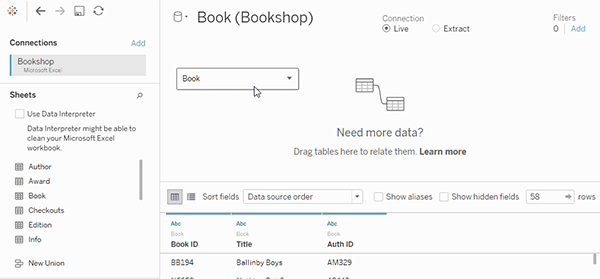
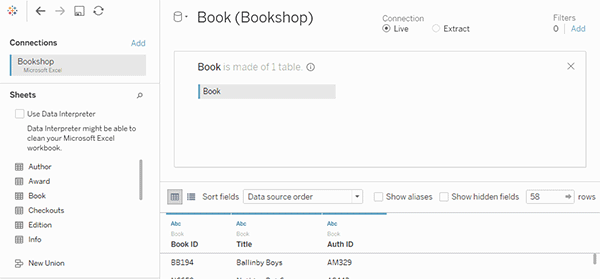
2. Drag the first table to the canvas (Note that if you drag out a second table at this point a relationship will form).

3. Select Open from the menu or double-click the first table to open the join canvas (physical layer). (Double-clicking a table on the relationship canvas opens the join canvas)
4. Double-click or drag another table to the join canvas.
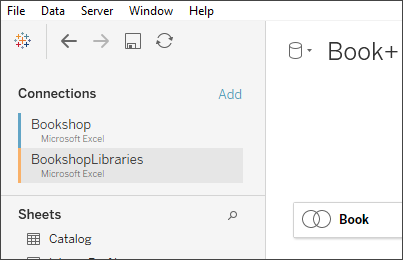
If your next table is from another data source entirely, in the left pane, under Connections, click the Add button ( in web authoring) to add a new connection to the Tableau data source. With that connection selected, drag the desired table to the join canvas.
5. Click the join icon to configure the join. Add one or more join clauses by selecting a field from one of the available tables used in the data source, choosing a join operator, and a field from the added table.
Join Types & Clauses
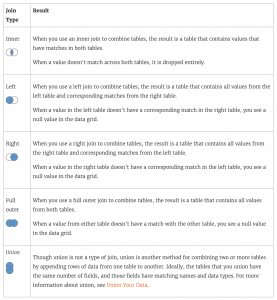
In general, there are four types of joins that you can use in Tableau: inner, left, right, and full outer. If you aren’t sure what join type you want to use to combine data from multiple tables, you should use relationships. In general, there are four types of joins that you can use in Tableau: inner, left, right, and full outer. If you aren’t sure what join type you want to use to combine data from multiple tables, you should use relationships.
A join is performed by setting up one or more join clauses. The join clause tells Tableau which fields are shared between the tables and how to match the corresponding rows. For example, rows with the same ID are aligned in the results table.
Join clauses most often use the equality operator (=) which matches rows with the same values. It is also possible to perform non-equi joins, such as less than (<) and not equal (<>).
A join can also have multiple join clauses. For example, if First name and Last name are stored in separate columns, it may be beneficial to join only if “First name = First name” and “Last name = Last name”. Both conditions will have to be true for rows to be joined. Alternatively, if the goal was to return results when the last name is shared but the first name is not, the join clauses could be “First name <> First name” and “Last name = Last name”.
Join clauses can also contain calculations. For example, the join clause could be the concatenation of the name fields “[First name] + [Last name] = [First name] + [Last name]”. Note that not all data source connections support calculations in join clauses.
Note About null values in join keys
In general, joins are performed at the database level. If the fields used to join tables contain null values, most databases return data without the rows that contain the null values. However, for certain single-connection data sources, Tableau provides an additional option to allow you to join fields that contain null values with other fields that contain null values.
After you’ve set up your data source, on the data source page, select Data > Join null values to null values.
If the option is greyed out, it is not available for your data source. Note that if you add a second connection to a data source that uses this option, the join reverts back to the default behavior of excluding rows with null values.
Cross-Database Joins
Tableau allows joins from tables in different data sources, albeit with some limitations from the database side on which platforms are compatible. Cross-database joins require a multi-connection data source—that is, you create a new connection to each database before you join the tables.
1. Once you’ve connected to the first source of data, use the Add option in the data pane to add another connection.
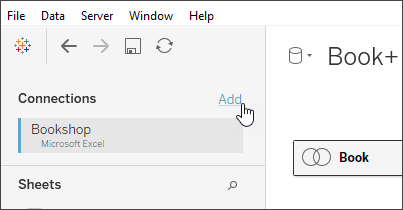
2. This creates a second connection rather than an entirely different data source. You can switch between the two (or more) connections while on the data source tab.
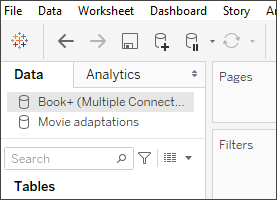
3. Once you move to a worksheet and begin analysis, the data source functions as a single, combined data source. This is in contrast to two independent data sources that can be toggled between on a worksheet (The Book+ data source contains two connections with a cross-database join. It functions as a single data source. The Movie adaptations data source is an independent data source).
Common issues
- To view, edit, or create joins, you must open a logical table in the relationship canvas—the area you see when you first open or create a data source—and access the join canvas.
- Published Tableau data sources cannot be used in joins. To combine published data sources, you must edit the original data sources to natively contain the join or use a data blend.
- When joining tables, the fields that you join on must be the same data type. If you change the data type after you join the tables, the join will break.
- Fields used in the join clause cannot be removed without breaking the join. To join data and be able to clean up duplicate fields, use Tableau Prep Builder instead of Desktop
This chapter was adapted from Tableau Public’s resource page and join your data page.
Media Attributions
- Join Types
