7 Case Study V: California High-Speed Rail
Chapter Overview
This chapter critically examines the sustainable mobility benefits and limitations of high-speed rail (HSR) systems in European and U.S. cities. This chapter is divided into three sections. The first part examines methodological approaches to assess the costs and benefits associated with high-speed rail (HSR) systems from an environmental perspective. The second part illustrates the city factors that enable a high occupancy and, therefore, economic and ecological efficiency of high-speed rail (HSR) in Europe, reflecting on France’s and Germany’s experiences. The third part draws on lifecycle assessment (LCA) as a comprehensive methodological approach for evaluating the Greenhouse Gas (GHG) mitigation potential of the California High-Speed Rail System under various scenarios of occupancy and use. Finally, this chapter concludes with a critical analysis of California’s barriers to implementing and completing an HSR line.
Learning Objectives
- Explore methodological approaches to examine the environmental effects of HSR systems.
- Deconstruct the demand assumptions for the California HSR project and identify considerations that may be the most problematic.
- Identify the barriers to the completion and implementation of the California HSR.
- Assess the challenges and opportunities posed by the California HSR, which may serve as a reference for the Dallas-Houston HSR project.
WHAT IS HIGH-SPEED RAIL?
High-speed rail (HSR) systems have been one of the most prominent transportation technologies in Global North cities over the past fifty years. HSR offers high-quality trips with shorter travel times for millions of passengers worldwide. HSR has been implemented in over 15 countries, including China, Japan, South Korea, China, Taiwan, France, Germany, Italy, Spain, Portugal, Belgium, the Netherlands, Norway, the United Kingdom, Sweden, Denmark, and the United States. Ridership data indicate that an average of 50 million passengers use this transportation system yearly in Europe, increasing by 2.6 since 1981 (Campos & de Rus, 2009). Despite the extensive attention that HSR has received during the past several decades, the viability of this system is still debatable due to its expensive building, maintenance, and operation costs. Thus, HSR systems could not be considered the most sustainable or economically viable transportation option for a country’s transport policy. Therefore, it is crucial to investigate the benefits and costs of HSR from an economic, social, and environmental perspective. To better understand HSR and the implementation issues of this transportation technology, this chapter examines the costs and benefits associated with HSR systems. Construction and planning costs are some of the most significant costs associated with high-speed rail infrastructure. In addition, operation and service maintenance costs are other categories of HSR costs.
The Economic Costs of High-Speed Rail Systems In Europe
Cost-benefit analysis helps planners understand transportation systems’ construction, maintenance, use costs, and potential benefits. Factors determining HSR costs include urban city form, land-use values, construction complexity, topography, and urban density. Factors that affect the ridership and occupancy of HSR are influenced by the proximity and accessibility of the stations to dense cities and, thus, high ridership and occupancy. Another factor is the interconnections of HSR with other modes of transportation, such as subways. Scholars concur that one of the most successful systems, from the perspective of cost-benefit analysis, is the French system, followed by the German system. Ridership counts in France and Germany are remarkably high. In Europe, Italy and Spain have the lowest ridership.
A comprehensive understanding of the construction and operating costs for different locations and under various economic conditions will provide a more accurate analysis of the required number of passengers and services to make the HSR a sustainable transportation alternative. In terms of the definition of the high-speed rail system, the European Council Directive explains that the high-speed Infrastructure is of three different lines, including:
- High-speed lines constructed specifically capable of speeds typically equivalent to or more than 250 km/h.
- Conventional lines that have been explicitly improved may travel at 200 km/h.
- Due to geographical relief and town-planning restrictions, specially upgraded conventional lines have unique characteristics. As a result, the speed must be customized for each situation (Campos & de Rus, 2009).
While these definitions provide technical information about the HSR systems, they are insufficient to define the term since speed could change due to factors such as safety and noise control when the train reaches a tunnel or a densely urbanized area. Therefore, defining HSR based on speed alone could be misleading. On the other hand, while HSR and conventional railways are based on similar engineering principles, there are technical differences in building and maintaining high-speed railways. Therefore, the relationship between HRS and the existing traditional services, as well as how these two transportation options may be used, shared, and organized in the infrastructure, determines the economic definition of the HSR system. Accordingly, four different exploitation models based on the relationship between conventional service and HSR are defined by Campos and de Rus (2009):
- Model 1: Exclusive exploitation: Separation between HSR and service. Example: Shinkansen, Japan (1964)
- Model 2: Mixed high speed: High-speed trains run on new or upgraded lines, which helps reduce operating costs. Example: Train a Grande Vitesse (TGV), France (1981)
- Model 3: Mixed conventional: Some trains run at high speed. This model provides flexibility because it allows intermediate high-speed services on some routes. Example: Alta Velocidad Española (AVE)
- Model 4: Fully mixed: Maximum flexibility: high-speed and conventional services run on each type of Infrastructure. Example: German intercity trains and Rome-Florence’s HSR occasionally use traditional lines.
Cost-benefit Analysis of HSR Systems in Europe
Some specific aspects must be considered when building new HSR systems, including technical restrictions, design attributes, and geographic/topographic requirements. According to Campos and de Rus (2009), there are three high costs for building HSR systems’ Infrastructure: planning and land costs, infrastructure building costs, and superstructure costs (Campos & de Rus, 2009).
Planning and land costs include various items, such as technical and economic feasibility studies, technical design requirements, land acquisition costs, and other related legal fees (e.g., licenses and permits). While these types of costs differ from project to project, they usually include 5-10% of total costs. The second type of cost is related to preparing the terrain and building the appropriate platform, known as the infrastructure building costs. While generally, these costs will include 10-20% of the total investment in new rail infrastructure, depending on the project characteristics, such as terrain type and price, the need for building bridges or tunnels, as well as other geographical obstacles, may increase these costs up to 40-50% of the entire investment. On the other hand, there is another type of cost called superstructure costs, which are related to rail-specific elements. These costs include guideways, sidings along the line, the signaling system, electrification, communication, and safety installations. Accordingly, superstructure costs represent 5-10% of the total investment in building a new HSR.
Data from a study conducted by Campos & de Rus (2009) shows that the average construction cost per kilometer in their sample of 45 HSR projects (including infrastructure and superstructure costs and excluding the planning and land costs) is about 17.5 million euros (varies between 6 and 45 million euros). Also, their analyses show that the cost of building infrastructure is higher in Asian countries (including Japan, Taiwan, and South Korea, except China) than in Europe.
In Europe, there are two groups of countries regarding HSR systems. First, France and Spain are operating their HSR with lower construction costs; however, these types of fees are identified to be higher in other countries, such as Germany, Italy, and Belgium (Campos & de Rus, 2009). The main reasons for this difference include:
- Geographical and topographical attributes
- The lower population density in certain areas
- Construction processes and characteristics vary from country to country.
There is a positive relationship between population density and building costs; therefore, in European countries where the population density is higher in locations where the HSR is built, the building costs will be much higher. Figure 7.1 provides a general overview of the average price per kilometer of some new HSR infrastructure in different parts of the world.
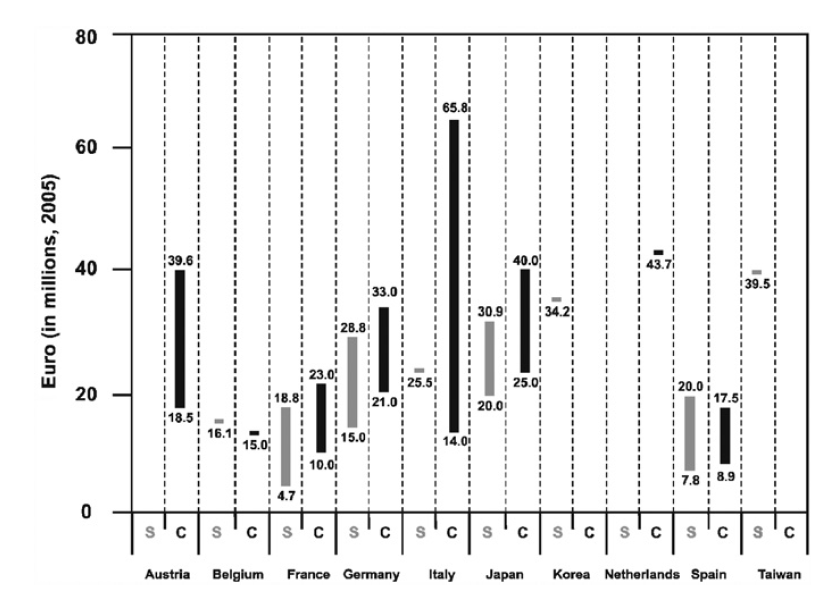
Costs: Operating the HSR Systems
Operation costs are mainly categorized into two groups: Infrastructure and rolling stock. Infrastructure operating costs refer to the maintenance and exploitation of infrastructure, while rolling stock and train operating costs are associated with the provision of transportation. In the following part, these two types of fees are described in more detail.
Among the costs categorized as infrastructure operating costs, the most significant are the time, resources, and other materials needed to maintain and run the energy supply, signaling, guideway, terminal, station systems, daily traffic management, and safety systems (Campos & de Rus, 2009). Of the items mentioned as the infrastructure operating costs, some things are fixed expenses related to the safety and technical standards of operating the system; however, some other costs are not fixed, such as infrastructure maintenance (e.g., tracks).
The second category of operating costs of HSR systems is mainly related to transportation systems and trains, known as rolling stock and train operating costs. These costs are categorized into four main groups: shunting and train operations, rolling stock and equipment maintenance, personnel expenses, energy expenditures, and sales and administration (Campos & de Rus, 2009). The mentioned costs will differ for different systems and locations based on many factors, such as the expected traffic level or the technology used for the HSR. For instance, other trains in the Europe HSR network have other technical attributes. Different European countries developed their systems in various ways to best match their specifications and best serve their own countries.
Another cost associated with the operation of the HSR systems is the energy costs (consumption of energy required for trains), which are also different for different trains based on their characteristics. Also, the change in the speed will result in a change in energy costs, and energy increases dramatically when it exceeds 300 km/h. Data shows that the cost of energy for HSR in France is lower than in Germany by about 5%. While the energy source could explain the main reason for this difference (nuclear, cheaper), other factors, such as the organization providing the energy (directly/indirectly), also affect these costs. In addition, to train type and technical aspects, factors such as track-switching (known as shunting), the average period trainsets stay at the depot, train servicing, driving, and safety will also affect the operating costs. Costs related to these factors may also change based on the operational procedures used by different rail operators in other countries.
Costs: External Costs of HSR Systems
Another category of costs associated with HSR is environmental costs, which are noticeable in both infrastructure construction and operation procedures of HSR systems. Items include take-over of land, consequences of barriers, visual obstruction, noise, air pollution, and involvement in global warming (Campos & de Rus, 2009) Are among the highest environmental costs. Regarding environmental costs, HSR is usually compared to other transportation modes. The literature discusses that high-speed rail systems act better than different modes by shifting the traffic from air and roads to rail systems. However, to compare HSR with other modes in terms of pollution, since the sources of energy are different in different countries and there are many other factors affecting it, it is too complex to conclude whether HSR acts better than other modes in pollution emissions. On the other hand, past studies concur that HSR contributes less to air pollution and greenhouse gas emissions than private cars and airplanes (Campos & de Rus, 2009).
| Vehicle | Paris-Vienna | Paris-Brussels |
|---|---|---|
| Car | 40.2 | 43.6 |
| Rail | 11.7 | 10.4 |
| Air | 28.7 | 47.5 |
Source: Campos & de Rus, 2009
The challenges of HSR, a European perspective
Historically, some problems associated with European HSR systems are identified as issues in developing a connected network with an integrated framework between different modes. However, evidence shows that the number and concentration of cities this emerging network serves are increasing. Three main issues have been identified regarding evaluating the HSR network (Vickerman, 1997), including competitiveness, network effects, and corridor development. In addition, the literature identifies three primary reasons for the emerging European HSR, including overcoming the limited capacity of the rail network with a more cost-effective option, increasing speed, and improving accessibility (Vickerman, 1997). Although the development of the HSR network in Europe was supported by the mentioned reasons to solve some of the transportation issues, it is discussed that this system has not achieved its dedicated goals (Vickerman, 1997). On the other hand, the HSR system affects the urban areas in Europe by increasing the concentration of economic activities in their surrounding areas. Therefore, the possible positive and negative economic externalities caused by HSR systems should be considered carefully regarding planning and policy intervention (Vickerman, 1997).
Moreover, the literature discusses some issues and problems associated with HSR systems (Vickerman, 1997). Accordingly, while accessibility and transportation costs could be improved through developing HSRs, these developments will create competitiveness, harming poorer regions since the more affluent areas are more capable of investing in the Infrastructure and benefitting from the advantages.
Besides, it has been discussed that the investment could result in regional growth, not the HSR network. Also, there is an argument that the whole network’s quality affects the Infrastructure’s effectiveness, so planning plays a critical role.
Therefore, while the significant outcome of HSRs is identified as improving competitiveness and shrinking the size of the geographical area, It is evident that not everyone has had equal and proportionate access to the network. We thus find a considerably more complicated pattern of spatial growth rather than a general shrinkage of area, with big outlying cities with new high-speed rail links benefiting at the expense of minor centers in more central regions. On average, Europe may become more competitive, but the impact on cohesiveness is considerably harder to foresee (Vickerman, 1997).
The Economic Implications of HSR for Cities
While high-speed rail seeks to be a comfortable, safe, flexible, and environmentally sustainable mode of transport with environmental performance and socio-economic benefits, data reveals that the cost-efficiency (assessing construction costs, delays, cost overruns, and the use of high-speed lines) analysis indicates that the E.U.’s current long-term plan is unlikely to be achieved, and lacks a solid EU-wide strategic approach (European Court of Auditors, 2018).
The HSR network has not achieved many of its objectives, according to a European Court of Auditors assessment, despite significant expenditures made by the European system over the previous 20 years. The main shortcoming is the absence of an efficient network connecting various national lines. Sadly, this is because Commission lacks the legal tools and the authority to compel Member States to build lines as agreed. (European Court of Auditors, 2018).
The cost-efficiency analysis is a practical assessment to examine the viability of an HSR network.
The need for HSR is not the same in all places. Despite the positive perception of commuters towards HSR, European cities use only 45% of the capacity of HSR systems. As a result, operating and maintenance expenses could be higher than revenues. As a result, the European HSR’s cost-effectiveness is under doubt. Additionally, there is a discussion about the HSR’s sustainability in Europe, where it is said that this system is not as sustainable as anticipated. According to data, three of the seven finished lines have low passenger volumes, which leads to inefficient investment and a lack of system sustainability. Furthermore, nine of the 14 lines have minimal ridership, furthering Europe’s HSR system’s inefficiency (European Court of Auditors, 2018).
The HSR system is expensive not only in construction but also in maintenance. Accordingly, the average cost of constructing or maintaining one km (not considering the more costly tunneling projects) is about 25 million euros (European Court of Auditors, 2018). The cost increases dramatically by increasing the speed since the Infrastructure of the rails that tolerates very high speed is far more expensive; however, very high speed is not needed at all the locations that have been constructed. This factor has made the European HSR system particularly costly. Furthermore, although the number of HSR users has steadily grown since its emergence, there are still issues with low numbers of passengers, making some HSR systems unsustainable and generally ineffective. Data shows that “from roughly 15 billion passenger kilometers (PKM) in 1990, demand reached more than 124 billion PKM in 2016” (European Court of Auditors, 2018). Furthermore, data shows that about half of the funding provided by the E.U. co-funding for high-speed rail in Europe has been invested in Spain.
Another issue that significantly affects the efficiency of the HSR systems is the time gap between planning, constructing, and operating the system. In the case of European HSR, the average time from the start of work to the beginning of operations is around 16 years (Table 7.2). This time gap can increase significantly if the Infrastructure builds tunnels (European Court of Auditors, 2018).
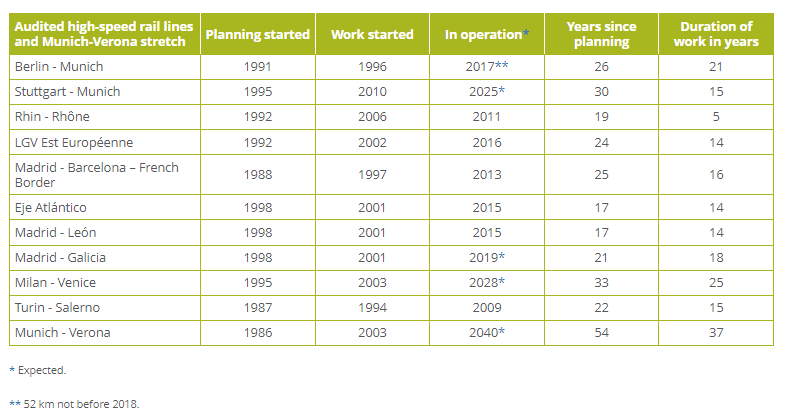
Source: European Court of Auditors, 2018
The European HSR system has been criticized for lacking a reliable cost-benefit analysis in the initial decision-making process. Transportation planners argue that 1) The expensive Infrastructure has been constructed in many locations where there is no need for high-speed rail, and 2) The cost-efficiency checks are not conducted regularly during construction and operationalization. Moreover, while HSR and conventional rail systems are expensive to build and maintain, HSR costs are significantly greater than traditional rail systems. Due to the potential for considerable cost savings, modifying existing lines to boost speed rather than establishing a very high-speed line should also be considered. (European Court of Auditors, 2018).
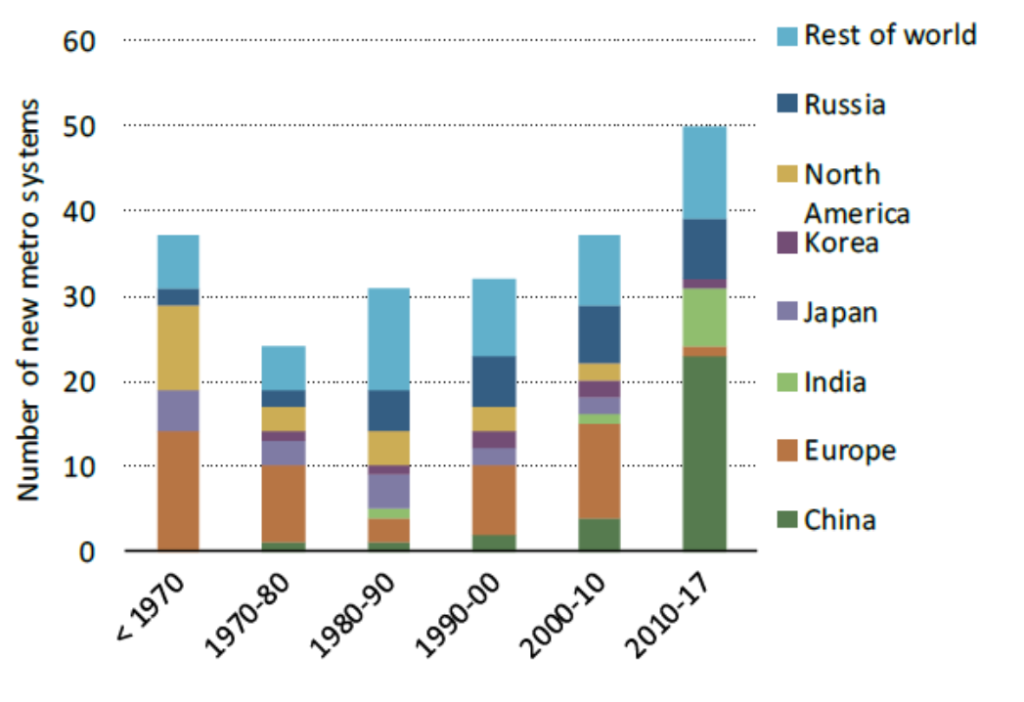
This paper concludes that while HSR systems are advantageous in many ways, the European system lacks a thorough and long-term plan for cost-effectiveness and investments. It also brings up the concern that the long-term viability of the E.U.’s co-funding of high-speed lines is in jeopardy. Furthermore, cross-border construction should be streamlined since seamless and competitive cross-border high-speed rail operations remain a way off (European Court of Auditors, 2018).
Broader Panorama of the Recent, Rapid Expansion of HSR in Asian Cities
Asian nations began implementing the HSR system in the 1960s, with Japan being the pioneer in integrating it into its national transportation network. Japan opened its first high-speed rail link between Tokyo and Osaka in time for the 1964 Olympics ( James, 2009). However, this situation has changed over the past 50 years, with India and China expanding more of the HSR networks in their transportation system and Japan stopping the expansion of this system. The following figure (Figure 7.3) shows how the growth of the HSR system has changed during the past 50 years worldwide. Note how, while the HSR expansion has experienced a meager rate in Europe, the number of new metro systems has dramatically increased in China after 2010.
During the past two decades, rapid development has happened in China’s HSR network, and China is surpassing the rest of the world in terms of expanding its HSR system. This rapid development has resulted from the enormous funding from the Chinese government (Nunno, 2018). While the planning phase for China’s HSR started in the early 1990s, the system did not withdraw its operation until 2008. HSR trains in China cover speeds between 250-350 km/h, and By 2025, the network is anticipated to be over 38,000 km, and by 2035, it will be around 45,000 km. (Nunno, 2018). This length of HSR networks in China is more than all HSR network mileage in the rest of the world. Accordingly, China’s HSR is the most extended network globally and is reported to be the most extensively used network globally. The length of the HSR network in China was already about 37,900 km by the end of 2020 (Xinhua, 2021). Thus, China’s HSR has been profitable for the government. China’s most profitable high-speed rail line connects Beijing to Shanghai, two major economic zones in China. Thai Line reported over $1 billion in net operating profit in 2015 (Nunno, 2018).
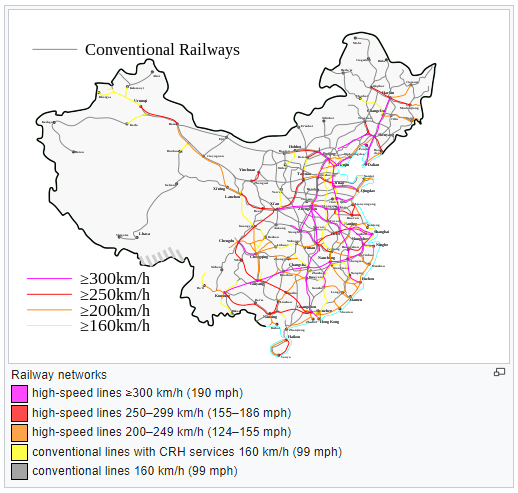
The HSR system in China has drawn criticism, most notably that it is not cheap for the majority of citizens. The Chinese government, in response, claims that the HSR has boosted economic productivity and competitiveness over time and is a quick and dependable form of transit in some of the most densely inhabited places. Additionally, it has been stated that the Chinese HSR system is more energy-efficient and promotes energy independence since it uses fewer resources to convey people and commodities on electric trains (Nunno, 2018). Data shows that due to the expansion of HSR in China, domestic airlines were obliged to lower rates, halt specific shorter intercity routes, and cancel regional flights, particularly those under 500 km. As a result, more people currently travel by high-speed rail in China than by domestic airplanes (Nunno, 2018).
Environmental Impact Assessment of the California HSR
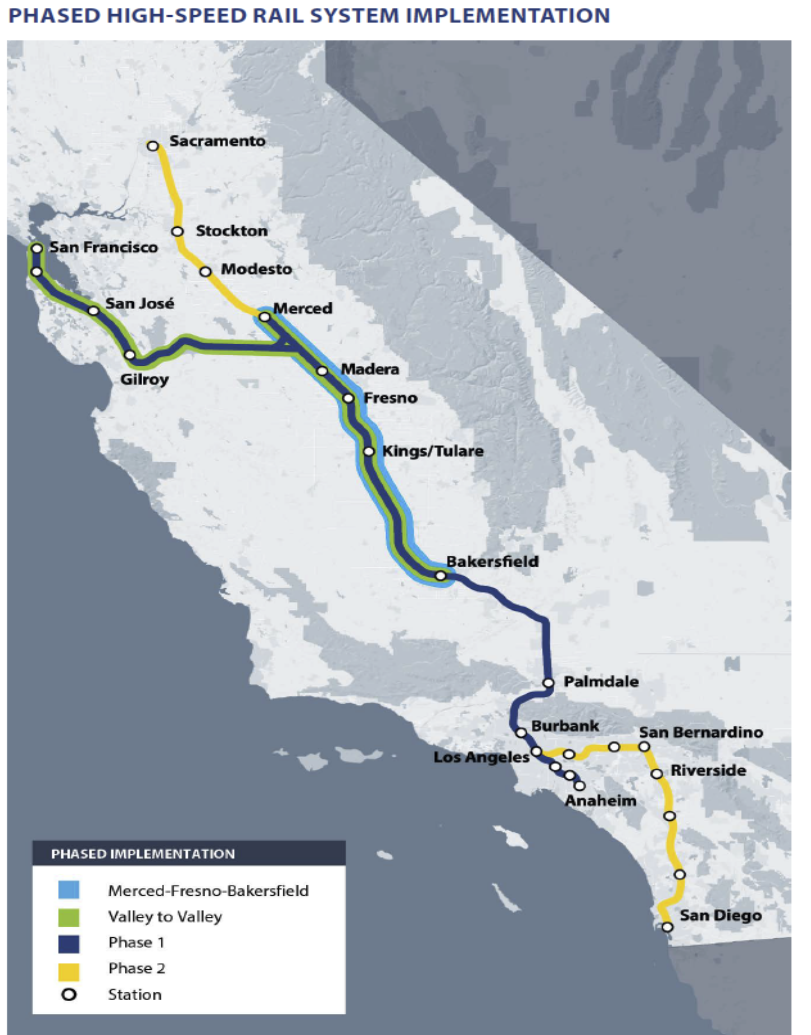
The California HSR (CHSR) system aims to connect the metropolitan areas and mega-regions of the state. In addition to providing a more convenient and faster transportation mode as the primary goal, the California HSR is claimed to contribute to creating jobs, a cleaner environment, and preserving agricultural and protected lands (hsr.ca.gov, 2021). The first phase of the network will connect Los Angeles to San Francisco. This trip will be under three hours by train traveling 200 miles per hour. The second phase will extend the network to Sacramento and San Diego. The California HSR will cover 800 miles and pass through 24 stations (hsr.ca.gov, 2021). The following map provides an overview of the California HSR network, the lines, and the stations included in this network (Figure 7.4). Accordingly, the time to travel between the significant mega-regions using the HSR system in California is shown in the following table (Table 7.3).
| San Francisco – Los Angeles Union Station | 2 Hours and 40 Minutes |
|---|---|
| Oakland – Los Angeles Union Station | 2 Hours and 40 Minutes |
| San Francisco – San Jose | 30 minutes |
| San José – Los Angeles | 2 Hours and 10 Minutes |
| San Diego – Los Angeles | 1 Hour and 20 Minutes |
| Inland Empire – Los Angeles | 30 Minutes |
| Sacramento – Los Angeles | 2 Hours and 10 Minutes |
Source: hsr.ca.gov, 2021 – California High-Speed Rail Authority.
The California high-speed rail is a publicly funded project and is under construction. In 2008, the voters agreed on the planning, construction, and implementation of the CHSR. The structure of CHSR began in 2016, and since then, there have been numerous active construction sites, with more anticipated each year (hsr.ca.gov, 2021). According to the Build HSR California, The California High-Speed Rail Authority’s November 2021 Construction Update highlights the progress on the nation’s first high-speed rail project. With more completed projects and significant advancement on others, there is steady progress across all high-speed rail construction packages from Madera to Wasco (buildhsr.com, 2021). However, the construction of the CHSR has experienced a slow process and many delays due to different reasons, including technical issues, political-related issues, funding issues, and, more recently, the impact of the COVID-19 pandemic in 2020 and 2021 (constructionreviewonline.com, 2021; Manata, 2021).
On the other hand, the CHSR has been discussed as not being entirely successful. It has been argued that the project suffers from management turmoil, problems with procuring land, funding, budgeting, and engineering issues, and is far behind schedule. Currently, 119 miles of right-of-way are under construction in the Central Valley. Still, an additional 52 miles are necessary to extend the system to Merced and Bakersfield to make an influential HSR system segment (hsr.ca.gov, 2021). The following map (Figure 7.5) details the project’s status (as of April 2021).
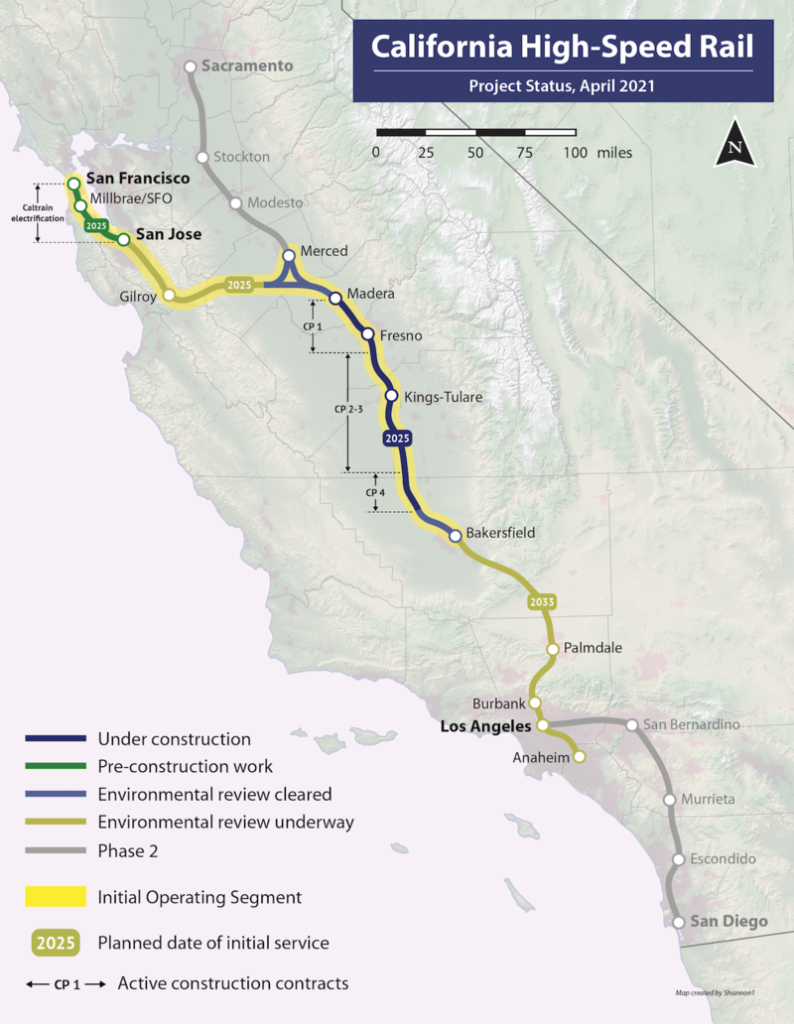
Therefore, the Merced-Bakersfield line will become the first HSR line in the U.S. This segment of the CHSR, known as Phase 1-section one, covers 65 miles of the whole CHSR network and will be operational by 2029 (builhsr.com, 2021). This section of the network is highlighted in blue in Figure 7.5. One of the primary debates/critiques of the HSR is that the first phase, which connects Merced to Bakersfield, is low-density and does not connect important cities. Therefore, the prospects of occupancy are pretty low. This situation may be a lousy antecedent for completing the whole system. The following table (Table 7.4) provides a detailed overview of all stations in phase 1 of the CHSR project, their status, and expected completion date.
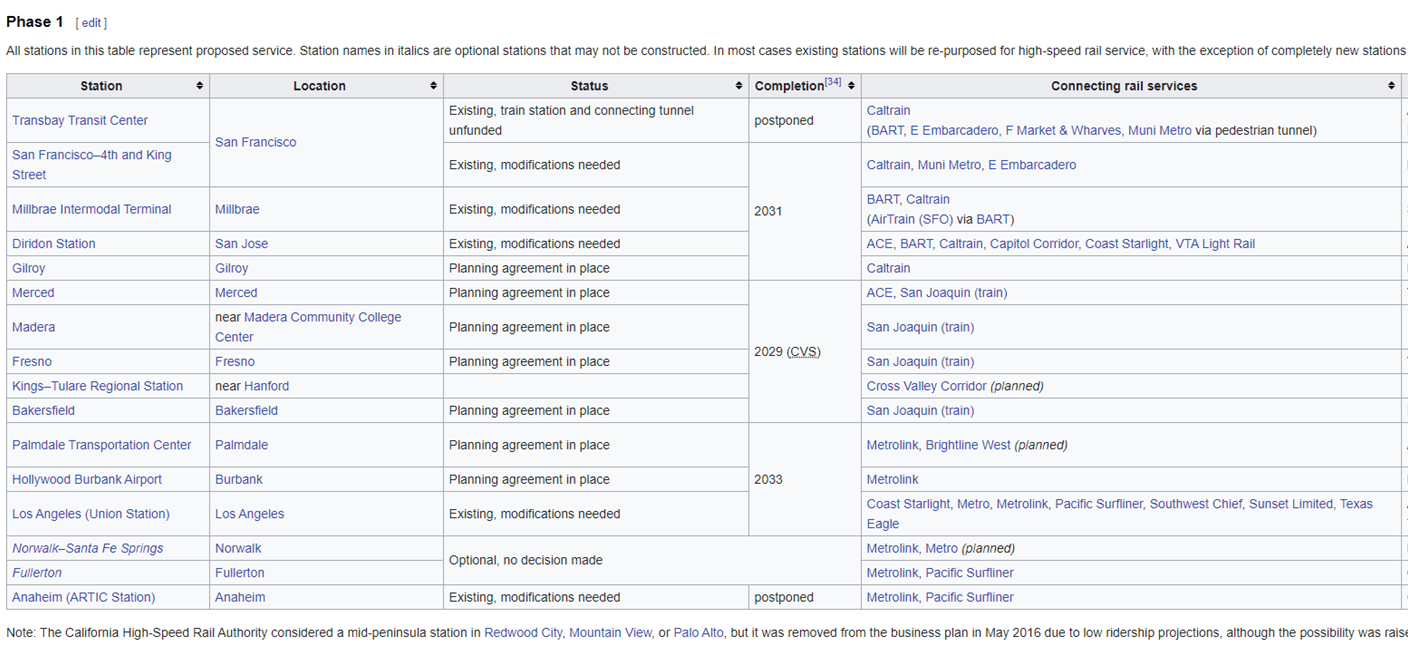
Source: https://buildhsr.com/construction-updates/
California high-speed rail: A Lifecycle Assessment of environmental impacts
The decrease in fuel usage and, thus, GHG emissions is one of the debatable advantages of HSR. The majority of environmental impact evaluations, however, only look at the usage phase and ignore the environmental effects of building infrastructure. More significantly, these ecological effects presumptively reflect high occupancy rates for HSR. This presumption can be incorrect and harmful. Therefore, an environmental impact assessment requires a thorough analysis and evaluation of the lifecycle phases connected with transportation systems, including the HSRs, to understand how the HSR helps reduce fossil fuel consumption and air pollution. As a result, we focus on the Lifecycle Assessment (LCA) method in this section to better understand how California HSR affects the environment. Therefore, we use Chester and Horvath’s (2009) work Lifecycle Assessment of High-Speed Rail: The Case of California. LCA, a thorough methodological approach, is used by Chester and Horvath (2009) to assess the environmental effects of HSR and contrast it with other forms of transportation. They cover all these environmental effects, including building, usage, and upkeep.
The development and investment of the HSR system require careful consideration of many factors, including technological, social, economic, and environmental choices. For instance, California HSR (CHSR) is a sizable project that has received significant funding. As a result, there has always been discussion about how efficient the system is; but in recent years, this discussion has been increasingly focused on energy and environmental choices. Environmental evaluations frequently compare the energy consumption per trip, GHG emissions, and other emissions of various modes of transportation (auto, heavy rail, and airplane) by considering vehicle operation. To enable policymakers to analyze both the direct consequences of vehicle operation and the indirect effects of the cars, Infrastructure, and fuel consumption, the environmental evaluation should comprise various methods. Although high-speed rail has the potential to be the least energy- and greenhouse gas-intensive mode of transportation, sustaining high occupancy would need careful planning and ongoing investment.
Environmental trade-offs might also happen. High-speed rail, for instance, might reduce energy use and greenhouse gas emissions per journey. However, the existing electrical mix may increase “SO2” emissions, negatively affecting human health and environmental acidification (Chester & Horvath, 2010).
Investing in CHSR will result in a higher and better level of passenger service and reduce door-to-door travel time and travel costs. Accordingly, the following figure (Figure 7.6) shows the door-to-door travel time between downtown San Francisco and downtown Los Angeles based on the modality. However, many scholars and critics argue that such a new system’s final and actual outcomes could differ from what it is expected to deliver (Chester & Horvath, 2010). When considering the improvements of HSR in lowering travel time, travel cost, GHG emissions, and energy consumption, the lifecycle components beyond the electricity needed to move vehicles and their corresponding emissions are not considered (Chester & Horvath, 2010). Thus, considering other emissions sources, such as manufacturing and maintaining the cars and infrastructure construction and maintenance, is essential. To assess the environmental tradeoffs of the CHSR, a lifecycle perspective against other modes should be considered and evaluated so that all environmental impacts and associated costs would be apparent to policymakers (Chester & Horvath, 2010).
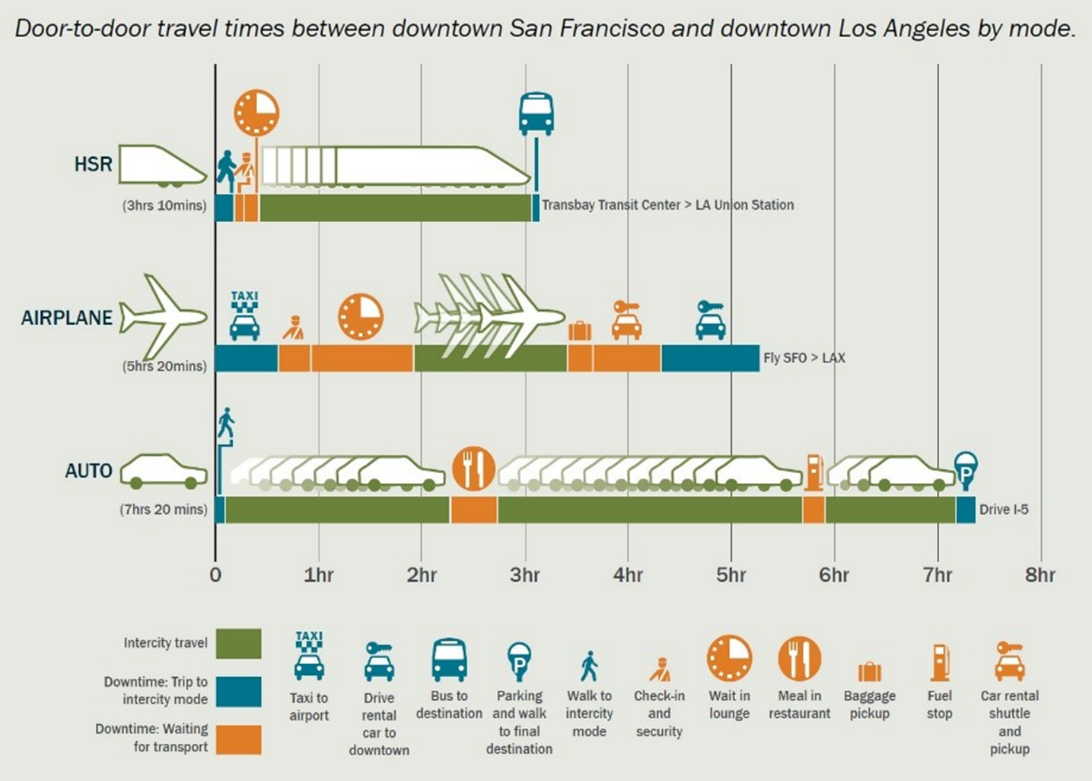
Source: https://www.eesi.org/papers/view/fact-sheet-high-speed-rail-development-worldwide.
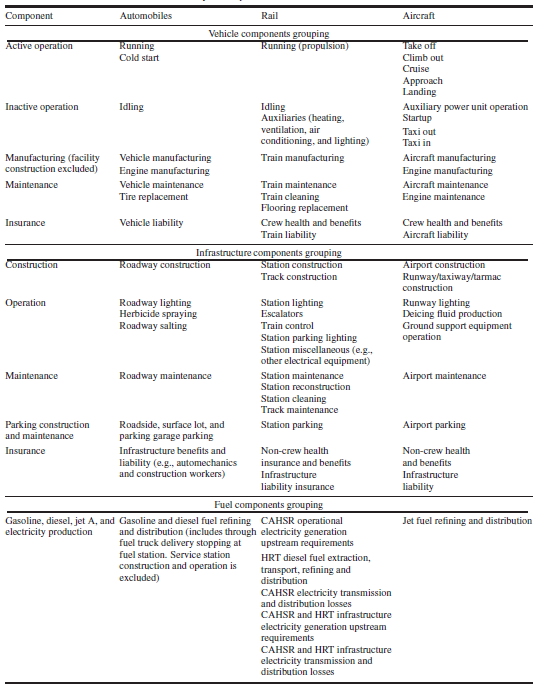
Regarding the factors that need to be captured by the lifecycle assessment, Chester and Horvath (2010) mention that energy inputs and emission outputs for all three categories of vehicles, Infrastructure, and fuel production should be considered. Therefore, we could evaluate critical components for each type, including construction/production, use/operation, maintenance, and end-of-life aspects. This article, thus, argues that the existing environmental assessments of HSR primarily focus on the direct effects of electricity use and corresponding power plant emissions from train functional operation energy requirements. They do not consider other factors that may indirectly affect the environmental assessments of the HSR systems. The following table provides a comprehensive understanding of what should be considered in the LCA. Specifically, Table 7.5 indicates three sections: the lifecycle components (operation, manufacturing, and maintenance by mode), the infrastructure components by methods, and the fuel components.
Source: Chester & Horvath, 2010.
In addition, another critical factor when performing environmental assessments is the rates and the patterns of using different transportation modes. Data shows that in California:
- Vehicles: 90% of trips and 75% of passenger kilometers traveled (PKT)
- Heavy Rail Transit (HRT): 1% of journeys and 1% of the PKT
- Air: 9% of trips and 24% of PKT
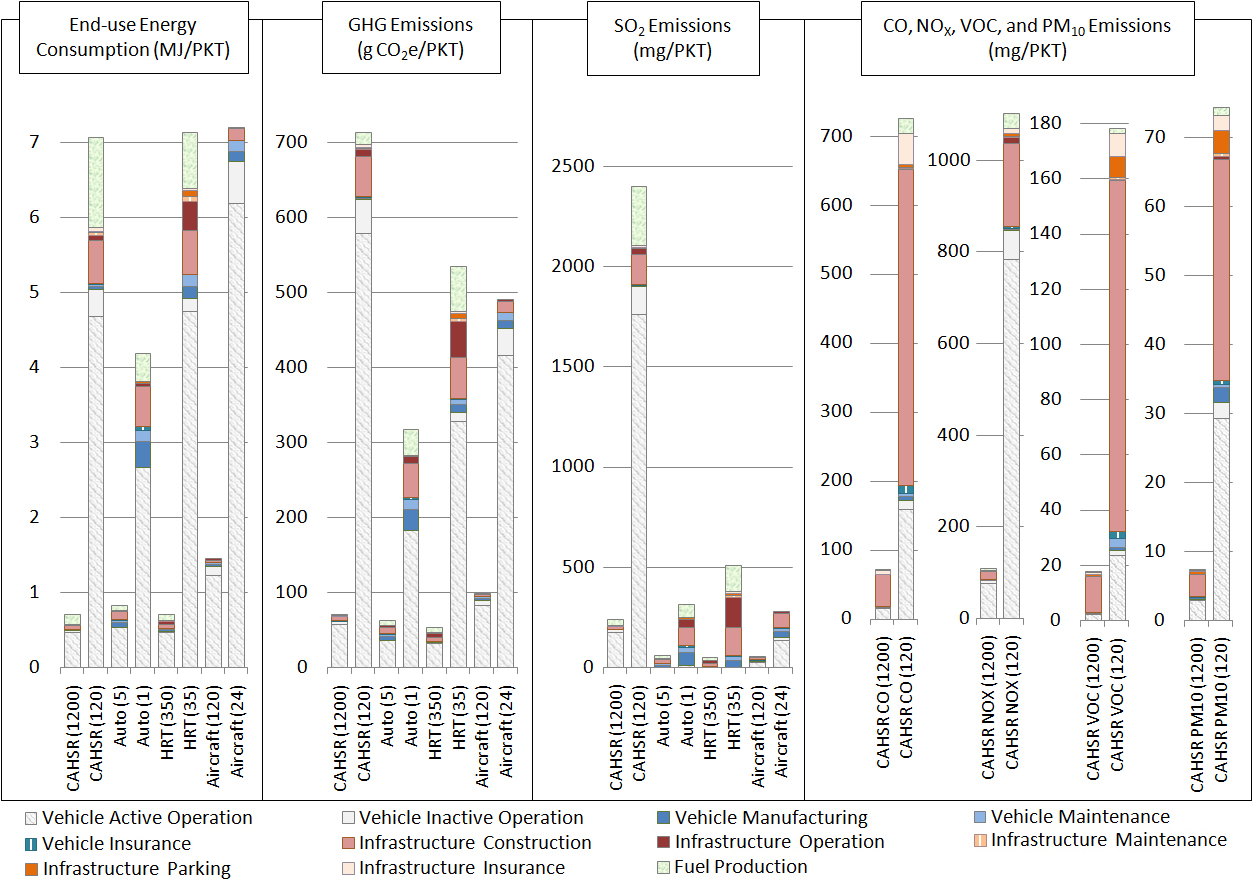
There is uncertainty regarding the ridership estimates and occupancy rates in any group of transportation modes. For instance, trains may have 650-1200 seats depending on the ridership forecasts and train characteristics. Furthermore, the system’s potential energy and environmental performance will change significantly depending on the range of ridership.(Chester & Horvath, 2010). Therefore, when evaluating the lifecycle environmental performance of the CHSR system, we need to consider both the low and high occupancies with their corresponding PKT. Furthermore, the soft and high occupancy rates should also be compared for all modes, including automobiles, HRT, and aircraft. Therefore, realistic ridership numbers are applied to capture the potential occupancy ranges (Chester & Horvath, 2010). The following table overviews ridership estimates based on high and low occupancy rates.
| Occupancy | 1200 pass/train | Five seat-car | 120 seat-airplane |
|---|---|---|---|
| High | 1200 (100% occupancy) | Five passengers | 81 passengers |
| Low | 120 (10%) | One passenger | 24 passengers |
Source: Chester & Horvath, 2010.
Figure 7.7 shows each mode’s lifecycle energy and emissions performance at low and high occupancy. Because the environmental performance is spread among many passengers, the per-PKT energy and emissions are at their lowest during periods of high occupancy. (Chester & Horvath, 2010)
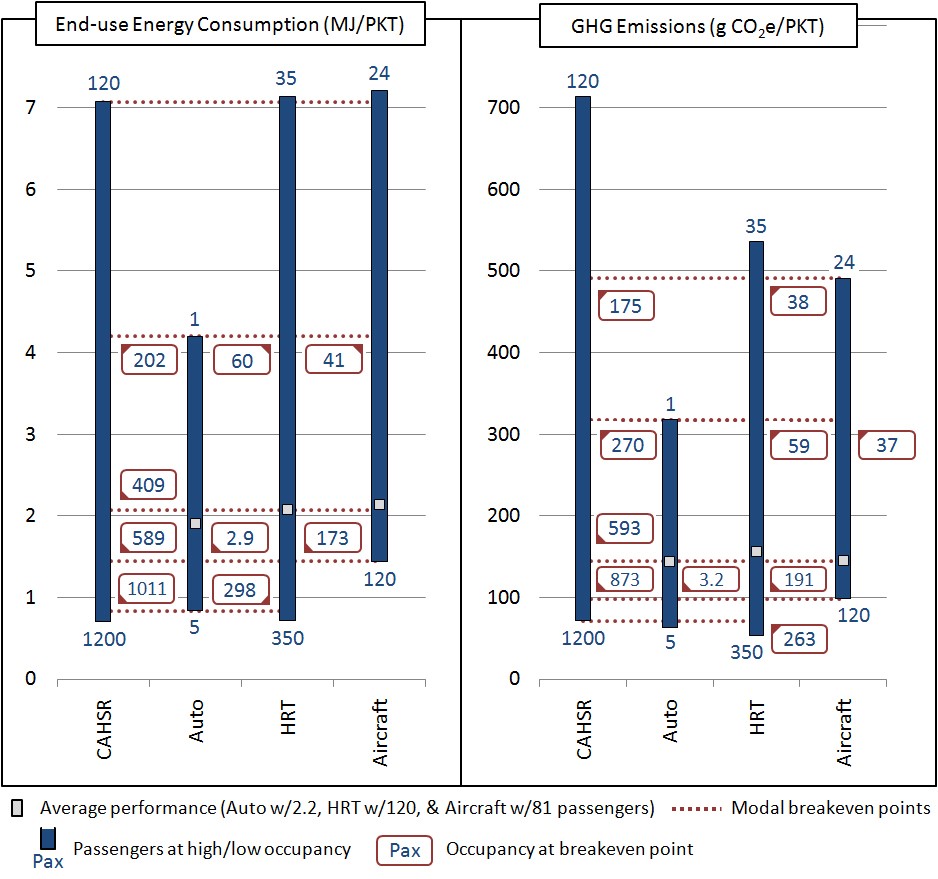
The consensus is that spending money on a new HSR system will lower transportation energy use and greenhouse gas emissions. However, these advantages may only be realized under specific conditions since several factors impact the HSR system. Therefore, breakeven points demonstrating the degree of utilization at which the modes compete may be determined by assessing the energy consumption and GHG emissions of the four methods from low to high occupancy. The following figure (Figure 7.8) shows the range in energy consumption and GHG emissions per PKT as vertical bars. Figure 2 illustrates the possibility for improvement, even if a mode may not be as ecologically beneficial as another mode at average occupancy. For instance, filling vacant seats for a journey that will take place regardless might enhance the environmental performance of the way at a possibly lower cost and resource investment than alternatives. Some methods also have much greater occupancy levels than others (Chester & Horvath, 2010).
Source: Chester & Horvath, 2010.
The following table (Table 7.7) shows the rates of investment return based on different modes in three categories: low occupancy, medium occupancy, and low occupancy.

(Chester & Horvath, 2010)
In addition to energy and GHG emissions, the impacts of releasing other emissions should be considered when performing environmental assessments for HSR systems. For example, according to what was discussed in this section, California HSR may have lower GHG emissions under occupancy rates and conditions. “Occupancy ranges are highlighted instead of average ridership to stress the broad range in the environmental performance of the modes. Moreover, the accessibility and frequency of service are two important factors affecting potential CAHSR ridership” (Chester & Horvath, 2010).
LCA is the most comprehensive methodological approach to measure GHG because it considers the construction, maintenance, and operation of transportation systems and the use phase. The driving factor in environmental impact assessments is the occupancy rate. A high use rate is suitable for mitigating GHG emissions, and low use rates mean adverse ecological impacts.
Houston-Dallas HSR
Data shows that among all states in the United States, Texas has the highest rate of GHG emissions, and most of this emission rate refers to transportation. After considering the positive impacts of HSRs and knowing that the Houston-Dallas corridor is the busiest route in Texas, developing and implementing a high-speed rail system to connect these two mega-regions in Texas have become a widely discussed solution in recent years. However, as discussed in the previous section, to comprehensively understand the actual environmental impacts of HSRs, we need to provide a lifecycle assessment of the Houston-Dallas HSR. Therefore, we inform this section by referring to the article Lifecycle Environmental Impact of High-Speed Rail System in the Houston-Dallas I-45 Corridor by Chipindula et al. (2021).
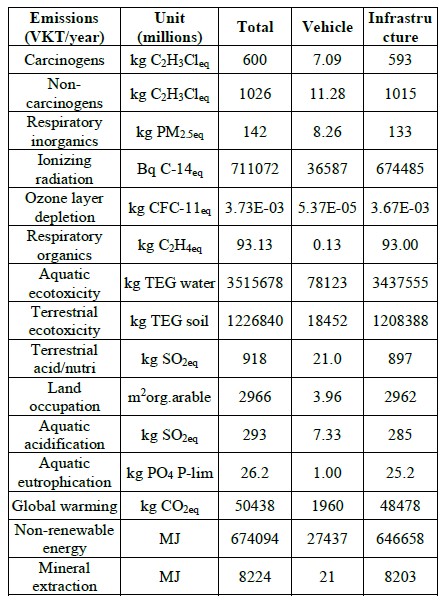
According to the analysis done by Chipindula et al. (2021), Infrastructure is the most critical category in emissions when doing the lifecycle process, with more than 80% of the total emissions in all types (Table 7.8). On the other hand, the impact of vehicle emissions is almost insignificant (a minimal amount of emissions) when compared to Infrastructure. In addition, all three categories of infrastructure construction, vehicle material processing, and operation phase use large volumes of diesel and gasoline to operate equipment, contributing to the negative environmental impacts caused by fossil fuel use. Figure 7.8 shows the analysis of the cumulative energy demand for two main categories, Infrastructure and vehicle (LCA of Houston-Dallas HSR).
Source: Chipindula et al., 2021.
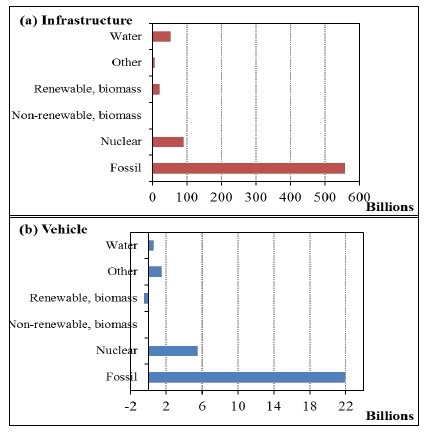
Source: Chipindula et al., 2021
The findings of this analysis indicate that, throughout the 20-year design life of the HSR system, total GHG emissions from the lifespan of the vehicles would be 9.695 kgCO2eq/VKT, with the principal source of GHG emissions—the use of fossil fuels during vehicle operation—accounting for 97% of the GHG emissions. Total lifetime GHG emissions for the Infrastructure would be 239 kgCO2eq/VKT, of which 94% are attributable to the building. With a cumulative effect of 58% across all damage categories, Infrastructure is the primary source of end-point impacts on the human health category (Chipindula et al., 2021).
Conclusion
This chapter examines the high costs of implementing, building, and operating High-Speed Rail Systems in European countries. Prices vary according to countries’ existing transportation infrastructure, urban form, and interconnection with other transportation modes, such as subway or light-rail systems. Importantly, this chapter critically examines, drawing from the principles of lifecycle assessment, the implications of California HSR. According to Chester and Horvath (2010), the environmental benefits of HSR in terms of GHG mitigation potential will depend on the system’s ridership. This reveals the importance of ridership for successfully implementing HSR in U.S. Cities. In addition, an interconnected HSR in highly urbanized and populated areas may increase ridership.
Glossary
- Cost-benefit analysis is a methodical methodology to assess the financial viability of proposed projects or policies. It entails weighing the costs of carrying out a certain project or policy against the potential benefits to society. The objective is to decide if the project or policy is worthwhile to pursue and whether the benefits exceed the costs. (Investopedia, August 26, 2021)
- High-speed rail is a passenger rail transportation that travels much faster than other rail traffic. The European Union has established specific parameters, such as 200 km/h (120 mph) for modified tracks and 250 km/h (160 mph) or faster for new routes. (https://railsystem.net/high-speed-rail)
- Life-cycle assessment (LCA) is a methodology for assessing environmental impacts associated with all the life cycle stages of a commercial product, process, or service. (Khadour, 2011)
Prep/Quiz Questions
- What can transportation planners learn from the European HSR system? Please draw on the examples of France, Germany, and Spain.
- Broadly, what are the advantages and disadvantages of HSR?
- Are the assumptions of demand for the California HSR reasonable? What considerations can be the most problematic? What are the most significant barriers to implementation?
References
BuildHSR: High-Speed Rail Projects. (2021, November 18). Construction Packages. https://buildhsr.com/construction-packages/
California High-Speed Rail Authority. (2021, November 18). California high-speed rail authority construction update. https://hsr.ca.gov/2021/11/18/news-release-california-high-speed-rail-releases-fall-2021-construction-update/
Campos, J., & de Rus, G. (2009). Some stylized facts about high-speed rail: A review of HSR experiences worldwide. Transport Policy, 16(1), 19–28. https://doi.org/10.1016/j.tranpol.2009.02.008
Chester, M., & Horvath, A. (2010). Lifecycle assessment of high-speed rail: The case of California. Environmental Research Letters, 5(1), 014003. https://doi.org/10.1088/1748-9326/5/1/014003
Chipindula, J., Du, H., Botlaguduru, V. S. V., Choe, D., & Kommalapati, R. R. (2021). Life cycle environmental impact of a high-speed rail system in the Houston-Dallas I-45 corridor. Public Transport. https://doi.org/10.1007/s12469-021-00264-2
Construction Review Online. (2021, August 2). California High-Speed Rail (CHSR) project. https://constructionreviewonline.com/news/california-high-speed-rail-chsr-project/
Patrick M. (2021, July 11). California high-speed rail (CHSR) project. https://constructionreviewonline.com/news/california-high-speed-rail-chsr-project/
European Court of Auditors. (2018). A European high-speed rail network: Not a reality but an ineffective patchwork. (Special report No 19, 2018). European Union Publications Office. https://www.eca.europa.eu/lists/ecadocuments/sr18_19/sr_high_speed_rail_en.pdf
California High-Speed Rail Authority. (2021, November 18). California high-speed rail authority construction update. https://hsr.ca.gov/2021/11/18/news-release-california-high-speed-rail-releases-fall-2021-construction-update/
James, R. (2009, April 20). A brief history of high-speed rail. Time. http://content.time.com/time/nation/article/0,8599,1892463,00.html
Manata, M. (2021, January 6). High-speed rail in California moves along but slowly. https://www.capradio.org/161688
Nunno, R. (2018), Fact Sheet | High Speed Rail Development Worldwide. Environmental and Energy Study Institute. https://www.eesi.org/papers/view/fact-sheet- high-speed-rail-development-worldwide.
Vickerman, R. (1997). High-speed rail in Europe: Experience and issues for future development. The Annals of Regional Science, 31(1), 21–38. https://doi.org/10.1007/s001680050037
Xinhua. (2021, January 9). China’s high-speed rail lines topped 37,900 km at the end of 2020. Xinhuanet. http://www.xinhuanet.com/english/2021-01/09/c_139654709.html
is a passenger rail transportation that travels much faster than other rail traffic. The European Union has established specific parameters, such as 200 km/h (120 mph) for modified tracks and 250 km/h (160 mph) or faster for new routes. (High-speed Rail. https://railsystem.net/high-speed-rail)
is a methodology for assessing environmental impacts associated with all the life cycle stages of a commercial product, process, or service. (Khadour, 2011)
Cost-Benefit Analysis (CBA) in urban planning is a systematic approach used to evaluate the economic feasibility of proposed projects or policies. It involves comparing the costs of implementing a particular project or policy with the expected benefits it would bring to society. The goal is to determine whether the benefits outweigh the costs and whether the project or policy is worth pursuing.(Investopedia, August 26, 2021)

