6 Transportation, Accessibility, and the Built Environment
CHAPTER OVERVIEW
This chapter examines the critical link between transportation and the built environment and is divided into three parts. The first part explores the current U.S. transportation system’s design for motorized mobility and speed and its impact on urban development. This section also highlights accessibility as a key connection between transportation and land use, distinguishing between local and regional accessibility and emphasizing the feedback loop between transportation, accessibility, land use, and travel patterns. A simplified road network example illustrates how travel-time savings between nodes can enhance overall network accessibility, driving urban decentralization and automobile-oriented growth at city edges. The second part delves into transportation and built environment research, focusing on transportation’s effects on land use (T→BE) and the built environment’s effects on transportation (BE→T). The third part discusses the emerging accessibility-based paradigm, which seeks to address the limitations of current mobility-focused transportation systems. Despite various proposed models, the shift to accessibility performance standards has been slow. The section explores factors and reasons.
CHAPTER TOPICS
LEARNING OBJECTIVES
Learning Objectives
- Identify key elements of the current transportation system that characterize it as designed for mobility and speed.
- Define accessibility, local accessibility, and regional accessibility providing examples.
- Describe the dynamic feedback loop between transportation, accessibility, land use and activity patterns of the transportation-land use feedback cycle in the context of the broader space economy.
- Explain and illustrate with an example how travel-time-saving improvements in a road network enhance regional accessibility and are likely to influence the location of new urban development.
- Describe key effects on land use of transportation (highways and transit investments) reported in research.
- Identify travel behavior findings of “Ds” research and relate why accessibility is a limitation of this research.
- Define and relate the concepts of derived and induced travel as major disadvantages of the mobility paradigm.
- Describe and contrast proposals for achieving an accessibility paradigm shift.
URBAN FORM, THE BUILT ENVIRONMENT, AND TRANSPORTATION
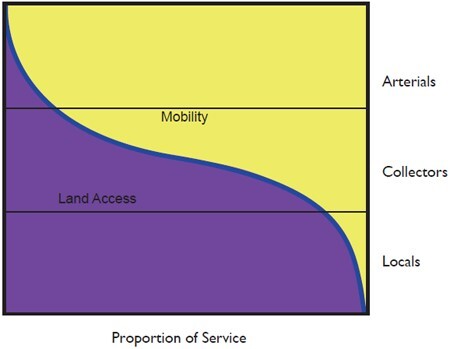
Urban form refers to the physical configuration of the built environment in an urban area or city. It encompasses all the features of the built environment, including buildings, public and open spaces, and its connective tissue– transportation networks. Land use, on the other hand, classifies areas into how land has been developed into the built environment for specific purposes, like residential, commercial, industrial, or agricultural use. These classifications are both descriptive and central to land use planning, which controls land use through zoning and subdivision regulations influencing the layout of the built environment. Additionally, in the U.S., the road network is functionally classified based on the proportion of mobility and access that each road type offers. This hierarchy ranges from limited-access interstate highways and freeways that prioritize motorized mobility and speed while excluding non-motorized modes to local streets and collectors, which offer local access at lower speeds to all modes (Figures 6.1 and Figures 6.2A and 6.2B in Table 6.1).
| EXAMPLES OF FUNCTIONAL CLASSIFICATION BY STATE DOTS | |
| Figure 6.2A | Figure 6.2B |
| Wisconsin DOT | Virginia DOT |
|
|
|
| Figure 6.2A Functional Classification. Image A by Wisconsin Department of Transportation https://wisconsindot.gov/Pages/doing-bus/real-estate/access-mgmt/am-principles.aspx | Figure 6.2B Functional Classification. Image A by Wisconsin Department of Transportation https://wisconsindot.gov/Pages/doing-bus/real-estate/access-mgmt/am-principles.aspx; Image B by Virginia Department of Transportation https://166.67.200.76/projects/fxn_class/home.asp |
Since the late 1950s, the hierarchy of mobility and speed has been central to transportation engineering and planning. This focus emerged in response to the rapid post-WWII growth in automobile ownership, the need to address congestion, and the goal of ensuring the swift movement of people and goods. Alongside Level of Service (LOS) performance standards, which define road speed performance based on functional classification, the four-step modeling process (discussed in Chapter Two) institutionalized a planning and decision-making framework centered on reducing congestion. This approach aimed to maintain adequate speed LOS through continuous road capacity expansion. As a result, for more than 50 years, the planning, design, and maintenance of the road network—often considered the connective tissue of the built environment—have prioritized fast, motorized mobility over accessibility and slower modes of transportation. This has contributed to the development of expansive, automobile-oriented development patterns and urban forms that favor regional over local accessibility.
Accessibility: the link between transportation and the built environment
Accessibility or access, first introduced in Chapter One and further explored in Chapter Four within the context of transportation equity, serves as the conceptual link between transportation and land use within the built environment. It is commonly defined as the ease with which opportunities—such as jobs, services, entertainment, or any activity—can be reached. This ease of access depends on various factors, including the mode of travel, the available transportation networks (ranging from trails and sidewalks to highways, rail and air and water systems), the spatial distribution of activities, and increasingly, virtual access. Accessibility can be considered at both local and regional levels.
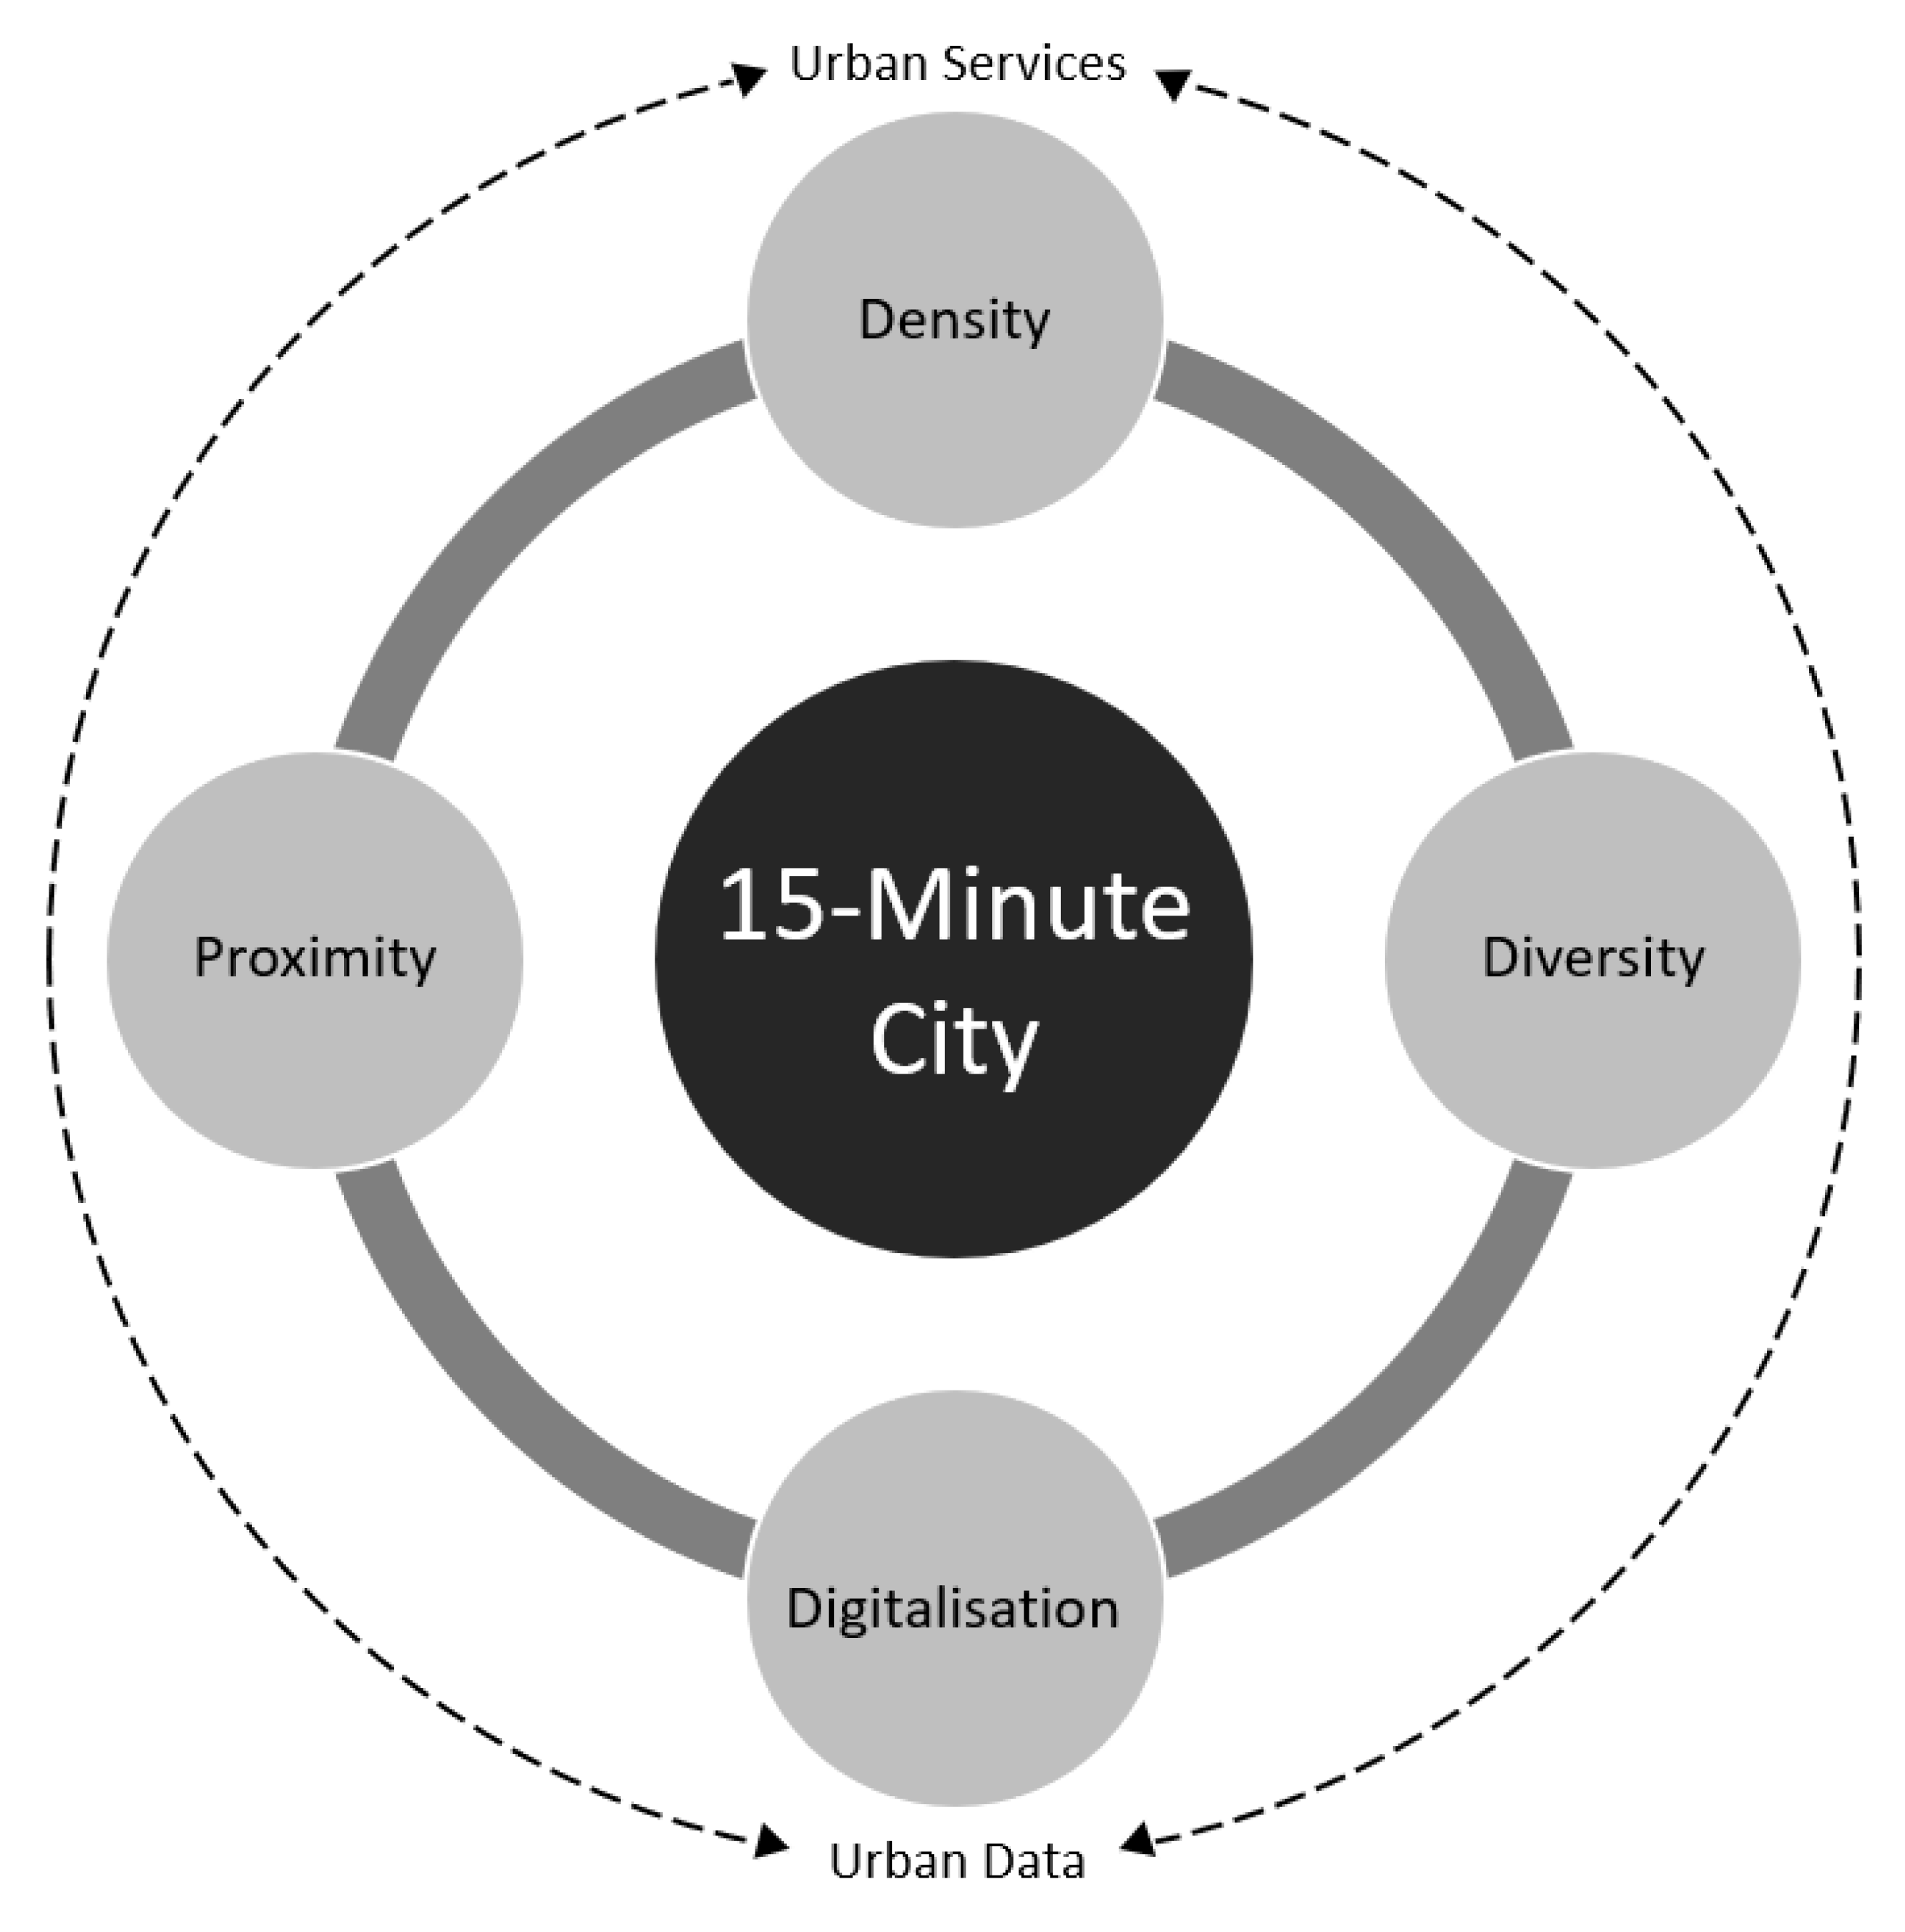
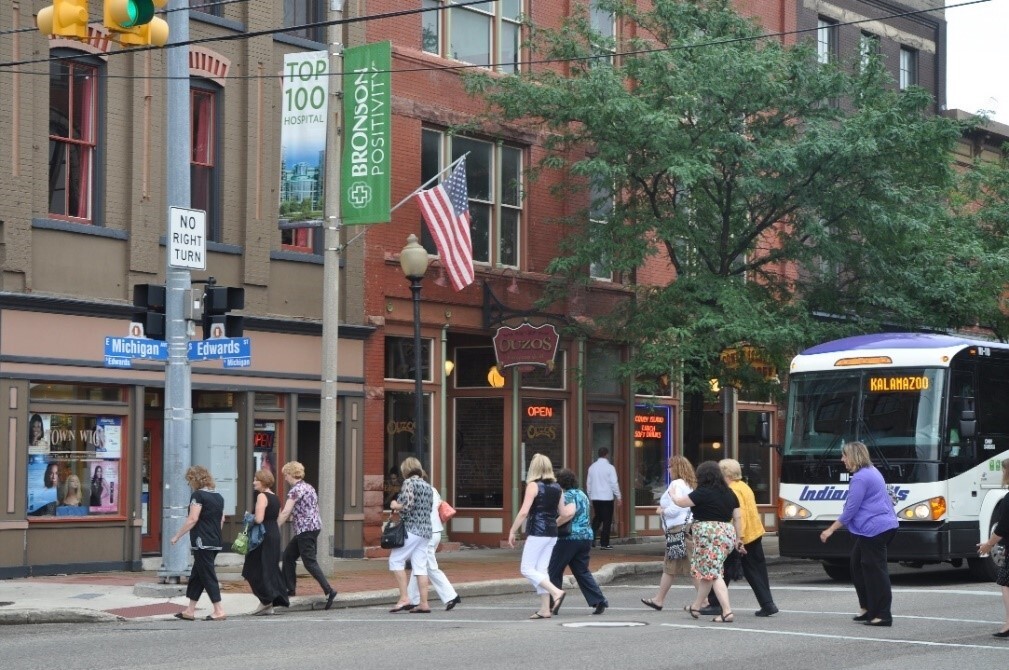
Local accessibility, or local access, refers to how easily people can reach nearby destinations, such as stores, pharmacies, schools, and restaurants, within their neighborhood. The closer these destinations are to residents, the more accessible they are. Local accessibility is influenced by factors like proximity, a mix of land uses, street network connectivity, and the availability of pedestrian and bike infrastructure. The concept is not new; it has been at the core of the neighborhood unit movement of the 1950s, revived by the New Urbanist movement of the 1990s, and recently repackaged in the idea of a 15-minute city (Moreno et al., 2021), drawing controversy (Mouratidis, 2024). This idea is also reflected in many older, dense, “walkable” American neighborhoods, where most daily destinations, including internet access, are reachable within a 15- or 20-minute walk (Figures 6.3 and 6.4).
Media 6.1 The 15-minute city. TED. (October 2020). Carlos, Moreno, The 15-minute city. [Video]. https://www.ted.com/talks/carlos_moreno_the_15_minute_city?subtitle=en
Media 6.2 Urban Design Lab. (2023, July 30). Is 15-Minute City the Future of Urban Living? [Video]. https://youtu.be/a1tUy8uqlOE
Media 6.3 Department of Energy, Environment & Climate Action. (2019, August 21). What is the 20-minute neighbourhood? [Video}. https://youtu.be/1oYvbrDVjcY?feature=shared
Regional accessibility, or regional access, refers to how easily people can reach destinations like employment centers, airports, hospitals, shopping centers, and universities across a city or metropolitan area. It primarily depends on the road and rail transit networks. While local accessibility prioritizes slower modes of transportation like walking and micromobility (bicycles and scooters), regional accessibility emphasizes the speed of motorized transportation—especially cars, which are the fastest option in most cities.
Figures 6.5.A to D, illustrate a major regional accessibility road improvement. It consists of an 18-year, $5.62 billion dollar federal and state-funded SR 520 (6-lane) freeway, bridge replacement, and corridor improvement project enhancing regional accessibility in Seattle, WA. The project refurbishes a six-mile stretch of the corridor between I-5 in Seattle and I-405 in Bellevue. 24th Avenue or Montlake Blvd, running N-S, intersects the corridor and connects the Montlake neighborhood with the University of Washington via the Montlake Bridge spanning across the Montlake Cut, part of Seattle’s Lake Washington. The project also features a bicycle and pedestrian bridge crossing over the corridor.
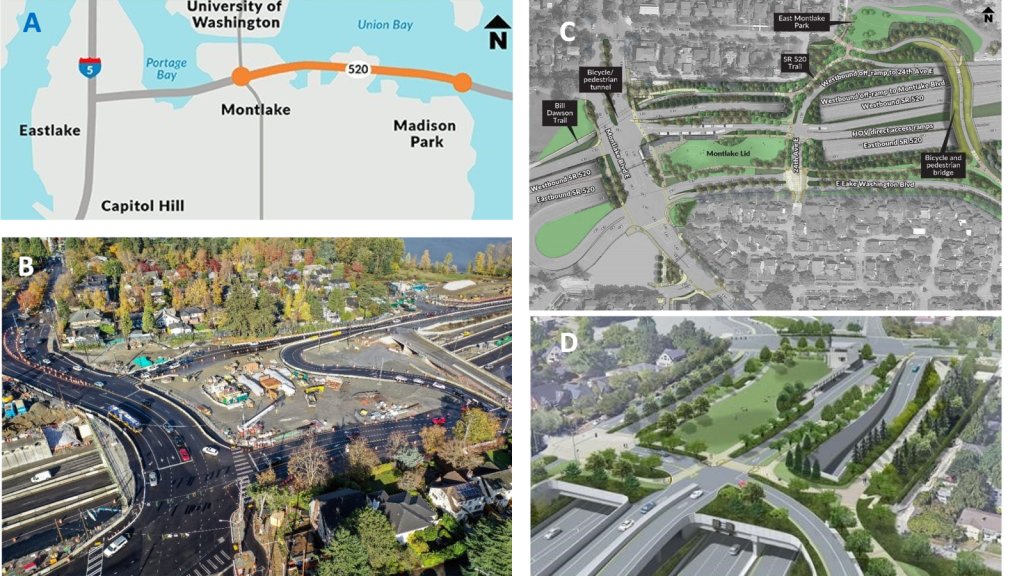
Note: “The photo highlights the recent lane shifts onto the lid of Montlake Boulevard and the westbound SR 520 off-ramp to Lake Washington Boulevard. At the time this photo was taken, crews had demolished the old Montlake Boulevard overpass (lower left) and were preparing to demolish the 24th Avenue Northeast overpass (upper right). Later, crews will extend the lid both to the east and west, then shift the two street crossings back to their previous alignments” (Washington State Department of Transportation, 2021) CC BY-NC-ND 2.0. https://www.flickr.com/photos/wsdot/51682347963
Transportation-land use dynamics
If we think of the transportation system as the connective tissue linking different land uses within an urban region, we can see how transportation and land use together shape the built environment, mutually influencing each other. This two-way interaction between land use and transportation is driven by accessibility (Hansen, 1959).
The following explanation, along with Figure 6.6, adapted from Wegener and Fürst (1999), the “land-use transport feedback cycle,” Giuliano (2004), and Bertolini (2012), illustrates this dynamic relationship. The structure, capacity, and connectivity of the transportation system, which vary across the urban region, determine accessibility—how easily locations can be reached. In turn, accessibility influences where activities are located, how attractive locations are for land use development, and the overall pattern of land use. The arrangement of land uses, combined with the transportation system that connects them, shapes daily activity patterns, leading to specific travel patterns and flows. These travel patterns then feed back into the transportation system, creating an ongoing cycle of interaction.
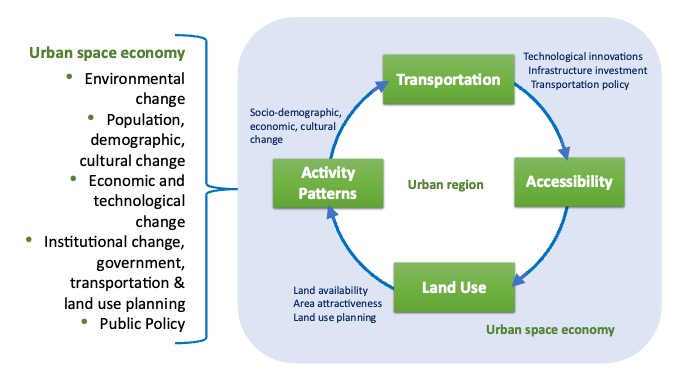
The land-use and transportation interactions shown in the figure are part of the broader urban region and space economy, which also influence changes in transportation, land use, and activities. Here are a few examples that illustrate these external influences and nuanced interactions:
- Technological Innovations: Advances in transportation, from canals and railroads to cars, as discussed in Chapter Eight, have had significant impacts on land development and urban form.
- Land Use and Development: The pattern and location of land uses are influenced not only by transportation and accessibility but also by the characteristics of available developable land. This, in turn, affects developers’ decisions, which are influenced by land use planning, as well as broader economic and market conditions.
- Socio-Demographic and Economic Changes: Events like economic recessions or the COVID-19 pandemic can reshape the geography of economic activity. For example, the rise of telework during and after the pandemic disrupted the transportation modal split in many cities, affecting public transit ridership, as discussed in Chapter Seven.
- Activity Patterns and Accessibility: Changes in activity patterns can alter accessibility even without changes to transportation infrastructure, such as when traffic congestion impacts travel times.
Additionally, changes in the cycle’s activity patterns can happen quickly, sometimes within days or months. In contrast, changes in the built environment and transportation infrastructure, such as Seattle’s 18-year SR 520 project, can take decades, often with long-lagged effects (Giuliano, 2004; Bertolini, 2012). This dynamic cycle of complex internal and external interactions makes it challenging for researchers to isolate the effects of transportation on the built environment (such as land use changes) and vice versa (Giuliano, 2004).
Accessibility and Transportation
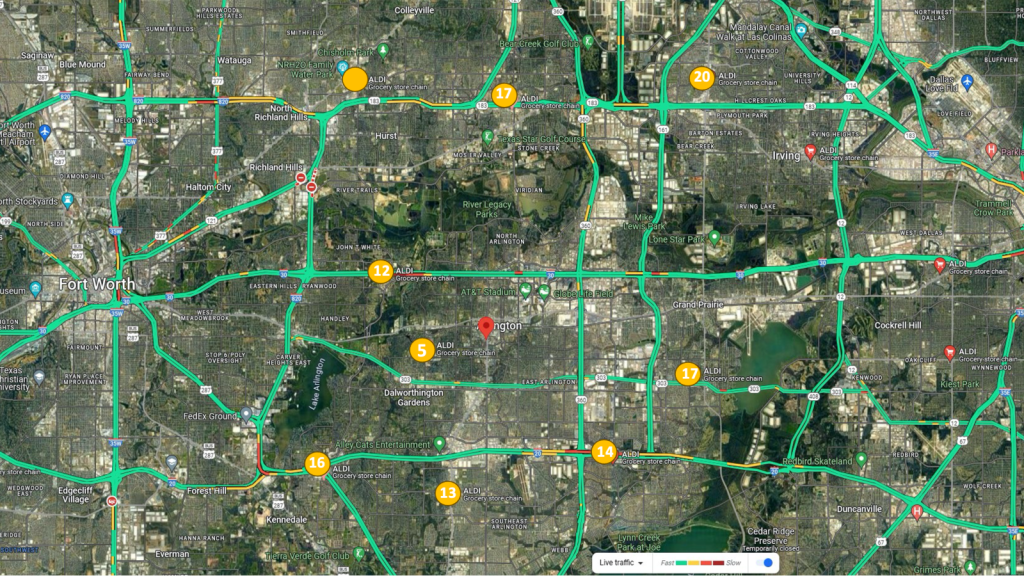
Chapter Four highlighted accessibility as a key transportation benefit. This is because the accessibility of a place to activities—the ease of reaching them—is enabled by the structure and capacity of the transportation network. In general, accessibility between two places increases as the movement between them is easier in terms of time or money. For instance, if the travel time from a residential place near UTA to location A, the closest Aldi grocery store, is 5 minutes while the travel time to location B, the second closest Aldi is 12 minutes, then A is considered more accessible than B, assuming all other factors held constant (such as time of day, goods available, store quality, etc.) (Figure 6.7).
Places that are easier to reach tend to be more attractive (again, assuming all other factors are constant), leading to a higher likelihood of interaction between them. Consequently, most Aldi shoppers from that residential neighborhood would be more likely to travel to location A than location B.
Place attraction is an important component of the concept of land-use-transportation accessibility because it illuminates the spatial interaction between places enabled by transportation networks and emphasizes that travel is a derived demand, i.e., we travel to engage in some activity (shopping, working, socializing, etc.). Giuliano (2004, p. 240) defines accessibility as the attractiveness of (1) a place as an origin, i.e., how easy it is to get from that origin to all other destinations, and (2) as a destination, i.e., how easy it is to get to there from all other destinations. The two are not symmetrical: origin accessibility emphasizes ease of reaching opportunities in all other locations, while destination accessibility underscores the opportunities located in that place.
To illustrate how a change in a motorized transportation network affects accessibility, Giuliano (2004, 240-241) provides a simple transportation network hypothetical example, modified here by the authors. Figure 6.8. shows the before and after travel time change in minutes after an improvement on the C—B link. This could be an intersection improvement like the one described above for Seattle’s SR 520 corridor or another infrastructure improvement that reduces travel time between B and C nodes.
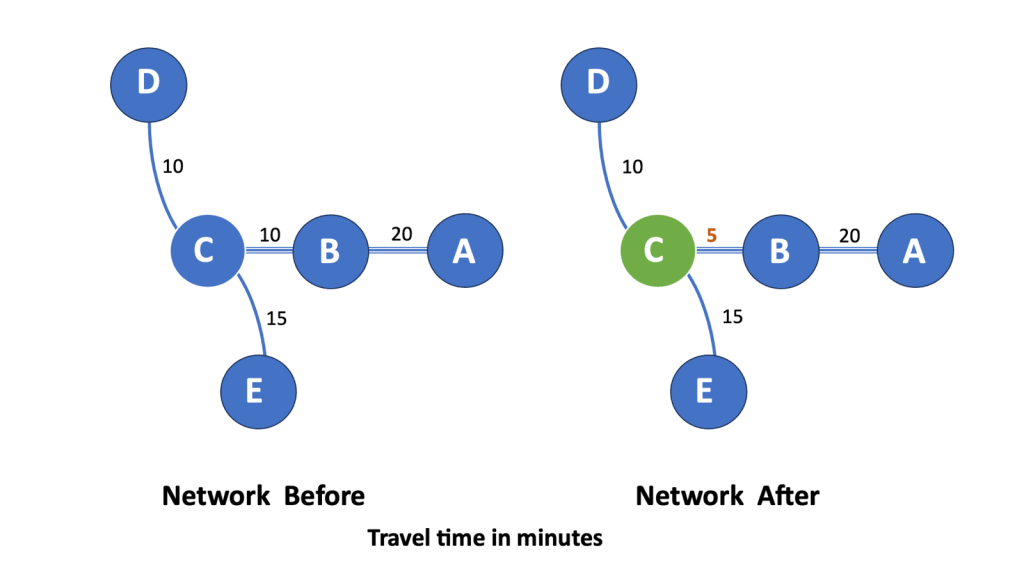
Table 6.2 summarizes the percentage change in network accessibility before and after a road improvement, as shown in the last column on the right. Since accessibility is measured in travel time, lower numbers indicate greater accessibility, assuming all other factors are equal. Each row’s sum represents the network’s accessibility for a specific node, calculated by adding the travel times from that node to all other nodes in the network.
|
Note: Adapted from Giuliano 2004, p. 241. Land use impacts of transportation investments, in S. Hanson and G. Giuliano (Eds.), The geography of urban transportation, third edition, Guildford Press. |
||||||||||||||
| NETWORK BEFORE |
NETWORK AFTER |
% Change |
||||||||||||
|---|---|---|---|---|---|---|---|---|---|---|---|---|---|---|
|
From/to |
A |
B |
C |
D |
E |
Total |
From/to |
A |
B |
C |
D |
E |
Total |
— |
|
A |
0 |
20 |
30 |
40 |
45 |
135 |
A |
0 |
20 |
25 |
35 |
40 |
120 |
-0.11 |
|
B |
20 |
0 |
10 |
20 |
25 |
75 |
B |
20 |
0 |
5 |
15 |
20 |
60 |
-0.20 |
|
C |
30 |
10 |
0 |
10 |
15 |
65 |
C |
25 |
5 |
0 |
10 |
15 |
55 |
-0.15 |
|
D |
40 |
20 |
10 |
0 |
25 |
95 |
D |
35 |
15 |
10 |
0 |
25 |
85 |
-0.11 |
|
E |
45 |
25 |
15 |
25 |
0 |
110 |
E |
40 |
20 |
15 |
25 |
0 |
100 |
-0.09 |
The road improvement, which reduces travel time between nodes B and C, enhances accessibility across the entire network. This accessibility improvement is reflected in the “percent change” column, which shows the difference in row sums before and after the network change. A negative sign indicates a reduction in travel time, with the largest accessibility gains occurring at nodes B and C, followed by nodes A and E. Conversely, factors like traffic delays, road construction, or frequent road accidents between two nodes would increase travel time, thereby reducing accessibility for those nodes and the overall network.
Accessibility, travel time savings, and the built environment
Since spatial interaction tends to increase with improved accessibility, land use activity is likely to grow at nodes that benefit the most from these gains. These locations often attract development and businesses, leading to economic growth (assuming all other factors are equal). However, this pattern doesn’t always hold true for every city or region, as it depends on specific conditions within the broader regional economy. While transportation improvements that enhance accessibility are one of several factors influencing land use and the location of firms and households, they alone do not guarantee widespread economic development or significant changes in the built environment. Such improvements are typically a necessary condition for development—capitalized in higher land values and real estate markets—but they are not sufficient on their own. In some cases, particularly depending on regional economic conditions, enhanced accessibility through fast mobility in certain parts of the transportation network may simply lead to a redistribution of economic activities toward the urban fringe, where land and development costs are lower (Giuliano 2004).
Since the 1960s, this trend has been evident in the U.S. and later in many developed countries, where rising car ownership and the expansion of extensive highway and road networks have made regional accessibility gains commonplace. These changes have drawn activities and city life away from older areas that once thrived on high local pedestrian accessibility (Silva and Altieri, 2022). Gains in accessibility from faster travel and time savings have enabled households and businesses to reach evermore distant locations easily, furthering decentralization (suburbanization) of urban activities.
As a result, megastores, outlet malls, car dealerships, food and hotel franchises, and large power retail centers (ranging from 200,000 to 800,000 square feet) have proliferated along beltways, interstates, and state highways at the urban fringe of most American cities. This type of freeway- or highway-oriented development, especially by big-box retailers like Walmart (Figure 6.9, 6.10), Target, and Home Depot, capitalizes on their close proximity to highways, which allows for lower shipping costs and better supply chain integration with their distribution centers (Ostrander, 2011). Besides enabling a culture of fast driving and road rage (Audirac 2008), the trade areas of these centers draw customers from 10 to 20 miles at the peri-urban fringe and five to 10 miles in the suburbs. Designed for cars, power centers have higher parking ratios than suburban malls, and “window shopping” involves driving from store to store. Many tenants offer both online and offline shopping options, with curbside pickup providing a complete drive-in experience (Christmann, 2024). Although more regulated and less extensive in Europe, hypermarkets—the equivalent of supercenters—have also proliferated at the edges of cities, with some established within city limits.
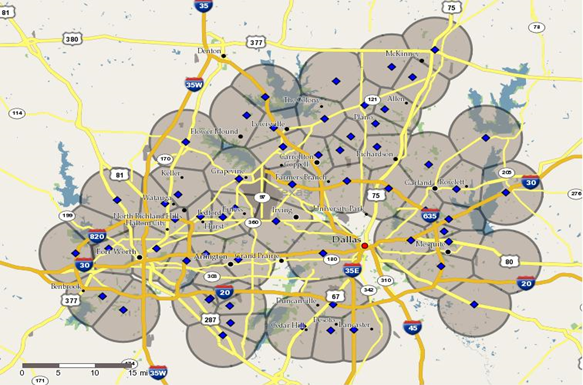
Note: The figure includes all types of Walmart stores, from discount (neighborhood) stores to supercenters and converted supercenters. The five-mile trade area circles were drawn by the author around each store irrespective of type. Supercenters are typically located along interstates and state highways.

LAND-USE AND TRANSPORTATION POLICY EFFECTS
Despite the challenges in isolating the direct effects of land use and transportation due to their dynamic interdependencies, the interaction between them in urban areas has been explored and researched utilizing urban economics, urban sociology, urban geography, and mobility systems theories, as noted by Wegener and Fürst (1999, 2004) in an influential research report. In their comprehensive review and analysis of research and modeling of land-use and transportation interactions at the urban regional level in the EU and the U.S., they provided a set of theoretical propositions and summarized empirical findings regarding the impacts of land use policies on transportation as well as the effects of transportation policies on land use and travel.
The results of empirical and land-use transportation modeling studies on policies affecting the location of land uses reviewed by Wegener and Fürst (1999, 2004), such as peripheral industrial campuses (estates) and out-of-town shopping centers, have shown that such decentralization negatively impacts the economies of central cities. However, housing policies aimed at centralizing population or clustering it in subcenters did not significantly influence transportation metrics like trip length, trip frequency, and mode choice.
Land use planning policies, such as urban growth boundaries or green belts, have been effective in slowing the rate of suburbanization. Conversely, the construction of outer ring roads (beltways) to relieve congestion has led to further decentralization and longer driving distances. Key findings from their review of research and modeling include:
- Reducing Car Use: Policies aimed at reducing car modal share and decreasing travel time and distance can only succeed if they make driving more expensive and less attractive.
- Urban Density: Land use policies that aim to increase urban density or mixed-use development will have little impact unless driving becomes more expensive or slower. People will continue to drive longer distances to maximize opportunities within their travel cost and time budgets.
- Transport Policies: Policies that make driving less attractive (more expensive and slower) are the most effective in reducing travel distances and car usage, particularly in areas where settlement patterns are not too dispersed.
- Large Retail and Leisure Facilities: These developments increase driving distances and car usage. Policies that prevent such developments are more effective at influencing travel behavior than those promoting high-density, mixed-use development.
- City Centers: Policies that restrict car use in city centers have not been shown to harm the economic vitality of those centers, except where massive retail development has been permitted on the outskirts.
- Public Transit: Policies that make public transit more attractive have not significantly reduced car travel. While they have spurred some development near transit stations, they have also contributed to further suburbanization.
- Effectiveness of Policies: Overall, transport policies are far more direct and effective in influencing urban travel behavior than land use policies. (Wegener and Fürst,1999, 2004, p.83-84).
Transportation and built environment research
The relationship between the built environment (BE) and transportation (T) in the U.S. has been researched in two primary ways: the impact of transportation on the built environment (T → BE) and the influence of the built environment (land use) on travel behavior (BE → T).
While both research traditions (T → BE and BE → T) complement each other, they have different histories, planning contexts, and scales of analysis. T → BE research originated in the 1950s and 1960s, focusing on predicting changes in transportation demand to help transportation engineers and policymakers decide where to build new roads and rail lines to address congestion and improve regional accessibility. In contrast, BE → T research gained prominence in the 1990s, driven by the New Urbanism and Smart Growth movements. These movements emphasized land-use policy as tools for enhancing local accessibility through compact, mixed-use developments, aiming to reduce driving and increase transit use, particularly through transit-oriented development (TOD), as discussed in Chapter Five, as well as promoting active transportation like walking and cycling. This shift toward local accessibility also led to a move away from traditional census tracks and TAZ-aggregated modeling and research, favoring disaggregated models that focus on individuals’ travel behavior.
This section will first highlight key findings from T→ BE research before exploring insights from BE→ T research, which will serve as a segue into the final section on the accessibility paradigm in transportation.
Transportation effects on the built environment: T → BE
As discussed in Chapter Two, trip-based modeling (four-step model) was developed to forecast travel demand and traffic flows during the construction of the Interstate Highway System (IHS). By the late 1960s, rising opposition to highway construction, as mentioned in Chapter Four, along with growing environmental concerns, led to increased federal investment in public transit as an alternative to driving. Consequently, cities like San Francisco, CA (BART), Atlanta, GA (MARTA), and Washington, DC (METRO) began developing heavy rail transit systems, while light rail projects were initiated in cities such as San Diego, CA, Portland, OR, and Buffalo, NY.
Multiple waves of T→ BE studies have examined the impacts of new highways and transit systems on the built environment, often using changes in land values as a proxy for land-use change. For highways, the first generation of studies occurred in the 1950s and 1960s, followed by a second wave in the 1970s and 1980s. For rail transit, the initial wave of heavy rail construction took place in the 1960s and 1970s, with light rail development in the 1970s and 1980s, leading to rail studies spanning the 1970s through the 1990s (Giuliano, 1989; Ryan, 1999). A third wave of highway and public transit studies emerged in the 1990s and early 2000s, driven by sustainability concerns related to highway-land use impacts on urban sprawl, increased driving due to improved fuel efficiency, and the associated rise in greenhouse gas emissions linked to vehicle miles traveled (VMTs).
Early studies on the impact of highway construction on land use showed significant effects, but these findings were primarily limited to the first wave of highway development. In contrast, the effects of rail transit have generally been minimal or confined to areas within a 1/2 to 1.5-mile radius around stations. The initial construction of the Interstate Highway System (IHS) greatly enhanced accessibility in metropolitan areas, spurring nationwide suburbanization of both residential and industrial areas in the post-WWII era. However, as motorized accessibility became more widespread, the relative impact of new highway and rail infrastructure on accessibility diminished (Giuliano, 1989; Giuliano, 2004).
Later research has produced mixed and sometimes contradictory results regarding the effects of transportation infrastructure on land use. A review of a selected group of intraregional (within a single metropolitan area) and regional (encompassing a state or several metropolitan areas) empirical studies—chosen for their robust methodology, high-quality data, and innovative research approaches—also found varied outcomes (Giuliano and Agarwal, 2017). Regional studies indicated that while highway investments did have an impact on land use, broader economic factors played a more significant role. Intraregional studies suggested that the significant impacts of highway investments on land use varied greatly depending on the local context of cities within the metropolitan region (Giuliano and Agarwal, 2017).
The effects of rail transit on land use were also found to be highly variable, depending on the specific city and its social and economic context. For example, the Bay Area Rapid Transit (BART) system had a notable impact on real estate values in San Francisco’s Central Business District (CBD) during its early years (1975-1992), contributing to an already thriving economy (Cervero and Landis, 1997). However, Oakland’s CBD, despite being the most accessible node in the BART network, did not experience the same level of impact due to its different economic and social makeup. Light rail systems primarily affected land values within the immediate vicinity of stations, and some of these increases occurred in anticipation of the rail line’s construction (Giuliano 2004). Table 6.3 provides a summary of these findings on the effects of transportation infrastructure on the built environment.
| blank cell | HIGHWAY IMPACTS ON LAND USE | RAIL TRANSIT IMPACTS ON LAND USE |
|---|---|---|
| SCALE |
|
|
| ACCESSIBILITY |
|
|
| CONTEXT |
|
|
| POLICY |
|
|
| THEORY / ASSUMPTIONS |
|
|
| MODELING APPROACH |
|
|
| LIMITATIONS | Direction of causality defined a priori not drawn from the studies | |
| Note: Table by authors based on Giuliano and Agarwal (2017). | ||
Built environment effects on transportation: BE → T
Research on the built environment’s impact on travel behavior underscores the significance of local accessibility. While recognizing the overall dominance of cars at the regional level, as shown in census data on urban modal share (Chapter Five, Table 5.X), this research approach stresses the importance of local variations to fully understand how neighborhood-level features influence walking, cycling, and driving. These variations extend beyond the familiar differences between central cities and suburbs and are largely shaped by local accessibility factors such as density, the design of street networks, and the layout and mix of destinations. For instance, Boarnet et al. (2011) analyzed over two thousand travel diaries (2005-2007) from South Bay suburbanites in California and found that while most trips (86%) were by car, neighborhoods with centrally concentrated retail zones (community centers) had higher average rates of walking (0.19 walking and 2.0 driving trips per day) compared to those with retail arranged along arterials (corridors), which had lower walking rates (0.07 walking and 2.3 driving trips per day). These findings held after accounting for other factors like demographic differences and residential selection bias.
A note on BE → T research issues
Since its inception, selection bias has been a key issue in land-use and travel behavior studies. The debate centers on whether the built environment shapes individuals’ travel behavior or if individuals’ lifestyle preferences influence their choice of places that align with their travel needs. This bias, also known as self-selection, tends to overestimate the impact of the built environment on travel behavior, thus weakening the clarity of cause-and-effect relationships. As a result, researchers must account for this bias in their studies. Additionally, socio-demographic factors and attitudes toward travel are significant influences that need to be accounted for through regression or other statistical techniques. Another challenge in BE→T research is avoiding the ecological fallacy—making inappropriate causal inferences about individuals based on aggregated data at TAZs or census tracts. To mitigate this, BE→T research typically uses disaggregated data from household or individual travel surveys or travel journals. Publication bias is a third issue, especially in meta-analysis research, which systematically reviews and analyzes the findings of other published studies. Since statistically significant results are more likely to be published, meta-analyses often overlook non-significant findings, potentially leading to a skewed understanding of the effects being studied.
“Ds” research
As introduced in Chapter Five, BE→T research aims to answer policy and planning questions related to travel responding to land-use changes at the neighborhood level. For instance, would increasing zoning density and promoting mixed land uses in an area lead to more active travel, less car use, and reduced vehicle miles traveled (VMT)? A highly influential meta-analysis by Ewing and Cervero (2010) reviewed over 50 BE→T empirical studies to extract the “size effect,” measured as elasticities of five built environment variables—density, diversity, design, destination accessibility, and distance to transit (the 5 Ds)—on walking, transit use, and VMT. This analysis, which was built on an earlier study focused on VMT (Cervero and Ewing, 2001), pooled the elasticities from each study to obtain weighted averages. However, given the limited number of studies included and the fact that many did not control for self-selection, the authors cautioned that their results should be seen as suggestive rather than definitive until more and more robust data becomes available (p.275). The weighted average elasticities for travel outcomes related to different built environment indicators are listed in Table 6.4.
|
BUILT ENVIRONMENT FACTORS |
INDICATORS |
ELASTICITIES (E) AND NUMBER OF STUDIES (#) |
|||||
|---|---|---|---|---|---|---|---|
|
WALKING |
TRANSIT |
VMT |
|||||
|
E |
# |
E |
# |
E |
# |
||
|
DENSITY |
Household population density |
0.07 |
0/10* |
0.07 |
0/10* |
-0.04 |
1/9* |
|
Job density |
0.04 |
0/6 |
0.01 |
0/6 |
0.00 |
1/6 |
|
|
Commercial floor/area ratio |
0.07 |
0/3 |
— |
— |
— |
— |
|
|
DIVERSITY |
Land use mix (entropy index) |
0.15 |
1/8 |
0.12 |
0/6 |
-0.09 |
0/10 |
|
Jobs housing balance |
0.19 |
0/4 |
— |
— |
-0.02 |
0/4 |
|
|
Distance to a store |
0.25 |
3/5 |
— |
— |
— |
— |
|
|
DESIGN |
Intersection/street density |
0.39 |
2/7 |
0.23 |
0/4 |
-0.12 |
0/6 |
|
% 4-way intersections |
– 0.06 |
1/5 |
0.29 |
2/5 |
-0.12 |
1/3 |
|
| DESTINATION ACCESSIBILITY |
Job within one mile |
0.15 |
0/3 |
— |
— |
— |
— |
|
Job accessibility by auto |
— |
— |
— |
— |
-0.20 |
5/0 |
|
|
Job accessibility by transit |
— |
— |
— |
— |
-0.05 |
3/0 |
|
|
Distance to downtown |
— |
— |
— |
— |
-0.22 |
3/1 |
|
| DISTANCE TO TRANSIT |
Distance to nearest transit stop |
0.15 |
2/3 |
0.29 |
1/3 |
-0.05 |
6/1 |
|
* Ratio of: Number of studies with self-selection control/number of studies analyzed |
|||||||
| Note: Adapted by authors based on Ewing and Cervero, 2010, Travel and the built environment: A meta-analysis. | |||||||
The results indicate that travel variables (the dependent variables) are inelastic (e < 1.0), meaning that a 1% change in a built environment variable results in less than a 1% change in travel behaviors, such as walking, transit use, and vehicle miles traveled (VMT). The highest weighted average elasticity was 0.39 for the relationship between intersection density and walking, while density variables had the weakest influence on all travel behaviors.
The authors highlight that consistent with previous research, VMT (a proxy for driving) is most strongly associated with destination accessibility variables, followed by street network design. Walking, on the other hand, is most influenced by intersection density and land use diversity. Transit use is primarily affected by proximity to transit stops and street network design. In a subsequent study by Ewing and colleagues (2014), the built environment’s influence on the travel behavior of 62,011 households across 15 U.S. regions was examined, yielding similar findings. All the “D” variables affect household travel, with diversity, design, and destination accessibility having the strongest impact, while density had the weakest. Interestingly, the study also found that socioeconomic factors had the strongest influence on travel behavior, based on significance levels alone.
For their analysis, scales ranging from 0.25 miles to more than one mile were found to be adequate, with larger scales offering greater predictive power. The authors suggest that their models could be used to calibrate four-step trip models, which typically overlook the impact of built environment factors like density, diversity, and design on trip generation and mode choice (p. 2345).
THE ACCESSIBILITY PARADIGM
While the 5-Ds framework has become a widely accepted approach for understanding the relationship between land use and travel, it has limitations, particularly in addressing accessibility. Handy’s (2018) critical commentary on “Ds” research (Box 5.# in Chapter Five) highlights its shortcomings, noting that it lacks a behavioral theory to explain travel behavior and overlooks the interdependent nature of the “D” variables through accessibility. By treating the “D” variables as independent, “Ds” research neglects “place accessibility,” which involves the distribution of destinations, the ease of reaching them by various modes, and the nature and intensity of activities at those destinations (p. 2). Simply put, accessibility—defined as the range of travel options the built environment offers individuals, considering the cost of overcoming distance—is viewed by some transportation researchers (Handy, 1994, 2018, 2020; Cervero, 1995, 2005; Litman, 2024) as an appropriate focus for BE→T research and central to shifting transportation thinking and practice from mobility to accessibility.
The accessibility paradigm represents a shift from focusing on mobility as the primary framework and performance measure of transportation systems to emphasizing accessibility. While the concept of accessibility has existed since the 1920s, its modern understanding emerged in the 1950s with Hansen’s (1959) mathematical formulation and gained further traction in the 1970s as a tool for evaluating transportation equity (Wachs and Kugmani,1973) and as a substitute for mobility and speed measures (Morris et al.,1979). These early works argued against using mobility and speed as central transportation measures, as they overlook the fundamental purpose of travel: reaching destinations and participating in activities—reflecting the derived nature of travel demand (Levine, 2020). By the 1990s, accessibility re-emerged, emphasizing local accessibility (proximity) as the rationale behind compact, mixed-use New Urbanism and transit-oriented development (TOD). These approaches aligned with sustainability goals aimed at limiting urban sprawl, reducing vehicle miles traveled (VMT), and promoting health and social equity, forming what Levine (2020) calls the smart growth and urbanist policy agenda. The shift from mobility to accessibility has also been driven by the growing recognition that congestion mitigation through road expansion—summed up in the phrase “we can’t build our way out of congestion”—is both ineffective, as it induces more travel (EPA, 2002), and is increasingly unaffordable (Handy, 2020). Despite California’s recent efforts to replace level of service (LOS) performance measures with an accessibility-based approach (Handy, 2020), the adoption of such practices remains slow across the U.S.
Barriers to accessibility-based transportation planning
At least three views explain this delay. The first view emphasizes three reasons: the presence of competing transportation concepts, such as “universal accessibility” related to transit services for persons with disabilities; the conflation of “mobility” and “accessibility” in policy documents, from legislative acts like TEA-21 to the FAST Act, and in metropolitan planning organizations’ long-range plans (see Proffitt et al., 2019); and accessibility measures being more complex to calculate and communicate to non-experts, in addition to their lack of standardized guidelines, making them more difficult to adopt when compared to mobility measures (Handy, 2020). The second viewpoints to the entrenched institutional focus on mobility measures, which has resisted the viability of accessibility-based concepts. This view also points to the “urbanist” proximity-based policy agenda that prioritizes local accessibility (walking, cycling, and transit) over regional accessibility (faster motorized modes), thereby hindering changes in how transportation success is evaluated (Levine, 2020, p. 4).
The third perspective highlights the widespread appeal of automobility among the public and policymakers, and the enduring influence of the Motor Age, including its extension into the current and future Smart City concept (as discussed in Chapter Eight). This view points out how this appeal often leads to an underestimation of the negative impacts of car dependency, such as public health issues, sustainability challenges, social equity concerns, and extensive urban decentralization (Filippi, 2024).
A proposed accessibility-based model for cities
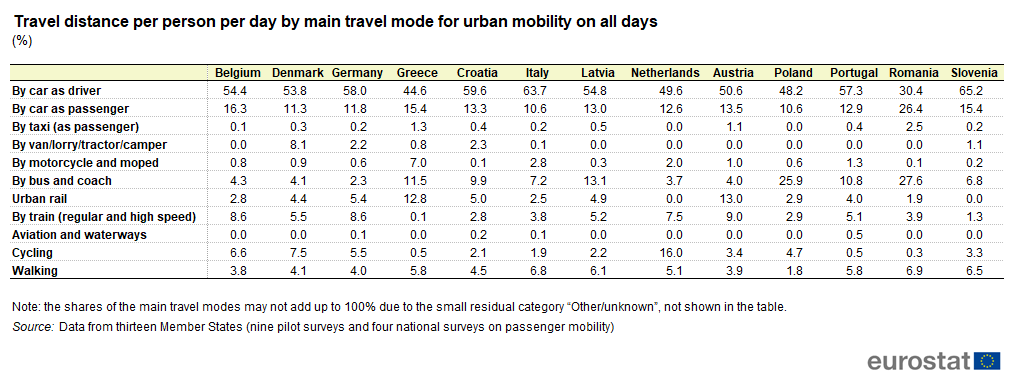
Filippi (2024) compares three evolving transportation paradigms observed in cities worldwide: North American automobility, European multimodality, and the emerging accessibility paradigm (Figure 6.11). While Western European cities are often viewed as models for American cities aiming to balance local and regional accessibility through extensive transit services and real-time intermodal integration, car travel still holds a high modal share in these cities, albeit with differences among the 13 EU countries shown in Table 6.4. For example, car travel represents the largest share of total distance traveled per person per day in Italy (74%) and Slovenia (81%), while Poland (58.8%) and the Netherlands (62.2%) have the lowest car shares. As a result, most European cities have experienced rising greenhouse gas emissions and worsening congestion (Filippi, 2024).
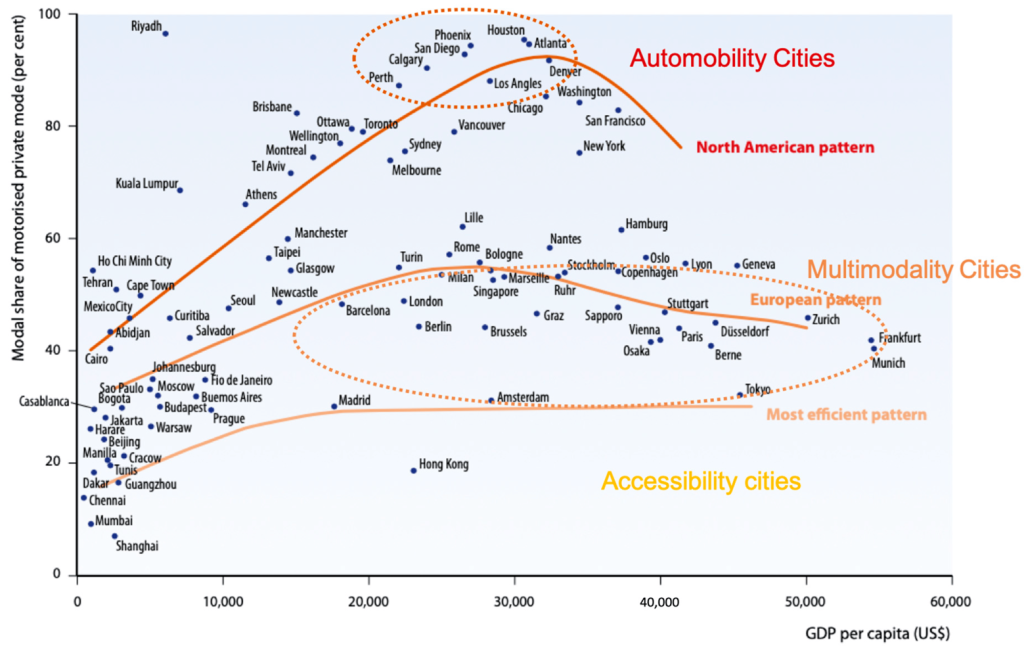
According to Filippi, the accessibility vision for EU cities, drawing ideas from European and American proposals, and inspired by Paris’ 15-minute cities and Barcelona’s superblocks, involves a triple-access system that integrates three different types of accessibility: digital connectivity, active transportation through local accessibility (spatial proximity), and regional accessibility via multimodal motorized transportation, see Table 6.5.
- Digital Connectivity: Encompasses remote work, online education, shopping, banking, telemedicine, etc., and digital intermodal integration, as discussed in Chapters Eight and Five, respectively.
- Active Transportation System: Utilizes spatial proximity concepts, like the 15-minute city or 20-minute neighborhood, to enable access to local amenities within walking or biking distance. Through mobility hubs, this system serves as a feeder to public transit networks, making cars an option rather than a necessity.
- Multimodal Transportation System: Focuses on quality transit networks and shared mobility services to provide access to regional destinations, such as city centers (CBDs), subcenters, and other neighborhoods.
|
Note: Adapted by authors from Filippi (2024) |
|||
|
Accessibility System |
Connectivity Infrastructure |
Destination Interactions |
Attractors |
|---|---|---|---|
|
ICT /Digitized |
Digital, IP, IOTs, intelligent transportation, multimodal integration |
Online, real-time information |
Online work, education, shopping, banking, telehealth, e-commerce, etc. |
|
Active transport (local) |
Micromobility, walking, cycling, local streets, sidewalks. |
Spatial proximity (15-20 minute), local accessibility, |
Neighborhood retail, services, and amenities |
|
Motorized transport (regional) |
Bus, shared demand response, streets, mobility hubs, network stops |
Sector of a city, 15 to 30 min. |
Centers, corridors |
|
Metro, LRT, BRT, TOD, Rail and dedicated line networks. |
City, metro area < 60 min |
CBD, airport, transit stations, tourist sites, universities, shopping centers. |
|
|
Commuter train, TOD Rail network, and stations |
Region > 60 min |
CBDs, subcenters, suburbs |
|
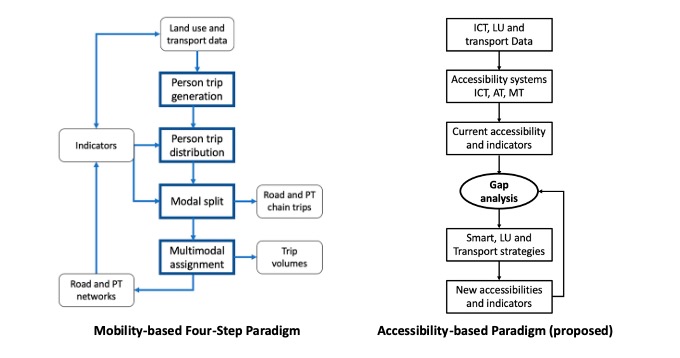
Figure 6.13 above contrasts the current mobility-based four-step model, discussed in Chapter Two, with a proposed accessibility-based model, as outlined by Filippi (2024). Instead of forecasting travel demand, this new model begins by formulating a desired future scenario, developed with input from the public and stakeholders. It then backcasts to the present, identifying the policies and projects needed to achieve that scenario. The transportation plan is evaluated based on accessibility.
In this model, the zones from the four-step model no longer function as trip attractors or generators. Instead, they represent the first level of access to services and activities, classified into three levels: single main centers (within a 60-minute motorized travel shed), multiple subcenters (within 30-minute motorized travel sheds), and neighborhood centers (15-minute walking sheds). The 15-minute neighborhood zones serve as the model’s basic unit, prioritizing local accessibility at walking and cycling speeds and favoring public transit over automobiles for regional travel beyond the local neighborhoods. A gap analysis comparing current and desired accessibility levels to key destinations guides the development of strategies aimed at maximizing accessibility while minimizing the need for mobility.
Filippi (2024) acknowledges that this paradigm is still in its infancy, requiring significant coordination between transportation and land use planning institutions to overcome the entrenched mobility-based paradigm. However, the transition should proceed through pilot studies, trials, and experimentation to avoid overwhelming stakeholders. Establishing new accessibility standards and indicators to replace traditional tools like the four-step model should be a priority in advancing this new paradigm.
Transformation or reform in accessibility shift proposals?
Recently, there has been a surge in the development of accessibility metrics and tools. Litman (2024, pp. 46-51) provides extensive information and links to websites dedicated to this purpose. And while there is broad international agreement among academics that a shift to an accessibility-based paradigm is necessary, there is still no consensus on a framework and on how it would be done. Despite several initiatives to develop practitioner-friendly frameworks and metrics—such as the Accessibility Observatory at the University of Minnesota, the publication of accessibility guides like the NCHRP Report 1000 Accessibility Measures in Practice: A Guide for Transportation Agencies, SSTI’s Measuring Accessibility, and the University of Sydney’s Committee of the Transport Access Manual —the adoption of accessibility measures by practitioners remains limited.
This limited uptake suggests a need for simpler accessibility indicators, such as the number of stores within a half mile of home, that directly relate to built-environment qualities and the ease of reaching destinations. According to Handy (2020), combining these straightforward indicators with a robust accessibility framework would help facilitate the shift and promote the diffusion of the accessibility paradigm.
However, proponents of the shift towards accessibility differ in goals, priorities, and degree of integration with the current mobility system. Martens (2020) classifies proposals into radical, limited, and moderate, summarized by the authors in Table 6.6.
|
|
Radical Shift (Handy, Cervero, Litman, Filippi) |
Limited shift (Handy) |
Moderate shift (Levine, Grengs, and Merlin) |
|---|---|---|---|
|
Mobility system’s problem |
Congestion mitigation via capacity expansion induces more travel, reinforces automobility. |
Level of services, traffic speeds, travel time savings and performance metrics prioritize speed and automobility. |
Fails to recognize mobility (travel) as derived demand. People travel to reach destinations, not for the sake of movement. |
|
Accessibility system’s goals/purpose |
Instrumental for overcoming mobility system’s environmental and social externalities (traffic safety, GHG pollution, urban sprawl, obesity, equity,) building livable communities expanding modal choice. |
Reforming mobility system’s metrics and performance indicators toward enhancing accessibility likely to overcome mobility system’s externalities. |
Increasing people’s capacity to reach destinations. Accessibility: an inherent system’s goal and benefit based on derived demand. Accessibility a goal among many (education, employment, housing) |
|
Accessibility system’s priorities |
Reduce need to travel; more locally accessible land use development; improved ICT integration. 15-minute city; non-motorized transport and public transit. |
Accessibility performance indicators and less road capacity expansion; more public transit enhancement, travel demand management, and road and parking pricing |
Mobility along with proximity and connectivity (virtual or physical) are means for accessibility. But mobility and proximity interaction can have (+ or -) effects on accessibility. No particular urban form favored, nor mode. |
|
Accessibility planning approach |
Comprehensive planning balancing trade-offs between land use and transportation policies with focus on level of service of the whole metropolitan area, rather than just of the transportation system. |
Existing mobility system’s planning incorporates accessibility performance indicators primarily in the evaluation phase. |
Accessibility evaluative framework and metrics integrated at all phases of transportation and land use planning. Public input for evaluating projects’ outcomes: do they increase or degrade accessibility? Do they advantage mobility by some modes versus others? Do they render its distribution more or less equitable?” |
|
Note: Table by authors based on Martens (2020). |
|||
Though there is convergence in the critique of the current mobility system, there is also divergence among proposals for the new system. Those questioning “radical” models like Filippi’s proposal raise concerns about whether this change can achieve broader societal goals, such as sustainability and health improvements. They argue that prioritizing local accessibility and walkability in neighborhoods that are already car-dependent for regional travel will likely result in minimal reductions in driving and vehicle miles traveled (VMT), as people will continue to rely on cars to reach their destinations (Levine et al., 2019).
Rather than imposing broad societal goals on accessibility frameworks without certainty of outcomes, some suggest that these models should focus on the derived nature of travel and on accessibility as an inherent goal of transportation systems. This would shift the core question from “How fast can people travel?” to “How many places can people reach?” (Levine et al., 2019).
Others, like Martens (2020), argue that focusing solely on accessibility is insufficient because it overlooks the needs of people. Martens advocates for a principle of justice that emphasizes “sufficient accessibility for all” as the fundamental goal of transportation systems. He contends that it is the government’s responsibility to ensure that everyone has adequate access to essential services and opportunities. In this people-centered approach, transportation planning would be redefined as the “field of government intervention that seeks to guarantee sufficient accessibility for all” (Martens, 2020, p. 20). Success would be assessed by the system’s ability to provide sufficient accessibility to everyone, rather than by its ability to alleviate congestion, which is the current standard. This approach would focus on solutions for groups lacking sufficient accessibility.
Readers looking to deepen their understanding of how to quantify and assess accessibility, and how it applies to evaluating the performance of transportation and land use patterns, are encouraged to explore the “Concepts,” “Uses,” “Planning,” and “Measures” sections of the Transport access manual: A guide for measuring connection between people and places by David Levinson and COTAM (2020).
CONCLUSION
This chapter examined key concepts linking transportation and the built environment, emphasizing the U.S. transportation system’s focus on motorized mobility and speed. This approach is reflected in the FHWA’s road network classification, Level of Service (LOS) standards, and four-step travel demand modeling. Accessibility emerged as a critical link between transportation and land use, differentiating local and regional accessibility and illustrating the feedback cycle between transportation, land use, and travel activity. A hypothetical road network example highlighted how travel-time savings drive urban decentralization and automobile-oriented growth at city edges, exemplified by big-box power centers along highways.
Research on transportation’s impact on the built environment (T→BE) confirmed that highway investments have fueled urban decentralization in the U.S., with economic activities shifting to city edges—a trend that began in the 1920s, accelerated in the 1950s and 1960s, and continues today. Similarly, increased driving in European cities has improved regional accessibility but diminished local accessibility, particularly in city centers. In contrast, built environment research (BE→T) has identified five factors—density, diversity, design, destination accessibility, and distance to transit (the “5 Ds”)—that promote active transportation and reduce driving. However, this framework has been criticized for neglecting accessibility as the core link connecting these factors and for shifting focus away from the needed transition to an accessibility-based approach.
While the accessibility paradigm seeks to address the failures of the current mobility-focused system, its adoption has been slow due to institutional inertia, conflicting proposals, and the challenges of reshaping car-dependent urban forms built over decades of investment in road infrastructure.
Readers are encouraged to follow the evolution of the emerging accessibility paradigm by exploring the links to new accessibility metrics and guidance provided in the chapter.
QUIZ
Exercises
GLOSSARY
Backcasting is a planning technique that starts with a desired future state and works backward to identify the steps necessary to achieve it. It’s a contrast to forecasting, which predicts future outcomes based on current trends.
Derived demand in transportation refers to the need for travel that arises not as a goal in itself but as a result of the desire to access goods, services, activities, or destinations. For example, commuting occurs because people need to reach their workplace, not because they seek to travel for its own sake.
Destination is the endpoint, where the traveler aims to reach. In accessibility measures, the focus is on evaluating how easily people can travel from various origins to desired destinations, considering factors like distance, travel time, and available transportation options.
Ecological fallacy is an error in which inferences are made about individuals based on observations made at the group level. In other words, it’s assuming that what’s true for a group is also true for its individual members. It would be an ecological fallacy to conclude that immigrants are more likely to commit crimes if a study finds that a city with a higher percentage of immigrants has a higher crime rate. This ignores individual-level factors that might contribute to the crime rate.
Elasticity of regression coefficients are regression coefficient estimates converted into ratios of percentage changes. They measure how a percentage change in an independent variable (like population density in the individual’s neighborhood) leads to a percentage change in the dependent variable (walking shopping trips per day) in a regression model. An elasticity of 0.29, for instance, quantifies in percentage the sensitivity of the dependent variable for a 100% change in the independent variable.
Gap analysis in planning is a process used to identify the difference between a current state and a desired future state. It involves comparing the existing situation to a target or benchmark to identify areas where improvements are needed. Gap analysis helps determine what needs to be done to achieve a desired outcome.
Induced travel demand refers to the phenomenon where increased transportation infrastructure capacity leads to an increase in travel demand. In other words, building more roads or adding lanes to roads to deal with congestion induces more people to travel, often negating the intended benefit of reducing congestion.
Level of Service (LOS) Performance Standards refer to a set of criteria defined by the Highway Capacity Manual (TRB, 2022) to evaluate the operational performance of a roadway. They are typically based on factors such as traffic flow, speed, travel time, and congestion. LOS grades range from A (free flow) to F (highly congested), indicating the level of comfort, convenience, and efficiency experienced by road users. These standards are commonly used in traffic engineering and planning to assess and improve road infrastructure.
Meta-analysis is a statistical technique that combines the results of multiple studies on a particular topic to draw a more comprehensive conclusion. It involves systematically searching for relevant studies, assessing their quality, and then statistically combining their findings to provide a more robust estimate of the overall effect.
Origin in transportation refers to the starting point of a journey, where the traveler begins.
Place attraction refers to the ability of a location to draw or attract trips due to the activities, amenities, or services it offers. These locations can be various types of destinations such as workplaces, shopping centers, schools, parks, entertainment venues, or any other places where people gather or engage in activities.
Self-selection bias in research occurs when individuals select themselves into a study or group, leading to a non-random sample that may not represent the broader population. This bias can distort results because participants’ choices are influenced by their characteristics or preferences, potentially confounding the relationship being studied.
Spatial interaction refers to the movement of people, goods, or information between locations, influenced by the ease of reaching destinations (accessibility) and the transportation networks connecting them. It reflects how transportation networks and land use patterns facilitate or hinder connections between places.
Travel shed refers to the size of a geographic area from which a particular destination attracts people (customers, students, employees, etc.). It’s essentially the catchment area for a transportation hub, such as an airport, train station, bus terminal or other destinations. The size of a travel shed is influenced by the mode of travel (walking, cycling, auto, etc.).
Universal accessibility in transportation refers to the design of transportation systems and facilities that are usable by everyone, regardless of their abilities. In the Americans with Disabilities Act (ADA) context, public transportation systems are required to be accessible to people with disabilities. This includes providing accessible vehicles, stops, and stations as well as ensuring that transportation services are accessible to people with visual, hearing, and mobility impairments.
REFERENCES
Audirac, I. (2008). Sharing fast-speed and slow-speed roads with bicyclists and pedestrians: A source of female and male driver frustration. Transportation Research Record, Societal and Economic Factors, 2067, Issue 1, 65–75. https://journals.sagepub.com/toc/trra/2067/1
Bertolini, L. (2012). Integrating mobility and urban development agendas: A manifesto. The Planning Review, 48(1), 16–26. https://doi.org/10.1080/02513625.2012.702956
Boarnet, M.G. (2017). Land use, travel behavior, and disaggregated data, pp. 164-184 in S. Hanson and G. Giuliano (Eds.), The geography of urban transportation, fourth edition, Guildford Press. https://www.guilford.com/books/The-Geography-of-Urban-Transportation/Giuliano-Hanson/9781462529650
Boarnet, M.G., Joh K., Siembab W., Fulton W., Nguyen M.T. (2011). Retrofitting the suburbs to increase walking: evidence from a land-use-travel study. Urban Studies, 48(1):129-59. doi: 10.1177/0042098010364859. https://pubmed.ncbi.nlm.nih.gov/21174897/
Christmann, S. (2024). Beyond the mall: 5 reasons power centers are outshining shopping malls. Buffalo News, Mar 17, 2024. https://tucson.com/news/nation-world/business/beyond-the-mall-5-reasons-power-centers-are-outshining-shopping-malls/article_3a87aacc-fcc8-58fd-8853-53135fafd9e1.html
Cervero, R. (1997). Paradigm shift: from automobility to accessibility planning. Urban Futures (Canberra), (22), 9–20. https://search.informit.org/doi/10.3316/ielapa.980100546
Cervero, R. (2005). Accessible cities and regions: A framework for sustainable transport and urbanism in the 21st century. Working paper ucb-its-vwp-2005-3, UC Berkeley, Center for Future Urban Transport. http://www.its.berkeley.edu/publications/UCB/2005/VWP/UCB-ITS-VWP-2005-3.pdf
Cervero, R. and Landis, J. (1997). Twenty years of the Bay Area Rapid Transit System: Land use and development impacts. Transportation Research A, 31 A (4), 309-333. https://doi.org/10.1016/S0965-8564(96)00027-4
Dalkmann, H. and Sakamoto, K. (2006). Transport: Investing in energy and resource efficiency. Green Economy Report, UNEP: Nairobi, Kenya; UITP: Brussels, Belgium.
EPA (2002). Guidebook on induced travel demand prepared for the US EPA by Jack Faucett Associates. December 2002. https://nepis.epa.gov/Exe/ZyPDF.cgi/94004L98.PDF?Dockey=94004L98.PDF
Eurostat (2024) Travel mode. Car still dominant. European Commission https://ec.europa.eu/eurostat/statistics-explained/index.php?title=Passenger_mobility_statistics#Travel_mode
Ewing, R., & Cervero, R. (2001). Travel and the built environment: A synthesis. Transportation Research Record, 1780(1), 87-114. https://doi.org/10.3141/1780-10
Ewing, R., & Cervero, R. (2010). Travel and the built environment: A meta-analysis. Journal of the American Planning Association, 76 (3), 265-294 http://tandfonline.com/doi/full/10.1080/01944361003766766
Ewing, R., Tian, G., Goates, J. P., Zhang, M., Greenwald, M. J., …, & Greene, W. (2014). Varying influences of the built environment on household travel in 15 diverse regions of the United States. Urban Studies, 52(13), 2330 – 2348. https://dx.doi.org/10.1177/0042098014560991
Filippi, F. (2024). Visions, paradigms, and anomalies of urban transport. Future Transportation, 4 (3): 938-967. https://doi.org/10.3390/futuretransp4030045
Giuliano, G. (1989). New directions for understanding transportation and land use. Reprint UCTC # 2, University of California Transportation Center, University of California Berkeley. https://citeseerx.ist.psu.edu/document?repid=rep1&type=pdf&doi=73abb133c4d4a16bafc8506095d3d0d705a8658b
Giuliano, G. (2004). Land use impacts of transportation investments, pp. 237-277, in S. Hanson and G. Giuliano (Eds.), The geography of urban transportation, third edition, Guildford Press.
Giuliano, G. and Agarwal, A. (2017). Land use impacts of transportation investments, pp. 218-246, in S. Hanson and G. Giuliano (Eds.), The geography of urban transportation, fourth edition, Guildford Press. https://www.guilford.com/books/The-Geography-of-Urban-Transportation/Giuliano-Hanson/9781462529650
Handy, S. (1993). Regional versus local accessibility: Implications for nonwork travel. UC Berkeley, Earlier Faculty Research, the California Digital Library, University of California https://escholarship.org/uc/item/2z79q67d
Handy, S., 1994a. Highway blues: Nothing a little accessibility can’t cure. Access 5, 3–7. https://www.accessmagazine.org/fall-1994/highway-blues-nothing-a-little-accessibility-cant-cure/
Handy, S. (2018). Enough with the “D’s” already — Let’s get back to “A.” Transfers, Spring, 2018. https://transfersmagazine.org/wp-content/uploads/sites/13/2018/05/Susan-Handy-_-Enough-with-the-Ds.pdf
Handy, S. (2020) Is accessibility an idea whose time has finally come? Transportation Research Part D: Transport and Environment, Vol. 83 https://doi.org/10.1016/j.trd.2020.102319
Hansen, W.G. (1959): How accessibility shapes land use. Journal of the American Institute of Planners 25, 73-76.
Levine, J. (2020). A century of evolution of the accessibility concept. Transportation Research Part D: Transport and Environment, Vol. 83 https://doi.org/10.1016/j.trd.2020.102309
Levine, J., Grengs, J., & Merlin, L. A. (2019). From mobility to accessibility: transforming urban transportation and land-use planning. Cornell University Press. http://www.jstor.org/stable/10.7591/j.ctvfc52mj
Levinson, D. and COTAM (2020). Transport access manual: A guide for measuring connection between people and places. Committee of the Transport Access Manual, all rights reserved. Licensed by the authors under Creative Commons license CC BY-NC 4.0. https://transportist.org/transport-access-manual-a-guide-for-measuring-connection-between-people-and-places/
Litman, T. (2024). Evaluating accessibility for transport planning measuring people’s ability to reach desired services and activities. 31 July 2024, Victoria Transport Policy Institute. https://www.vtpi.org/access.pdf
Martens, K. (2020). A people-centered approach to accessibility. International Transportation Forum, Roundtable 182. ITF, OECD, Paris. https://www.itf-oecd.org/sites/default/files/docs/people-centred-accessibility.pdf
Morris, J. M., Dumble, P.L., Ramsay W. M. (1979). Accessibility indicators for transport planning. Transportation Research Part A: General 13 (2), 91–109. https://doi.org/10.1016/0191-2607(79)90012-8
Moreno C., Allam Z., Chabaud D., Gall C., and Pratlong F. (2021). Introducing the “15-Minute City”: Sustainability, resilience and place identity in future post-pandemic cities. Smart Cities. 2021; 4(1):93-111. https://doi.org/10.3390/smartcities4010006
Mouratidis, K. (2024). Time to challenge the 15-minute city: Seven pitfalls for sustainability, equity, livability, and spatial analysis, Cities, Vol. 153, 2024, 105274, ISSN 0264-2751, https://doi.org/10.1016/j.cities.2024.105274 .
Ostrander, A.P. (2011). The expansion of retail chain: An analysis of Wal-Mart locations in the United States, Geography MS Thesis, University of North Texas. https://digital.library.unt.edu/ark:/67531/metadc68027/m2/1/high_res_d/thesis.pdf
Proffitt, David; Bartholomew, K., Ewing, R. and Miller, H. J. (2019). Accessibility planning in American metropolitan areas: Are we there yet? Urban Studies, Vol. 56(1): 167-192. https://doi.org/10.1177/0042098017710122
Silva, C. and Altieri, M. (2022). Is regional accessibility undermining local accessibility? Journal of Transport Geography, Volume 101, 2022, ISSN 0966-6923, https://doi.org/10.1016/j.jtrangeo.2022.103336 .
Stevens, M. R. (2016). Does compact development make people drive less? Journal of the American Planning Association, 83(1), 7–18. https://doi.org/10.1080/01944363.2016.1240044
TRB (2022). Highway capacity manual 7th edition: A guide for multimodal mobility analysis. Transportation Research Board and National Academies of Sciences, Engineering, and Medicine. https://doi.org/10.17226/26432 https://nap.nationalacademies.org/catalog/26432/highway-capacity-manual-7th-edition-a-guide-for-multimodal-mobility
Wegener, M., & Fürst, F. (1999). Land-use transport interaction: State of the art. Deliverable D2a of the project TRANSLAND (integration of transport and land use planning). Dortmund: University of Dortmund.
Induced travel demand refers to the phenomenon where increased transportation infrastructure capacity leads to an increase in travel demand. In other words, building more roads or adding lanes to roads to deal with congestion induces more people to travel, often negating the intended benefit of reducing congestion.
Level of Service (LOS) Performance Standards refer to a set of criteria defined by the Highway Capacity Manual (TRB, 2022) to evaluate the operational performance of a roadway. They are typically based on factors such as traffic flow, speed, travel time, and congestion. LOS grades range from A (free flow) to F (highly congested), indicating the level of comfort, convenience, and efficiency experienced by road users. These standards are commonly used in traffic engineering and planning to assess and improve road infrastructure.
Place attraction refers to the ability of a location to draw or attract trips due to the activities, amenities, or services it offers. These locations can be various types of destinations such as workplaces, shopping centers, schools, parks, entertainment venues, or any other places where people gather or engage in activities.
Spatial interaction refers to the movement of people, goods, or information between locations, influenced by the ease of reaching destinations (accessibility) and the transportation networks connecting them. It reflects how transportation networks and land use patterns facilitate or hinder connections between places.
Derived demand in transportation refers to the need for travel that arises not as a goal in itself but as a result of the desire to access goods, services, activities, or destinations. For example, commuting occurs because people need to reach their workplace, not because they seek to travel for its own sake.
Origin in transportation refers to the starting point of a journey, where the traveler begins.
Destination is the endpoint, where the traveler aims to reach. In accessibility measures, the focus is on evaluating how easily people can travel from various origins to desired destinations, considering factors like distance, travel time, and available transportation options.
Selection bias (aka self-selection) in research occurs when individuals select themselves into a study or group, leading to a non-random sample that may not represent the broader population. This bias can distort results because participants' choices are influenced by their characteristics or preferences, potentially confounding the relationship being studied.
Self-selection (aka selection bias) in research occurs when individuals select themselves into a study or group, leading to a non-random sample that may not represent the broader population. This bias can distort results because participants' choices are influenced by their characteristics or preferences, potentially confounding the relationship being studied.
Ecological fallacy is an error in which inferences are made about individuals based on observations made at the group level. In other words, it's assuming that what's true for a group is also true for its individual members. It would be an ecological fallacy to conclude that immigrants are more likely to commit crimes if a study finds that a city with a higher percentage of immigrants has a higher crime rate. This ignores individual-level factors that might contribute to the crime rate.
Meta-analysis is a statistical technique that combines the results of multiple studies on a particular topic to draw a more comprehensive conclusion. It involves systematically searching for relevant studies, assessing their quality, and then statistically combining their findings to provide a more robust estimate of the overall effect.
Elasticity of regression coefficients are regression coefficient estimates converted into ratios of percentage changes. They measure how a percentage change in an independent variable (like population density in the individual’s neighborhood) leads to a percentage change in the dependent variable (walking shopping trips per day) in a regression model. An elasticity of 0.29, for instance, quantifies in percentage the sensitivity of the dependent variable for a 100% change in the independent variable.
Universal accessibility in transportation refers to the design of transportation systems and facilities that are usable by everyone, regardless of their abilities. In the Americans with Disabilities Act (ADA) context, public transportation systems are required to be accessible to people with disabilities. This includes providing accessible vehicles, stops, and stations as well as ensuring that transportation services are accessible to people with visual, hearing, and mobility impairments.
Backcast or backcasting is a planning technique that starts with a desired future state and works backward to identify the steps necessary to achieve it. It's a contrast to forecasting, which predicts future outcomes based on current trends.
Travel shed refers to the size of a geographic area from which a particular destination attracts people (customers, students, employees, etc.). It's essentially the catchment area for a transportation hub, such as an airport, train station, bus terminal or other destinations. The size of a travel shed is influenced by the mode of travel (walking, cycling, auto, etc.).
Gap analysis in planning is a process used to identify the difference between a current state and a desired future state. It involves comparing the existing situation to a target or benchmark to identify areas where improvements are needed. Gap analysis helps determine what needs to be done to achieve a desired outcome.

