10 Transportation in the Global South
CHAPTER OVERVIEW
This chapter delves into transportation in cities of the Global South, highlighting the planning issues and challenges faced by these cities, as well as the frequent innovations and opportunities found in their metropolitan regions. It explores various modes of mobility, including public transit, the rise of private vehicle use, and non-motorized travel modes, addressing prevalent mobility issues. The chapter is enriched with case studies that illustrate the unique transportation challenges and opportunities in these contexts.
LEARNING OBJECTIVES
Learning Objectives
- Identify some of the challenges of transportation in the Global South from the perspective of commuters and governments.
- Compare and contrast some of the various transportation options and infrastructure approaches in terms of mobility costs of time and money and accessibility gains.
- Describe some of the key initiatives cities in the Global South have undertaken to improve transportation and examine opportunities to utilize similar approaches in the Global North.
CHAPTER TOPICS
- Accessibility and Uneven Development
- Non-Motorized Transport and Micromobility
- Uneven Development
- Public Transit, Bus Rapid Transit (BRT) and Innovations
- Informal or “Popular” Transport
- Conclusion
- Quiz
- Glossary
- Acronyms
INTRODUCTION
Transportation challenges in the Global South, which includes regions like Africa, Latin America, and much of Asia, differ significantly from those in the Global North. While car ownership rates have declined in advanced market economies, motorized trips are increasing rapidly in developing countries due to population and economic growth and income disparities. Projections indicate that by 2050, the majority of vehicle usage will occur in developing nations, especially in cities across China, India, and other Asian countries (International Transport Forum, 2017).
Although surface transportation planning is a well-integrated dimension of formal mobility systems in North America, Europe, and Australia, the diverse urban contexts, socioeconomic conditions, and political environments in the Global South make generalization challenging. Most cities in the Global South rely on two mobility systems: formal and informal. The formal system follows Western mobility standards but remains inaccessible to many, while the informal system, or “Popular Transportation,” “moves more people in the world than all formal transportation modes combined” (NDP 2024, p. 2). In many African and some Latin American cities, informal paratransit modes handle up to 95% of public transport (Venter et al., 2019). Emerging transportation planning practices in the Global South are now re-evaluating the role of informal and hybrid mobility systems, especially with the advent of digital platforms, which introduce a new form of “semi-formalization” of transportation (UNDP 2022, 2024).
Transportation planning in in rapidly urbanizing and motorizing areas must address vastly different mobility and accessibility demands compared to cities growing a slower pace in the Global North. Comparing Global South cities in terms of success in achieving Western transportation standards provides little insight into the unique challenges faced by cities in the Global South. In this chapter, we will discuss various aspects of transportation planning in the Global South and provide examples from cities in these regions.
ACCESSIBILITY SERVED AND UNDERSERVED POPULATIONS
As discussed in several chapters of this book, accessibility, or the ability to reach destinations like jobs, schools, and markets without spending large amounts of money and time, is a key benefit of transportation systems. Accessibility depends on the mode of travel (walking, biking, motorcycle, bus transit, or car) and the land use and built environment characteristics of the city. Locations closer to desirable destinations enjoy more accessibility than those far away, typically requiring some form of motorized transportation to reach opportunities in large cities.
Access to affordable and reliable transportation is essential for socioeconomic development globally. Improving transportation access can enhance opportunities for employment, education, healthcare, and social inclusion. Research indicates that many residents of the Global South face high mobility costs in terms of time and money or low access to opportunities, or a combination of both. Figure 10.1 illustrates this with a two-axis diagram representing mobility expenditures along the Y-axis and accessibility in terms of the number of opportunities reachable within 60 minutes along the X-axis.
As shown on the left quadrant, underserved populations experience the lowest levels of accessibility due to high mobility costs in time and money (“mobile-underserved”) or severely limited mobility options (“stranded underserved”). The “mobile-underserved” often live on the periphery, out of transit reach, relying on costly often unaffordable motorized vehicles (cars and motorcycles). “Stranded underserved” residents, typically in informal settlements, lack public mobility options and road infrastructure, relying on walking or biking. Conversely, as shown on the right quadrant, “well-located commuters” are more affluent residents living in older, more centrally located neighborhoods, facing long commutes due to job distance or congestion. “Well-located urbanites,” a minority, enjoy high job accessibility and good public transit, however, low income residents of these locations often face housing affordability issues. This framework, derived from research in Johannesburg and Mexico City, reflects conditions and challenges in many large Global South cities, marked by disproportionately large numbers of transportation underserved residents, rapid urbanization, motorization, congestion, and transportation inequities (Venter et al., 2019).

The following map by the World Resources Institute categorizes cities of the world into four types and shows the diversity of cities even within the same country. Cities emerging and struggling characterize most of the Global South. These cities typically experience “rapid urban population growth, limited financial, technical and governance capacity” (Venter et al., 2019, p. 10).
Case Study: Cairo, Egypt
Like Mexico City and Johannesburg, Cairo (metro population 22.62 million), one of the largest cities in the Middle East and North Africa faces significant access-mobility challenges. Rapid population growth has led to increased congestion, air pollution, and strained transportation infrastructure. Notably, Cairo has low average individual accessibility, especially in lower-income neighborhoods, which can be categorized as “stranded underserved” (ElDessouki, 2022; Venter, Mahendra, & Hidalgo, 2019). Many people in Cairo rely on public transportation due to limited access to private vehicles, as shown in Figure 10.3. However, public transit options, such as buses and the metro, often suffer from overcrowding, unreliability, and insufficient coverage, making it difficult for residents to move around the city efficiently (El-Kadi, 2013).
Cairo exhibits a large variation in modal split, reflecting socio-economic disparities within the city. Public transportation is widely used, especially by lower-income residents, but a significant portion of the population relies on taxis and informal minibuses (a.k. a. microbuses) for daily commutes (Transport for Cairo, 2022; “Transport in Cairo,” 2023). Wealthier residents have more mobility options, including private cars. Accessibility to work or school is critical for the “mobile underserved,” who spend a significant portion of their income on transportation, and for the “stranded underserved,” whose limited transportation options hinder their socioeconomic activities.

Many Cairo residents face challenges accessing jobs and educational institutions due to limited transportation options, long commute times, and traffic congestion. This lack of accessibility exacerbates economic inequality and hinders social mobility for marginalized communities (Transport for Cairo, 2022). To address these issues, the Egyptian government has initiated projects to improve mobility and accessibility, such as expanding the metro system, investing in bus rapid transit (BRT) corridors, and implementing traffic management strategies (Kahachi, 2019; Transport in Cairo, 2023). Solving these complex transportation challenges requires innovative access-based planning, investment, and coordination among government agencies, transportation operators, and the community. Innovative transportation planning approaches are proposed to enhance access for underserved groups and manage private vehicle demand, serving as a model for researchers and practitioners globally.
UNEVEN DEVELOPMENT
Many cities in the Global South lack robust transportation infrastructures, such as roads, bridges, and public transit systems, alongside basic services like water and housing (Gandy, 2006). However, this is not uniformly the case. Within the same city, some urbanized areas have received more investment, leading to significantly better transportation amenities than others. This results in uneven development and varying experiences of accessibility (Collard, Goodfellow, & Asante, 2021; Venter, Mahendra, & Hidalgo, 2019).
Case Study: Lagos, Nigeria
Areas with poor road quality and construction face significant challenges in surface mobility and economic development. Lagos, Nigeria (metro population 16.53 million), one of Africa’s fastest-growing cities, exemplifies these issues common in cities of the Global South experiencing extremely rapid urbanization (Lagos, 2024). While upscale neighborhoods and central business districts in Lagos have modern infrastructure, including well-maintained roads, bridges, and high-rise buildings, stark disparities exist in access to basic services and infrastructure across the megacity. In areas of informal settlements, roads are often unpaved or poorly maintained, making transportation difficult, especially during the rainy season when flooding is common (Salau, 2015).

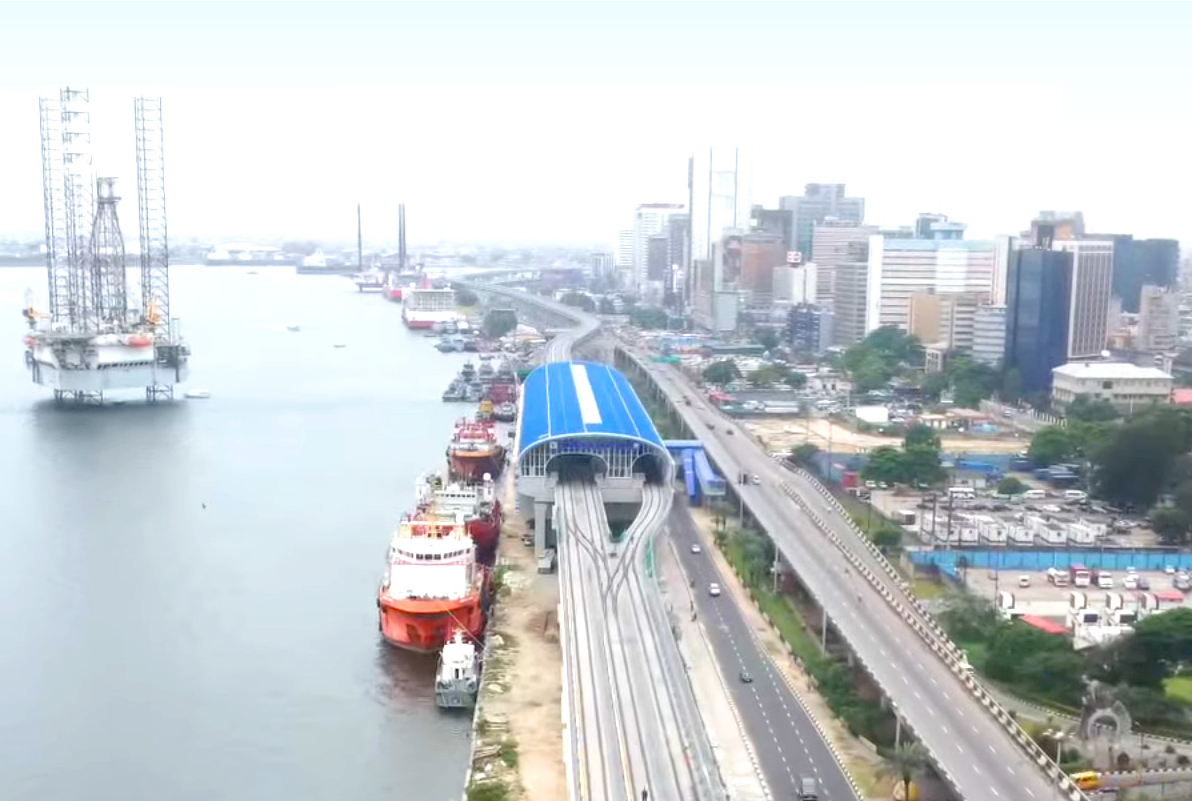
These disparities reflect broader socio-economic inequalities and governance challenges. The video below shows the edge community of Agbado, the terminus of Lagos’ Red Line suburban railway, which is currently under construction and will connect Abgado with the Marina station in Lagos Island on the coast. The rail line investment, part of an ambitious seven-line rail system, a monorail, and high-speed rail project is expected to drastically reduce commute times in the metropolitan area and boost real-estate development along the rail corridors crisscrossing the Lagos region (Estate Intel, 2022). However, in the low-income suburb of Agbado, the lack of local road and bridge improvements limits the full realization of mobility and access to employment promised by the project (Iamgbolahan, 2024).
Media 10.1 Iamgbolahan. (3032, January 21). Contrasting strides of Agbado infrastructure’s: Federal & Lagos vs. neglected roads by Ogun State [Video]. YouTube https://youtu.be/vQTTMsExE5g?si=bvarxRgsjRHyAmKW
On the other side of the Atlantic, in Latin America, Medellin (metro population 4.13 million), Colombia’s second-largest city, has focused on increasing accessibility and mobility for historically underserved communities. This approach has produced an innovative public transport system, including metro, light rail, bus transit, and cable cars. Additionally, the city has invested in infrastructure and services such as social housing, public spaces, libraries, schools, and training opportunities to better meet the needs of low-income residents (Kessler, 2020; urbam_EAFIT, 2019).
Media 10.2 urbam_EAFIT. (2019, November 12). Medellín: dos historias de transformación [Video]. YouTube. https://www.youtube.com/watch?v=CFtLKU9AzZw
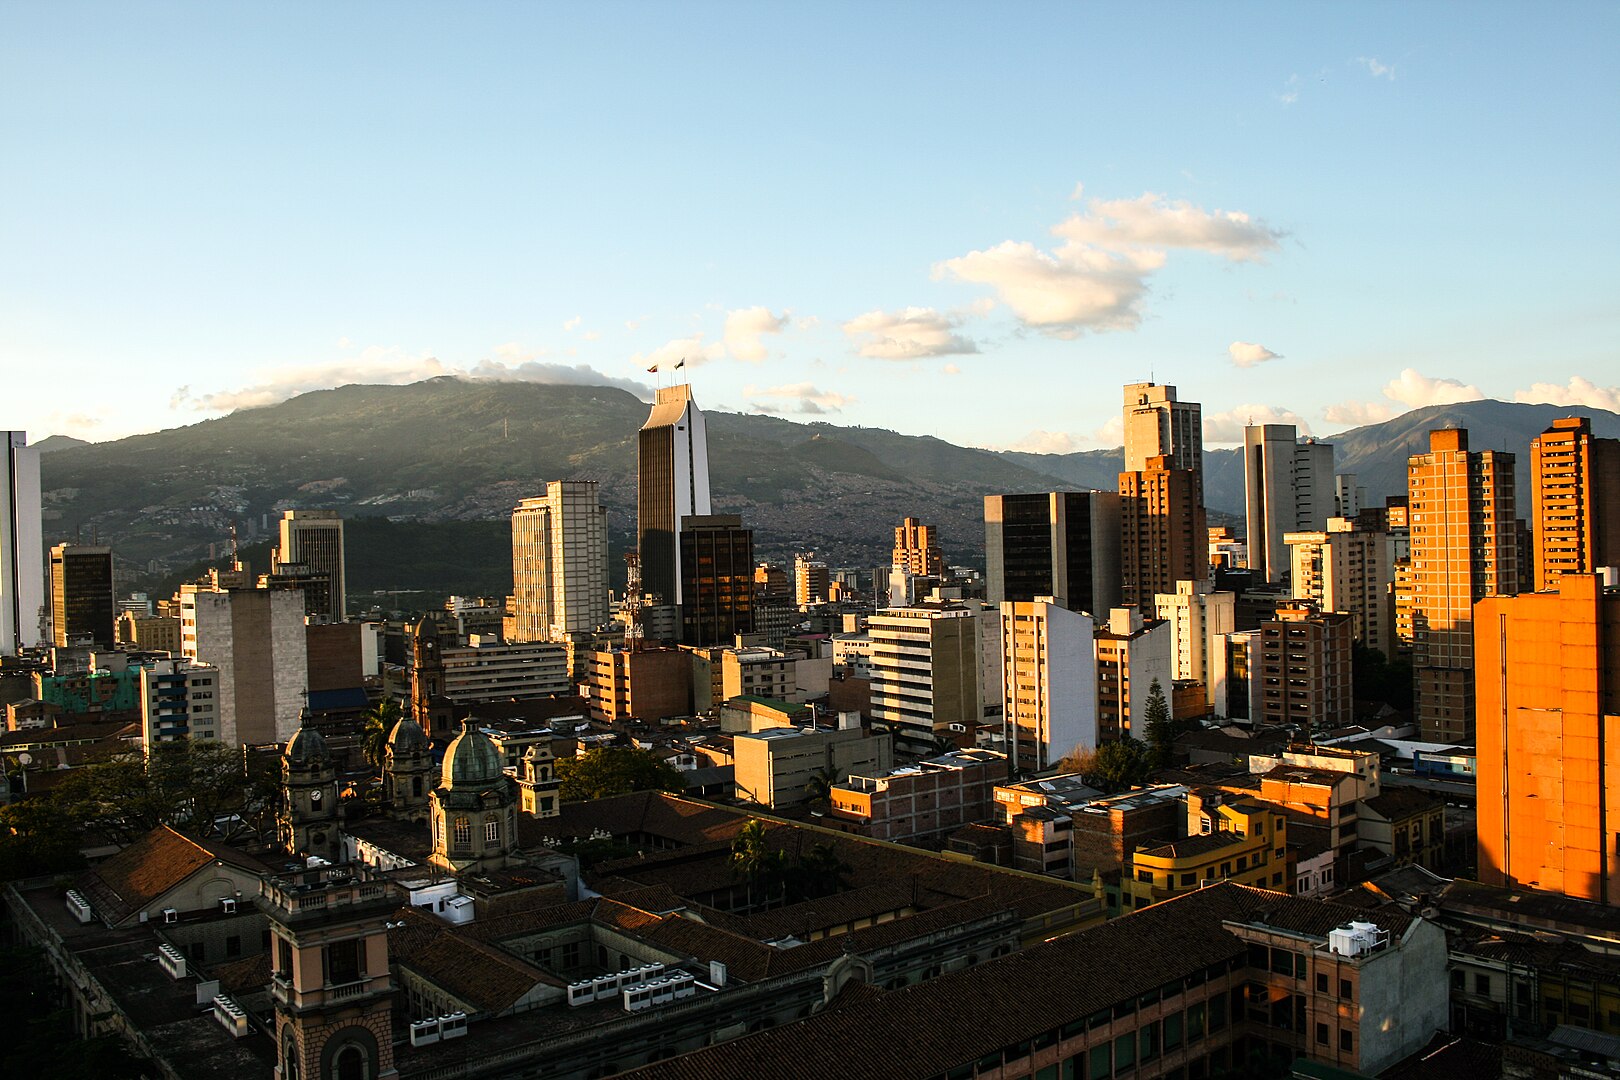
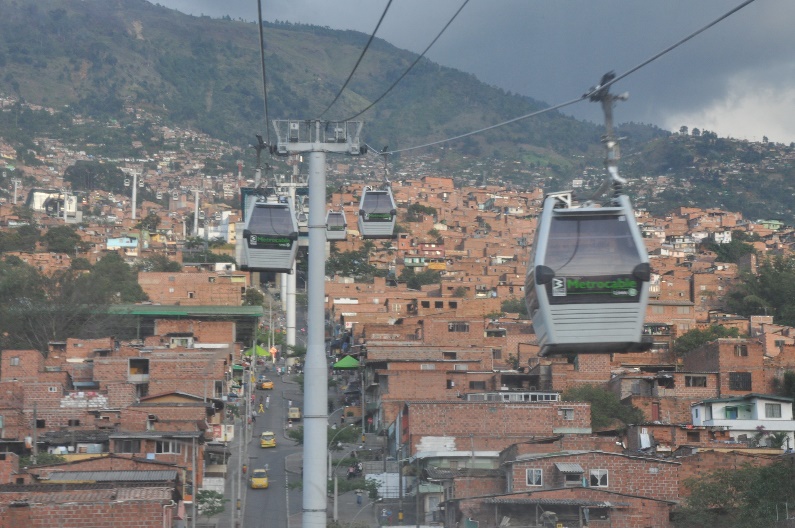
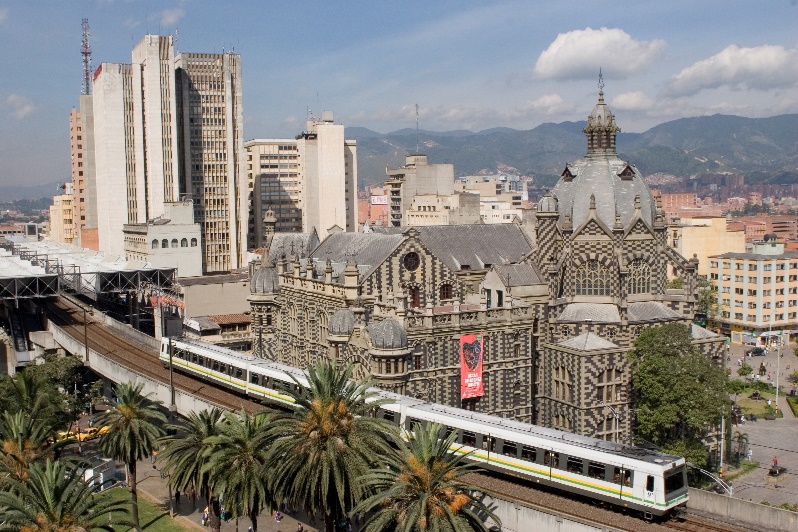
These examples illustrate the critical role that city governance and formal transportation systems and planning play in urban development across the Global South. Medellin’s approach highlights how effective urban management can address inequality and improve living conditions in a city growing at an average annual growth rate of 0.84%. In contrast, Lagos’ Agbado train terminal community reflects the challenges of achieving balanced and inclusive urban development amid rapid urbanization and resource constraints in a megacity growing at 3.7% per year— up to 2,000 people are said to be migrating daily to Lagos from across Nigeria (Akinwotu and Dixon, 2023). These cases also underscore the difficulties formal transportation systems face in reaching poor and low-income settlements on city outskirts, foothills, or flood-prone areas, where extending road infrastructures requires substantial public investment. Informal modes of transportation have historically filled the mobility needs of these underserved communities—a topic in the next section.
NON-MOTORIZED TRANSPORT AND MICROMOBILITY
Walking, cycling, and other human-powered transport are common in many cities of the Global South, especially for short trips and in compact urban areas (Pojani & Stead, 2018). These modes fall under the “micromobility” concept, which also includes two-wheeled motorized vehicles like motorcycles, mopeds, and scooters, extensively used in Asian cities. In the Philippines, these account for 50% of all motorized vehicles, 70% in India, and 97% in Vietnam.
Case Study: Hanoi, Vietnam
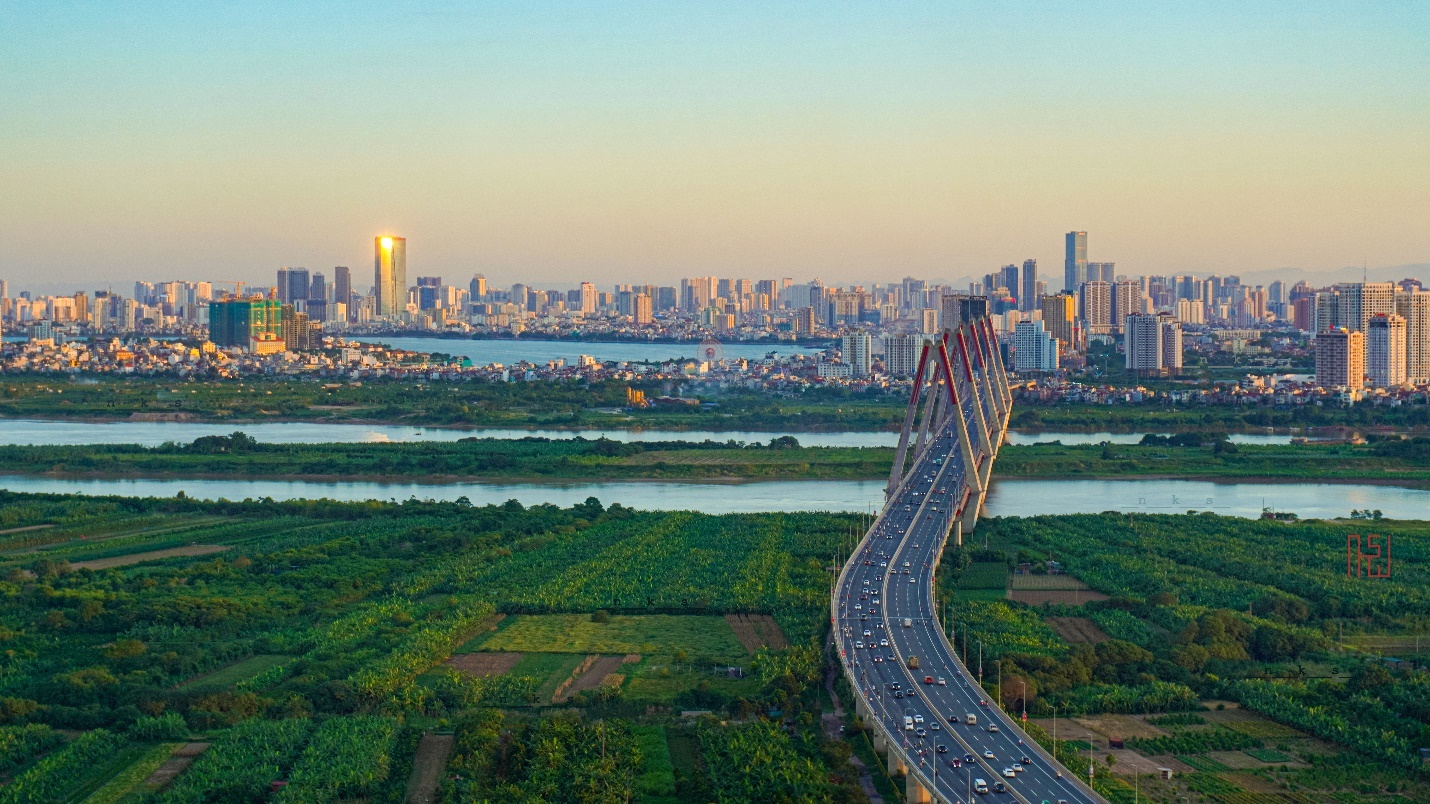
Hanoi, the capital of Vietnam (metro population 5.43 million), has seen rapid urbanization and economic growth, leading to increased motorization and traffic congestion (Ngoc et al., 2022). As can be seen in Figures 10.10 and 10.11, motorcycles dominate the city’s transportation, despite cycling remaining popular (Ngoc et al., 2017). Hanoi’s public transportation system, which includes buses and a limited subway network, struggles to meet the demands of its 5.4 million residents, growing at over 3.5% annually. The limited availability of public transit compared to the city’s population and urban sprawl means many residents rely on motorcycles or bicycles for their flexibility in navigating narrow streets and crowded roads. Additionally, Hanoi has a robust network of bike lanes and rental services, supporting bicycles as a viable transport mode (Clean Air Asia, 2013).
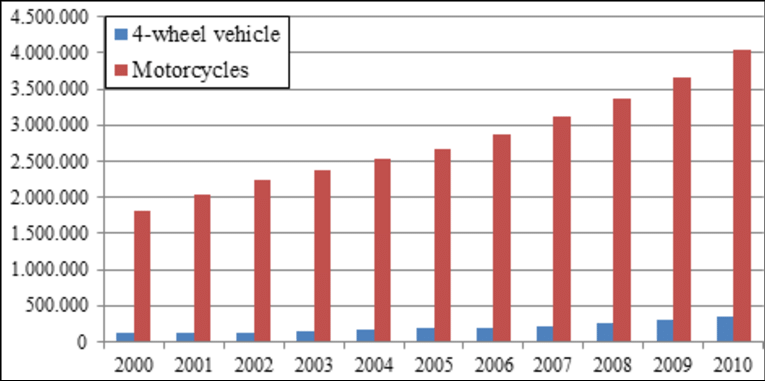
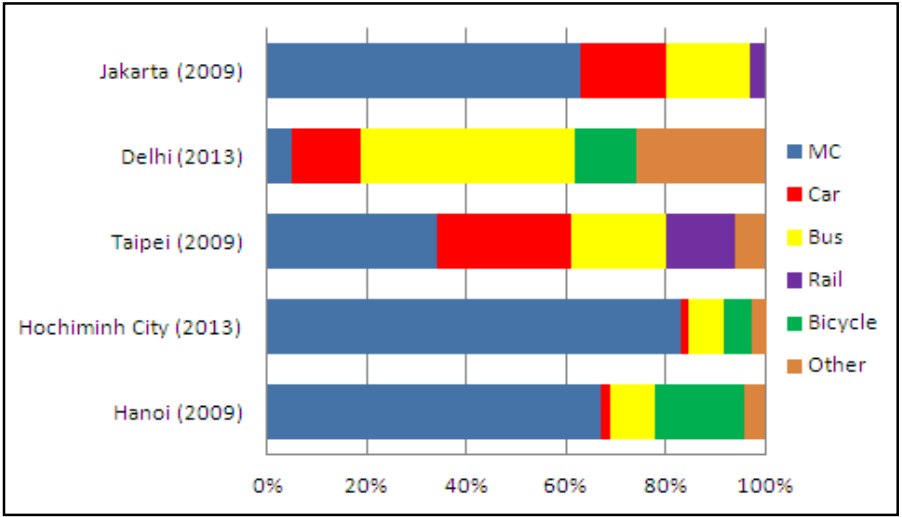
As incomes rise and Hanoi modernizes, there is a noticeable shift towards individual car ownership, driven by aspirations for upward mobility and the perceived status of owning a car (Kieu et al., 2024). This increase in private automobiles exacerbates traffic congestion and air pollution. Hanoi’s streets are often gridlocked during peak hours, leading to long commute times and decreased productivity. Vehicle emissions also worsen air quality, contributing to respiratory illnesses (Guttikunda, 2008). To address these challenges, Hanoi’s government is expanding public transportation infrastructure, promoting cycling and pedestrian-friendly initiatives, and implementing vehicle registration fees and congestion charges to discourage car use (Clean Air Asia, 2013). Figure 10.12 illustrates improvements from the introduction of bus rapid transit (BRT) and the challenges of congested roadways alongside continued motorized micromobility use.
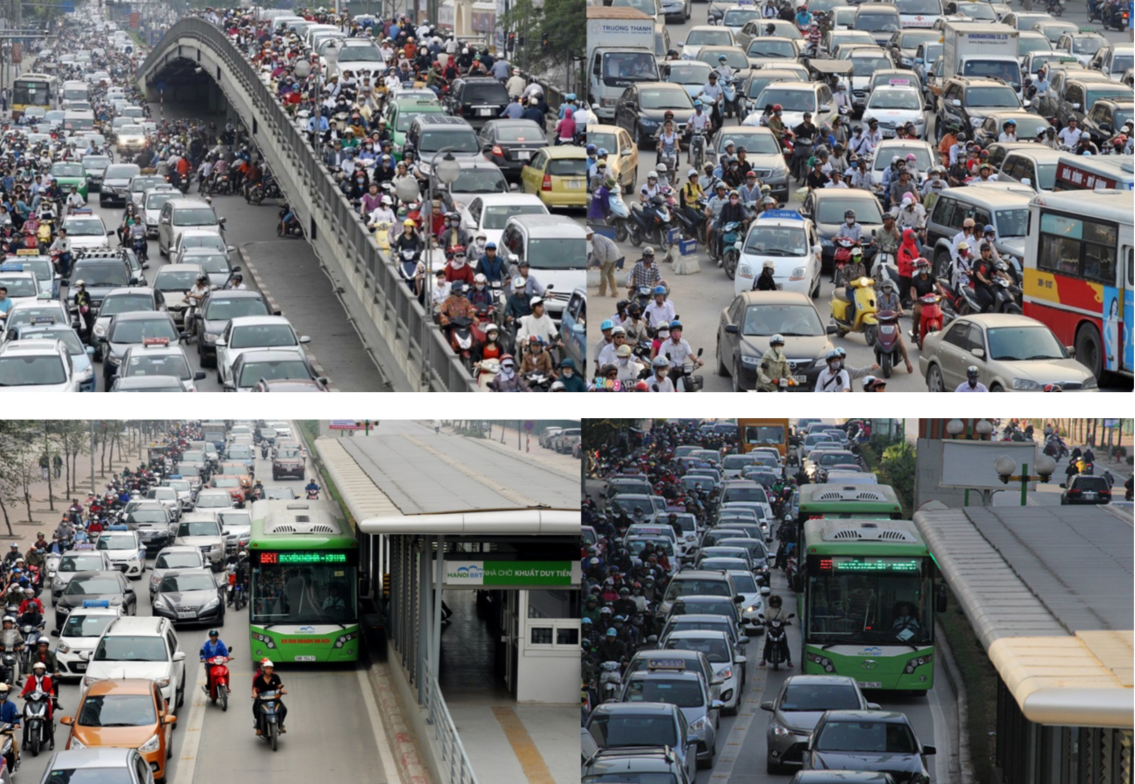
Despite efforts, Hanoi’s earliest Bus Rapid Transit (BRT) system achieved only moderate ridership compared to its target. However, its introduction significantly reduced traffic congestion, injuries, and fatalities, marking a major shift from chaotic motorization to a modern urban transport system with mass public transport as its backbone (World Bank, 2018, p. 16). As shown in Figure 10.13, the BRT offered the greatest time savings for bus riders and cyclists, while motorcyclists and motorcycle-taxi riders experienced increased travel times. This highlights the advantage of two-wheel motorcycle cabs in navigating congested streets and their ability to reach both “mobile underserved” and “stranded underserved” communities. Their popularity as a nimble door-to-door service is likely to outcompete transportation planners’ efforts to remove cars and motorcycles from roads by shifting trips to BRT.
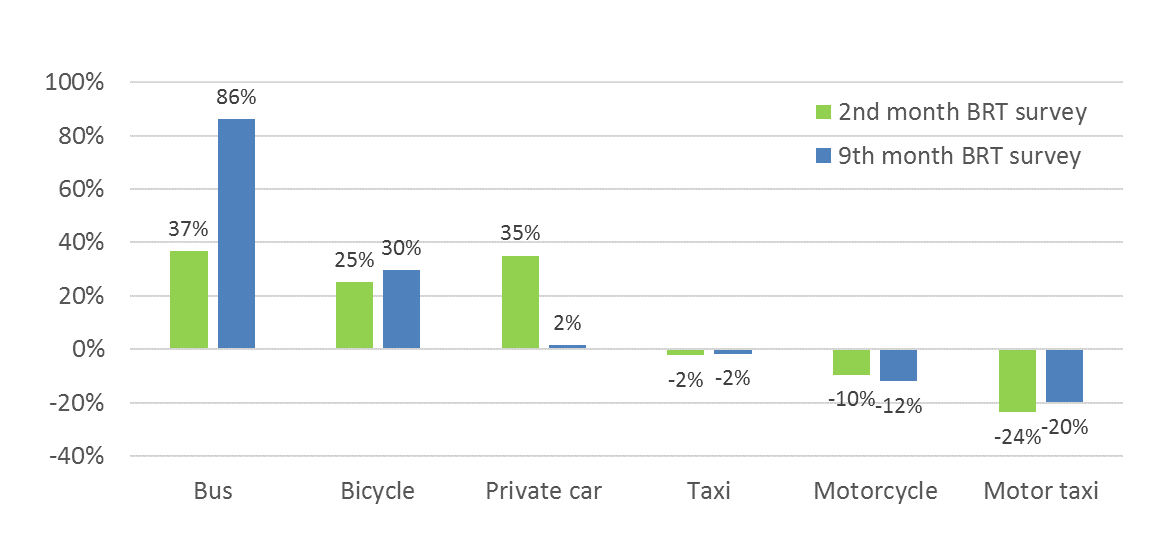
As an “emerging city” in the WRR classification, Hanoi, Vietnam, exemplifies the complexities of achieving environmentally sustainable goals through land use and multimodal transportation planning amid rapid urbanization, societal aspirations for private mobility, and deeply rooted informal mobility systems. Efforts to address environmental and traffic congestion issues by modernizing public transport and promoting micromobility options like cycling offer valuable lessons for other cities in the Global South facing similar challenges of mobility, accessibility, and environmental sustainability.
Case Study: Bogota’s Ciclovia
The Ciclovía in Bogotá, Colombia (population 11,658,000), is a pioneering initiative that transforms the city’s streets into car-free spaces for recreational activities, promoting cycling, walking, and community engagement. This special case of micromobility, which originated in the Global South, is now considered a “best practice” in the Global North (Montero, 2016). Every Sunday and public holiday, over 120 kilometers (nearly 75 miles) of Bogotá’s major roads are closed to motorized vehicles, creating a vast network of interconnected routes known as the Ciclovía, a movement that began nearly fifty years ago (“Ciclovía,” 2024; Welch, 2021).
The Ciclovía serves not only as a recreational event but also as a platform for promoting health, physical activity, and sustainable transportation. As seen in Figure 10.14, it temporarily transforms existing spaces into “open streets” or “pop-up” events, which can sometimes lead to permanent cycling paths (“Ciclovía,” 2024; Welch, 2021). These paths enhance opportunities for daily bicycle commuting and promote health and social integration (Leap, 2010; Welch, 2021). Besides the weekly Ciclovía, Bogotá has implemented permanent cycling infrastructure improvements, such as dedicated bike lanes, bike-sharing programs, bike-repair stations, and bike-friendly amenities, positioning the city as a leading example of sustainable urban transportation globally. This has earned Bogota recognition as a Bicycle Friendly City by European organizations like Copenhagenize (ITDP, 2022; Copenhagenize, 2019).
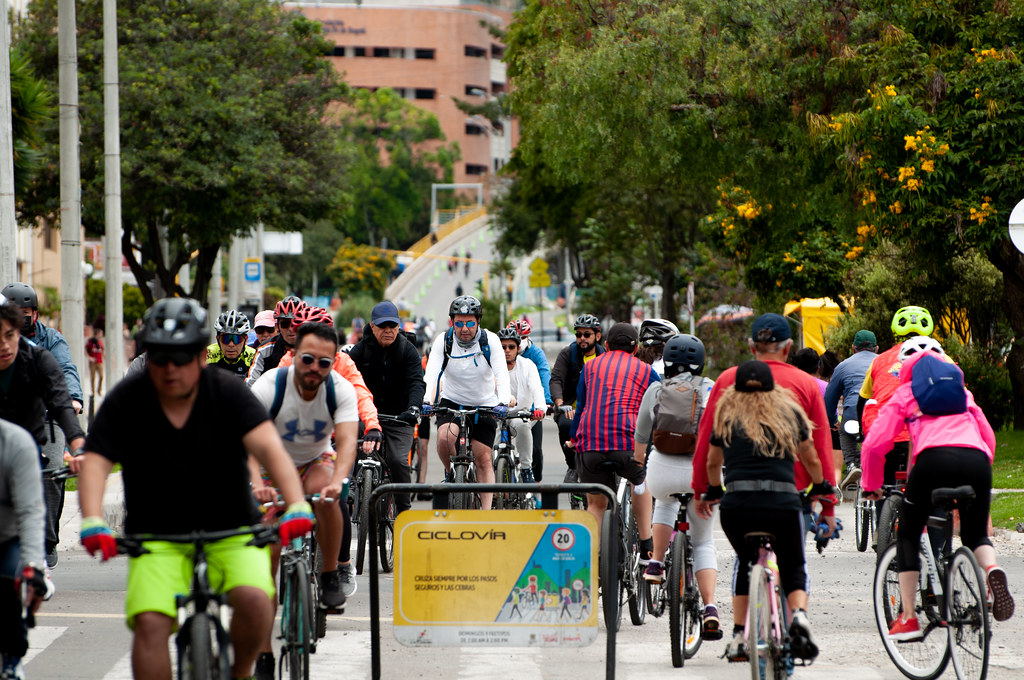
Bogotá’s Ciclovía exemplifies the transformative impact of innovative urban planning and community engagement on sustainable mobility and public health. This initiative not only encourages physical activity and helps reduce car dependency but also serves as a catalyst for permanent cycling infrastructure, such as dedicated bike lanes. By promoting biking as a viable mode of transportation, Ciclovía helps change commuter habits and has inspired similar initiatives in cities of the Global North. As cities worldwide struggle with congestion, pollution, and sedentary lifestyles, Bogotá’s experience offers valuable lessons in fostering inclusive, active transportation solutions that benefit all urban residents as well as visitors, as demonstrated in the video (Media 10.3).
Media 10.3 StreetfilmsVlog. (2008, January 24). Streetfilms-Ciclovia (Bogotá, Colombia) [Video]. YouTube. https://www.youtube.com/watch?v=ELa5CHsUepo
PUBLIC TRANSIT AND BUS RAPID TRANSIT (BRT)
Governments and cities in the Global South have addressed the need for greater accessibility through public transit systems, particularly Bus Rapid Transit (BRT). Previously mentioned in this chapter, BRT is a key transportation initiative in cities of the Global South. These high-capacity buses operate with the frequency and infrastructure comparable to light rail or metro systems, making them a more effective and economical solution for urban mobility (“Bus rapid transit,” 2024).
Though they are less expensive than rail-based infrastructure, these systems represent significant investments for integrating BRT with the subway metro or commuter rail in large metropolitan areas. However, as seen previously in Hanoi and Nairobi, major rail projects and BRT systems often lack the local infrastructure and fare system programming necessary for adequate integration with other mobility modes like bus lines and first-last mile mobility alternatives. As seen in the previous cases, these formal systems (BRT, transit) coexist with informal “popular” transport services, that often compete rather than complement the formal system (Venter et al., 2019).
Case Study: São Paulo’s Metropolitan Transportation System
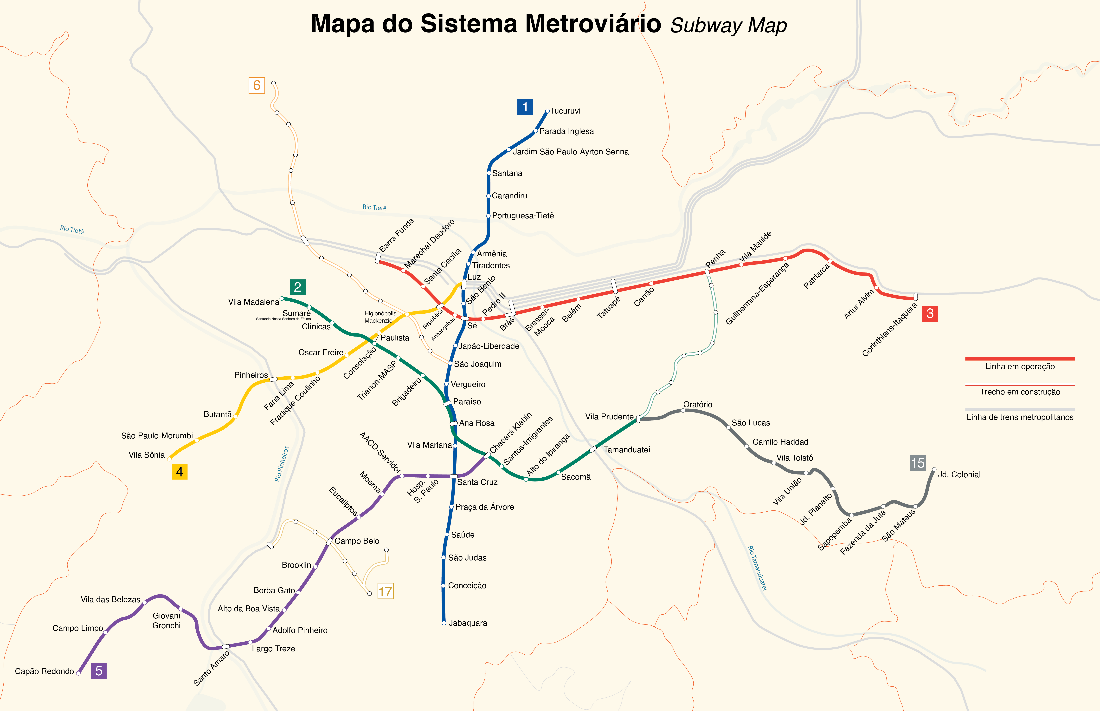
São Paulo, Brazil (population 22.81 million), is one of the largest and most densely populated cities in the world. In 2019, it became the first city in the Americas to surpass New York City’s subway and rail transit ridership (Graham, 2022; MTA, 2020). São Paulo’s 240-mile subway and rail network, the largest in Latin America, has expanded significantly (“São Paulo Metro,” 2024). It is operated by two state-owned companies (São PauloMetro and Companhia Paulista de Trens Metropolitanos) and two by private companies and transports 8.3 million people each day ( Wikipedia 2024). Figure 10.15 shows a system map. The 2014 São Paulo Master Plan (SPMP) has increased density and mixed-use development near rail and BRT stations, enhanced the BRT network, and enforced bus lane restrictions for private automobiles (camera-enforced speed limits and bus-only lanes), contributing to a sizable transit mode share. (Dixon, Bornstein, & Pankratz, 2020; Graham, 2002; The City of São Paulo, 2014).
Despite significant investments and extensive reach, São Paulo’s transit system faces challenges, particularly during peak travel times. Issues such as overcrowding, unreliable service, and inadequate coverage hinder its ability to fully meet the diverse needs of riders (Azevedo, Sampaio, Filho, Moret, & Mrari, 2021). The commuter rail, urban rail transit, and Metro subway system struggle with high demand, leading to overcrowded trains and frequent delays due to aging infrastructure and insufficient maintenance. These challenges particularly affect people with disabilities and the elderly, resulting in long commute times and limited access to essential services (Venter, Mahendra, & Hidalgo, 2019).
Riders on São Paulo’s public transit, including urban rail, buses, and trolleybuses, often face overcrowding, inefficiency, and inadequate infrastructure. The city’s expansive urban landscape exacerbates these issues, as many residents in outlying neighborhoods are poorly served by public transportation (“Sao Paulo,” 2024). To address these challenges, São Paulo’s government has undertaken various projects, such as expanding the subway network, implementing BRT corridors, and investing in integrated fare systems (Buch, 2024). Additionally, São Paulo Metro is currently adding monorail lines (Line 15 Silver, 9 miles, and Line 17 Gold, 4.5 miles) beset by construction delays and accidents, but that when completed, will be the largest and highest capacity elevated monorail system in the Americas and second only to the Chongqing monorail in China (“São Paulo Metro,” 2024).
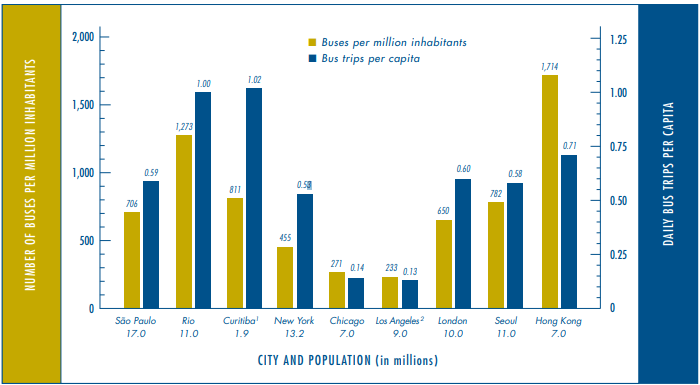
As seen in Figure 10.16, bus usage (daily bus trips per capita) in São Paulo and other Brazilian cities (Rio and Curitiba) exceeds that of many large urban areas in the world, including Seoul and Hong Kong. BRT is frequently utilized due to its capacity, flexibility, and cost-effectiveness compared to other transit modes, with many of the strengths and weaknesses of BRT presented in Table 10.1, São Paulo’s BRT benefits from hundreds of miles of dedicated bus-only lanes, efficient boarding processes, and integrated payment systems, which promote a more seamless and rapid transit experience for passengers (Graham, 2022). In fact, BRT innovations that began in Curitiba, have earned Brazil a worldwide reputation for integrating land use and BRT. Inspired by Curitiba’s success, some American transportation planners have proposed it as a potential TOD model for the US, as described in this video (Media 10.4) from the Federal Transit Agency (FTA).
Media 10.4 usdotfta. (2024, July 23). FTA history part 2 [Video]. YouTube. https://www.youtube.com/watch?v=qFZOMMq5Yss
| Note: From “A worldwide state-of-the-art analysis for bus rapid transit: Looking for the success formula,” by A. Nikitas, & M. Karlsson, 2015, Journal of Public Transportation, 18 (1). (https://doi.org/10.5038/2375-0901.18.1.3). CC BY-NC-ND 4.0 | |||
|
blank cell |
BRT Strengths |
BRT Weaknesses |
|
|---|---|---|---|
|
Economy |
Cost |
Moderate in comparison with rail-based schemes |
More expensive than conventional bus services |
|
Funding |
Moderate difficulties in allocating funds for building a BRT scheme in comparison with rail-based schemes |
Could be still difficult to allocate; may be need for loans, donations, and support from central government |
|
|
Financial Planning |
Good fare policy could allow schemes to be profitable |
Tight, as systems usually do not receive operational subsidies |
|
|
Technology |
ICT |
Improves quality of services provided in terms of customer convenience, speed, reliability, and safety |
Advanced technology could be perceived as expensive addition to costly system |
|
Pre-board Fare Collection |
Disengages ticketing from on-board user experience and provides hypothecation mechanism for system’s long-term viability |
Challenging to achieve in initial phases and in need of very tight supervision thereafter |
|
|
Priority Systems |
Reduce journey times and increase reliability |
Could be viewed especially by car users as a “threat to their rights,” thus reducing public acceptability of BRT |
|
|
Flexibility |
Operational Flexibility |
Can operate everywhere, no need for exclusive use of infrastructure |
Could be viewed as proof that this is not permanent solution but temporary adjustment |
|
Integration Flexibility |
Can co-exist with metro, light rail, and conventional buses |
Can be seen as supplementary service to others and not as a primary transport solution; integration deficiencies with other modes have been reported for existing schemes |
|
|
Implementation |
Rapid Implementation |
No need for long consulting and funding allocation processes associated with rail operations |
Could lead to rushed implementation in which several components could be incomplete at time of commissioning |
|
Straightforward |
Can make this type of system attractive to cities and their political leaders |
Can make BRT look like a project “too easy to deliver” in comparison with rail-based; thus, could be falsely perceived as marginal transport improvement, something that could be viewed as a disadvantage for ambitious politicians |
|
|
Road-User Engagement |
Better-defined network/corridors, branding, and provision of new technology information systems to improve ease of understanding system |
Insufficient user information/education and poor communication during disruptions caused by construction can diminish public trust to BRT |
|
|
Political Leadership |
A strong political champion can be an asset in development and implementation of BRT |
When strong political support is not obvious, BRT planning could be highly problematic |
|
|
Performance |
High Capacity |
Can be “real mass transit” solution |
Very high occupancy standards could downgrade quality of service |
|
High Speed |
Some BRT schemes have comparable standards to metro |
Some schemes only marginally improved conventional bus travel speeds in cities |
|
|
High Reliability |
Big improvement over conventional buses |
Is BRT that much more reliable from conventional buses to invest so many funds? Are time savings really enough? |
|
|
Comfort |
Argued that comfort is comparable to that provided by rail services |
Can be argued that comfort is not up to standards of comparable rail services |
|
|
Impact |
Environment |
Improvement of environmental conditions in terms of air quality, noise reduction, and energy consumption |
Can be argued that metro/light rail are even greener |
|
Traffic Safety |
Reduction in number of traffic accidents |
Still not entirely disengaged by general road traffic; implies that there are still traffic accidents related to its use |
|
|
User Satisfaction |
Majority of BRT users have been fairly satisfied with service |
Car users tend not to see significant BRT-related benefits, while some schemes have been deemed poor by their users |
|
|
Image |
With right patronage and political support, can become iconic for respective cities |
Needs support to be publicly recognized as system much more complete and superior than slightly improved conventional bus service |
|
|
Urban Development |
May have potential to bring broader economic, social, and environmental benefits on urban development |
Can be argued that BRT’s potential for positive societal impacts is not as significant as the potential of fixed rail |
|
|
Land Use |
Can increase land values, rent values, and even promote high-density residential, office, and commercial land use |
Metro and light rail could have an even greater positive land use impact |
|
Case Study: Curitiba, Brazil
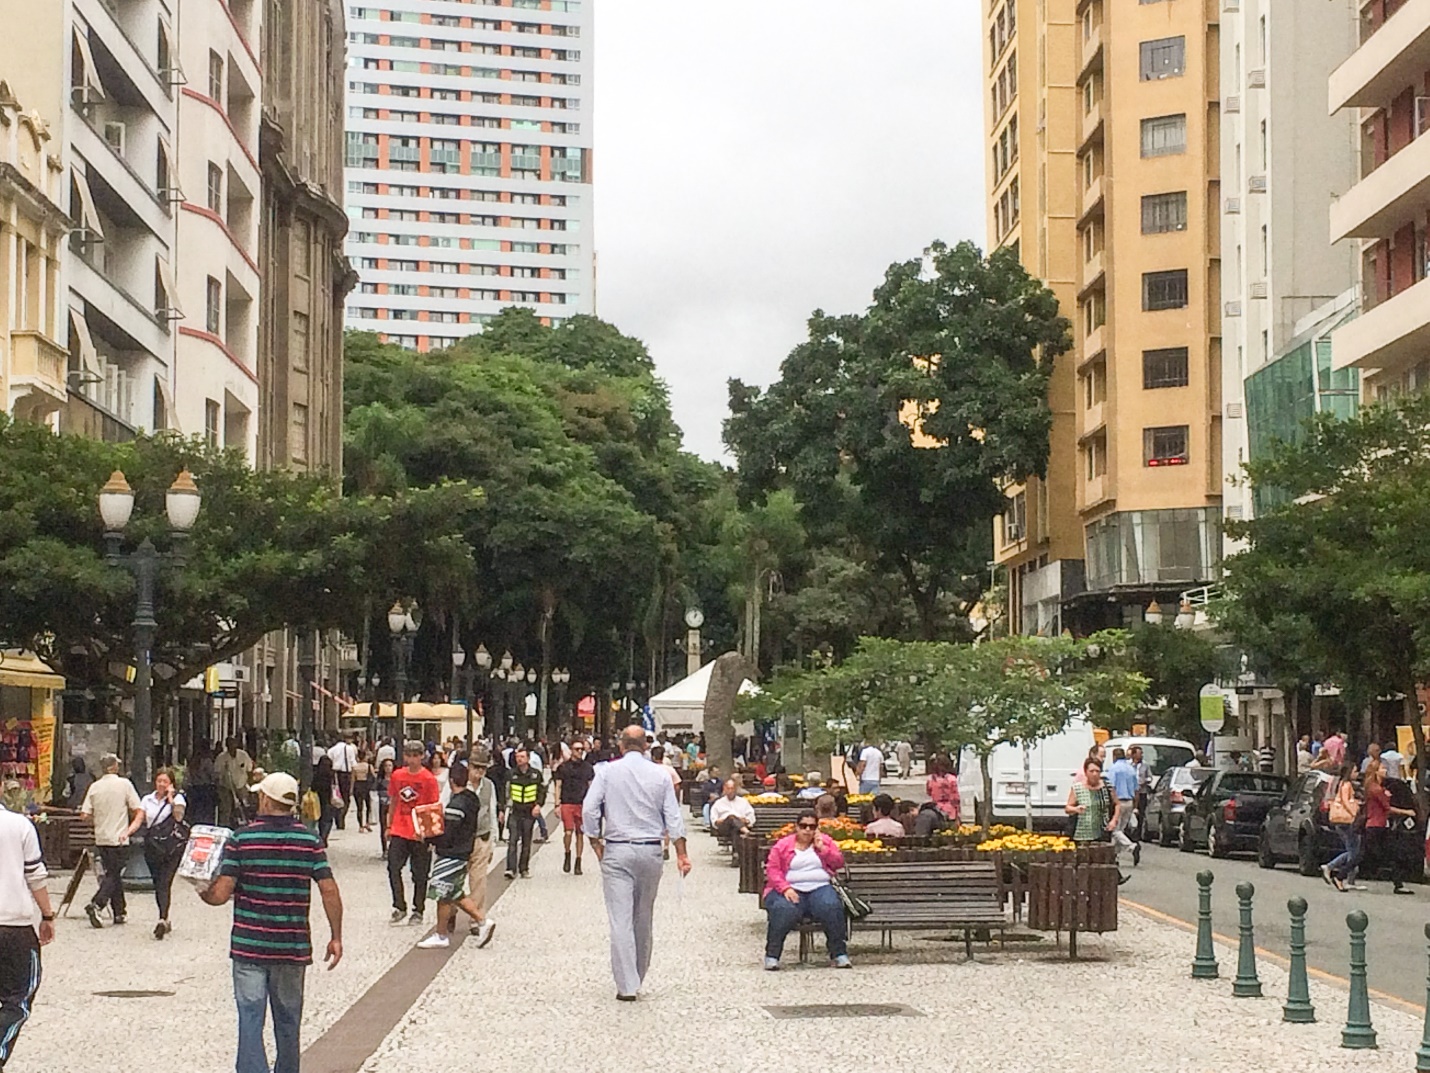
Curitiba, Brazil (metro population 3.56 million), is renowned for its innovative urban planning and transportation system, particularly its Bus Rapid Transit (BRT) system, known as the Rede Integrada de Transporte (Integrated Transportation Network). Pioneered in the 1970s, the BRT is central to Curitiba’s master plan, which shifted emphasis from private mobility to public transit and designated high-density development along transit corridors radiating from the city center. This zoning strategy, whose density tapers off with distance away from the transit corridor, encourages commercial development and generates high levels of transit ridership. The plan also limits vehicular traffic and parking in the city center, prioritizing pedestrian mobility. The BRT-corridor-based linear development pattern distributes commuter traffic along the corridors rather than concentrating it downtown. The downtown is a terminus but not the focal point of city activity and development (Goodman et al., 2006). As can be seen in Figure 10.17 the high-rise corridors follow the BRT, flanking Curitiba’s pedestrianized downtown, rather than most American cities’ downtown central business district (CBT).
As shown earlier in Figure 10.16, comparing Brazilian, American, British, and Asian urban bus systems, Curitiba ranks atop all cities in number of bus trips per capita. Curitiba’s bus service hierarchy starts with minibus circulators that feed passengers from residential neighborhoods to the second tier of conventional inter-district bus lines which connect to the city’s five BRT-backbone radial lines.
Media 10.5 StreetfilmsVlog. (2009, June 4). Curitiba’s BRT: Inspired bus rapid transit around the world [Video]. https://www.youtube.com/watch?v=vJR9uCSyGKM
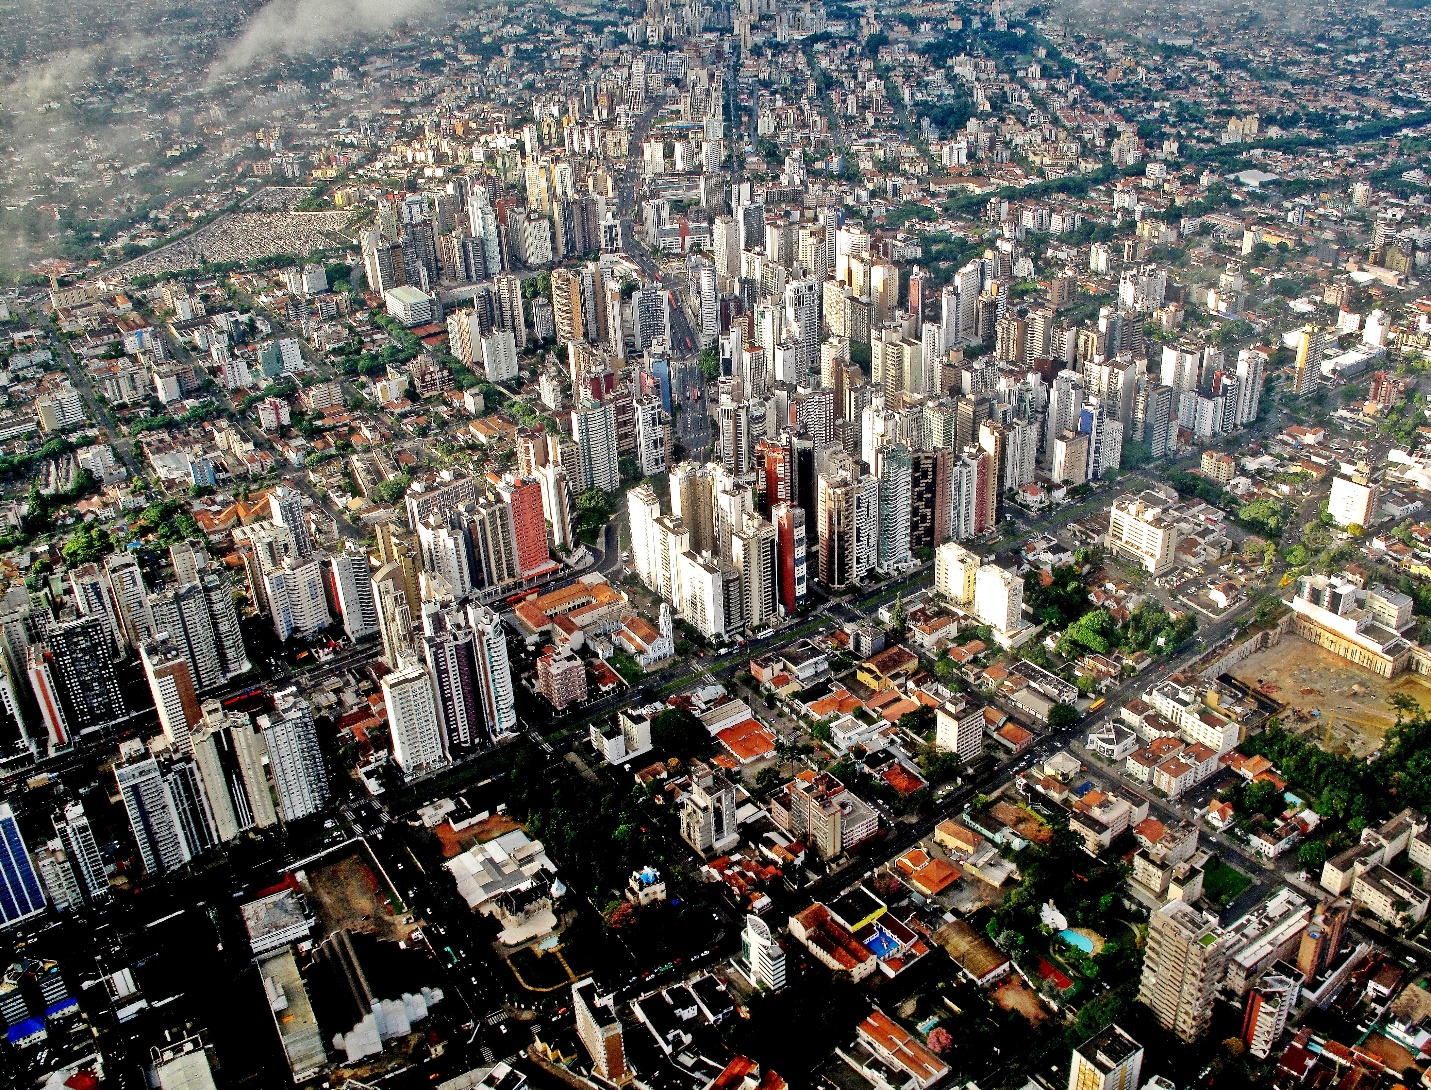
Note: High density, high-rise TRB corridors rise behind Curitiba’s original downtown shown at the bottom of the image.
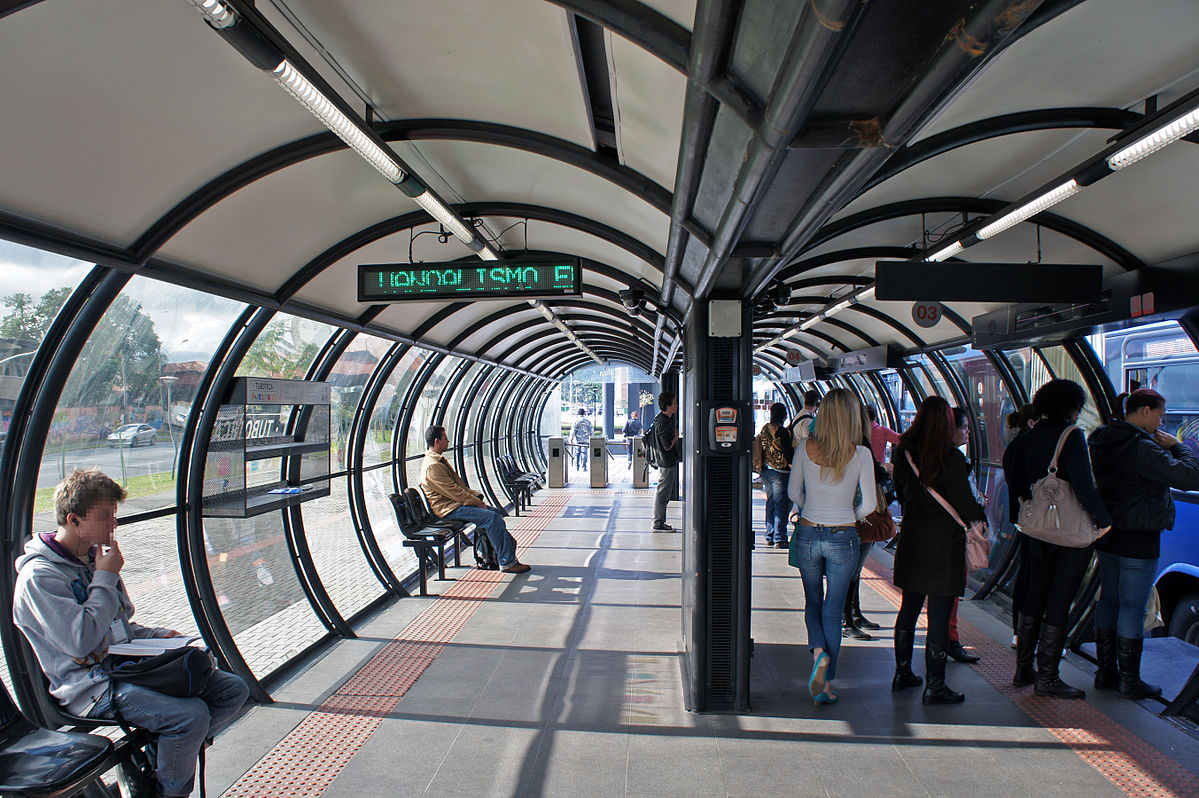
The city has continuously updated its BRT infrastructure and adopted technologies to enhance efficiency, reliability, and passenger experience (Medeiros et al., 2024). Passengers use a prepaid smart card to board buses quickly eliminating the need for cash transactions and reducing boarding times. This technology enables data collection and analysis for optimizing route planning and scheduling or integration with other systems (Medeiros et al., 2024). Curitiba’s BRT stations are also equipped with digital displays of real-time information on bus arrivals, departures, and service updates, which combined with the easy boarding design of the station reduces waiting times at bus stops as seen in figures 10.19 and 10.20.
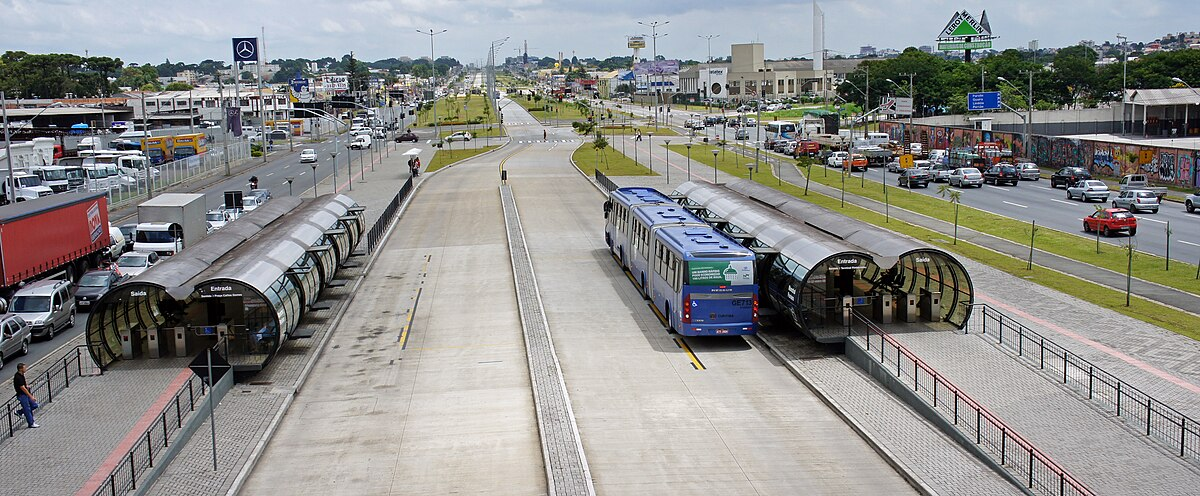
Advancements in traffic management technology have significantly improved Curitiba’s BRT system. Intelligent traffic signal systems, synchronized bus lanes, and bus priority signaling along dedicated corridors enable a smooth and uninterrupted flow of buses, minimizing delays and enhancing service reliability (Nakamura, Makimura, & Toyama, 2016). These innovations have not only boosted the efficiency and reliability of Curitiba’s transportation network but also improved the overall passenger experience as seen in the video (Media 10.6). Curitiba’s land use and BRT innovations have influenced transportation planning globally, extending their impact beyond the Global South.
Media 10.6 NTU Brasil. (2012, December 11). BRT – the future of urban transportation [Video]. YouTube https://www.youtube.com/watch?v=sHeUk4Ns5ss
We’ve mostly talked about the benefits of BRT in the Global South; however, these systems are not a panacea that solves all the transportation issues for a city or region. As we alluded to earlier, maximally effective BRT operations require comprehensive planning that integrates land use with transportation and particularly emphasizes connections and infrastructure for mobile under-served and stranded under-served communities. Furthermore, although lower cost than rail projects, BRT systems still require significant investments as well as ongoing operational expenditures. Additionally, as systems age, they have greater issues in maintenance and operations such that follow-on negative impacts such as reduced reliability, overcrowding, fare evasion become more common. These issues can lead to deterioration of safety and security if not properly addressed with continued management, financial investment, and increasing transport capacity (Hidalgo, et al., 2024). Despite the international recognition of BRT from the Global South and the influence of these systems to spawn copycat and derivative systems throughout the world, including the Global North the utility of these systems seems to have peaked and is perhaps diminishing as new transportation technologies emerge (Hidalgo, et al., 2024). The video (Media 10.7) clarifies these challenges with the transportation situation in Curitiba.
Media 10.7 Comunidade Arquitetura. (2010 December, 5). BRT de Curitiba Video da CNN [Video]. https://www.youtube.com/watch?v=gL_So666mYY
INFORMAL OR “POPULAR” TRANSPORT
As previously mentioned, formal and informal modes of transportation coexist in most cities of the Global South. Compared to formal modes such as buses, metro, and BRT, informal or “popular” modes, including minibuses, shared taxis, and motorcycle, bicycle, and tricycle taxis, are prevalent (UNDP 2024; Al-Hasan et al., 2015; Chalermpong et al., 2023). These informal services are characterized by self-organization and family and community entrepreneurship, enabling profitability without fixed schedules or routes. While they fill gaps in formal networks, their lack of regulation leads to issues such as passenger safety, accessibility for disabled and elderly individuals, female harassment, and traffic congestion (UNDP 2024, Cervero, 2000). During the COVID-19 pandemic, besides their known advantages such as reduced travel time and cost, possibility of door-to-door service, ability to navigate traffic and/or narrow streets, and coverage of first-last mile segments of formal transport, informal modes demonstrated further health benefits over formal systems by reducing exposure risks (International Association of Public Transport, 2021).
Case Study: Dhaka, Bangladesh
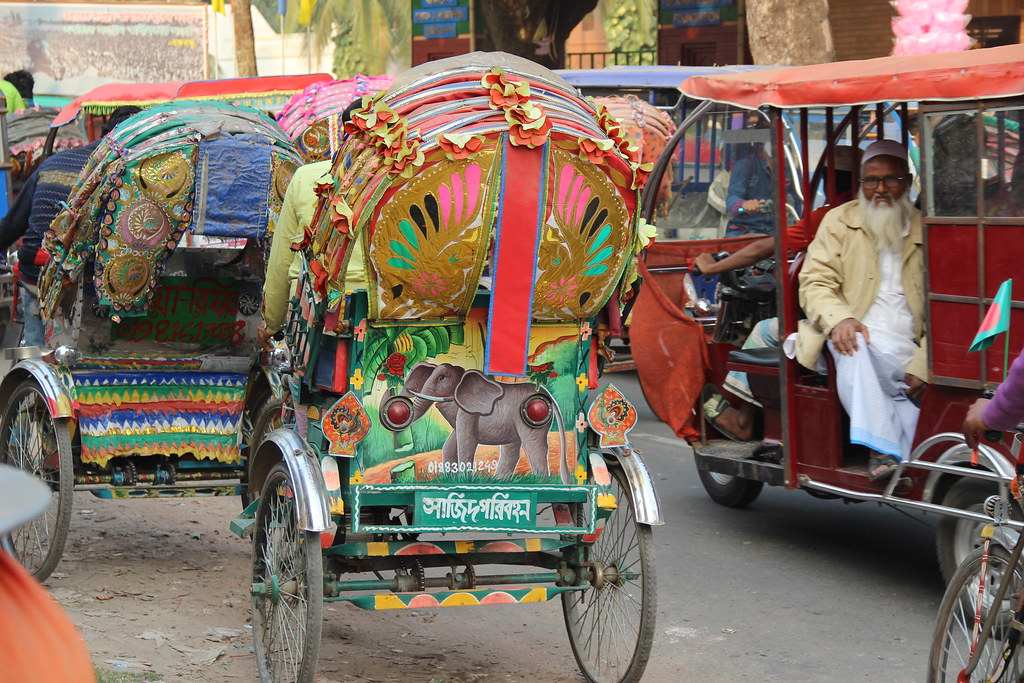
Dhaka, the capital city of Bangladesh (metro population 23.21 million), is notorious for its chaotic and congested streets, where formal public transportation systems struggle to meet the needs of the rapidly growing population. Informal modes of transport have provided essential mobility services to millions of residents since colonial times (Rahman & Assadekjaman, 2013; Ahasan et al., 2023). One iconic example in Dhaka is the “rickshaw,” seen in Figure 10.21. These manually pulled, cycle-driven, or motorized two- or three-wheel vehicles navigate the city’s narrow lanes and congested roads, offering affordable and flexible transportation options (“Rickshaw,” 2024). Rickshaws are particularly popular for short-distance trips, providing a convenient alternative to overcrowded buses or expensive taxis. However, they also contribute to traffic congestion, safety concerns, and face regulatory challenges involving numerous city agencies (Ahasan et al., 2023). Additionally, research highlights the opportunities for self-employment and supplemental income afforded by informal transport, alongside labor challenges of exploitation within this informal economy (Rahman & Assadekjaman, 2013; Al-Hasan et al., 2019). Balancing the benefits and innovative opportunities of informal transport with government initiatives for regulation and formalization remains a significant challenge for urban planners and policymakers in Dhaka and similar cities in the Global South.
Case Study: Nairobi, Kenya
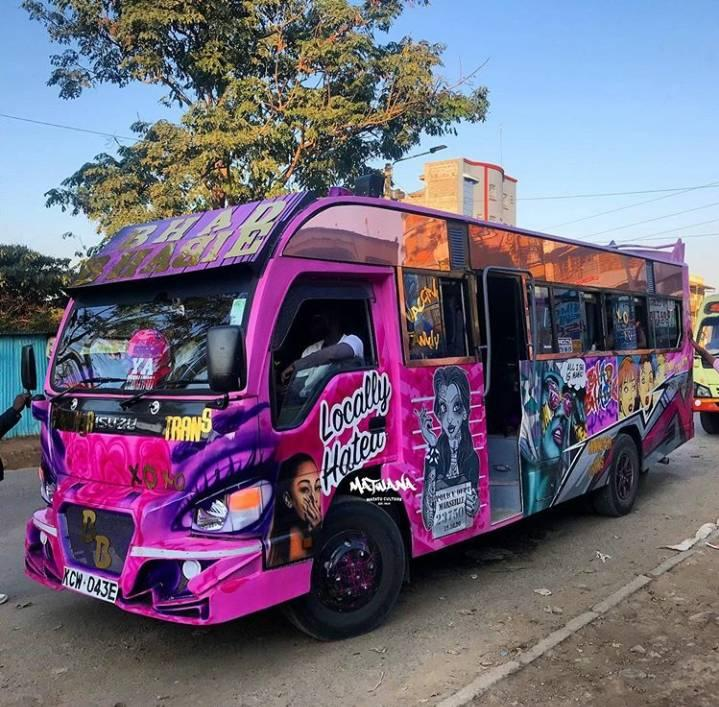
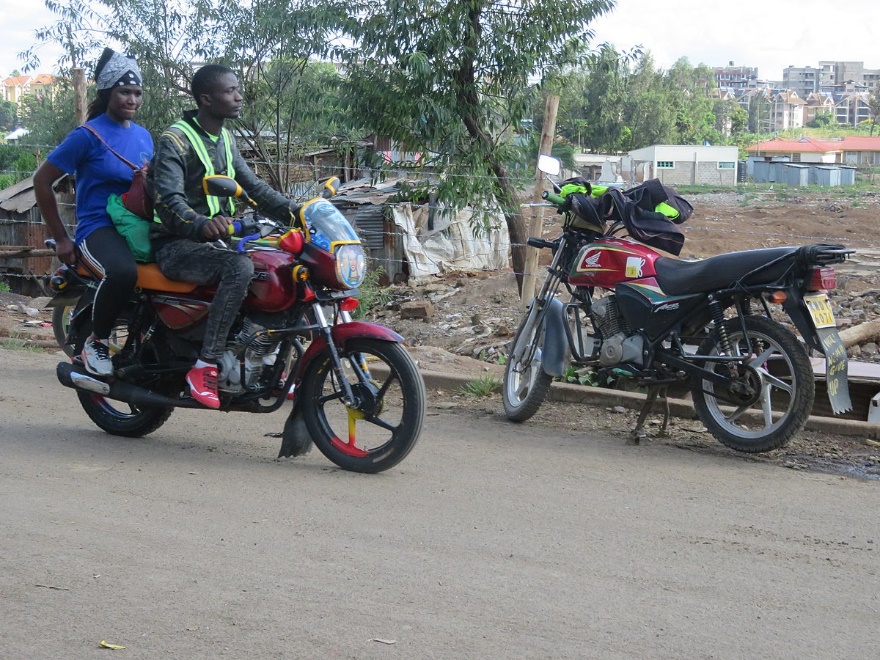
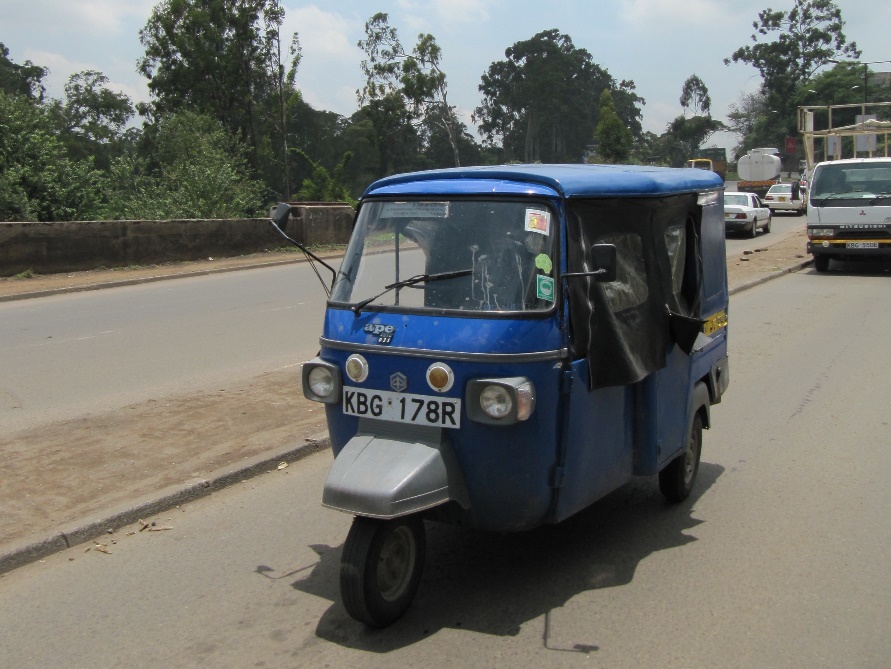
Nairobi, Kenya’s capital and largest city (population 5.54 million), faces infrastructure challenges amid the rapid expansion of informal transportation modes such as matatus (minibuses, Figure 10.22), boda bodas (motorcycle taxis, Figure 10.23), and tuk-tuks (modified three-wheeler Figure 10.24). Although motorcycle taxis can navigate through traffic quickly, they are often more dangerous than other modes (Agyei-Boakye, 2022). As mentioned, informal operators, operating outside formal regulatory frameworks, lead to safety concerns, traffic congestion, and conflicts with formal transport providers, though their services also complement formal bus lines.
As with many other cities in Africa, Asia, and Latin America, despite government formalization initiatives, these informal modes remain well-organized into unions, cooperatives and family businesses. In Kenya, for example, there are 2.5 million active cooperatives throughout the country. Drivers and operators see themselves as entrepreneurs, buying motorbikes and employing drivers as business ventures is common among wealthier drivers. Their strong cooperatives allow them to negotiate with the government and participate in the construction of route stops. (UNDP 2024, p. 20).
In Bolivia, the minibus system known as “ruleteros” operates as family businesses. Typically, the vehicle displays the family name, with the husband driving, the wife recruiting passengers, and the children collecting fares. These businesses are part of powerful associations that can negotiate with the government to resist formalization efforts, such as mandatory registration for legal operation. While municipal governments set fare regulations, they often struggle to enforce them, leaving fare determination to drivers based on competition.
Formalizing popular modes: municipal strategies or digital technology?
Across the Global South, efforts to integrate informal transportation modes into broader urban strategies focus on enhancing safety standards, creating regulatory frameworks to protect passengers and operators, and maintaining the sector’s efficiency, affordability, and flexibility, as highlighted during the COVID-19 pandemic. Municipal governments typically employ various formalization strategies, which the UNDP (2024) categorizes along a continuum from minimal regulation to the complete elimination of informal systems.
These approaches range from top-down government interventions, such as route concessions and priority lanes for informal modes (seen in Alwar, India; Kathmandu, Nepal; and Dakar, Senegal), to bottom-up initiatives led by cooperatives and entrepreneurial operators. An example is Mexico City, where informal operators formed a business to bid for city contracts and purchase buses (UNDP 2024). However, drivers, operators, and passengers often resist formalization due to fears of losing autonomy, facing financial risks, and distrust of government agencies. Passengers also worry about fare increases, longer travel times to transport stops, rigid routes, and reduced access to peripheral neighborhoods with narrow, unpaved streets (UNDP, 2024, p.28).
Digital Technologies and Popular Modes
Despite municipal and government efforts to formalize popular modes, the rise of digital technologies in the Global South has facilitated the emergence of a semi-formal sector in which drivers face relatively low barriers to entry. Mobile apps and tracking platforms like Gojek, Grab, and Ola, as well as ride-hailing companies like Uber and Lyft play a dominant role. These “super apps,” such as Indonesia-based Gojek, have partnered with or created fintechs to offer integrated mobility and digital wallets. By leveraging customer behavior data, they provide a wide range of services from mobility and banking to e-commerce. For instance, the SafeBoda/wallet app describes itself as:
“SAFEBODA is the safest and most affordable way to get around Kampala. With our new app you can get a professional, trained boda boda rider direct to your location at the click of a button. No more walking to the nearest stage or getting on the back of a stranger’s bike.”

Yet SafeBoda faces steep competition from existing or new apps; to remain in business it needs to quickly grow its customer base incentivizing users with reduced cost vis-à-vis other apps.
Digitization of popular modes, according to UNDP Accelerator Labs researchers, may lead to a reverse outcome where digital platforms overtake existing formal transportation modes and seamlessly integrate them with informal ones. “It is possible the formal mode will be folded into the informal system” (UNDP 2024, p. 28). In some cities with strong super app customer bases, this could occur. However, in many areas, a low-tech, cash-based approach using WhatsApp for ride bookings remains common. Drivers often temporarily join digital platforms to estimate the price of rides and to build clientele before leaving them.
Equity Issues
As expected, a digital divide is a direct unequal outcome of the emerging semi-formalization of popular modes in the Global South. Drivers and passengers who cannot afford a smart phone or lack digital literacy are left out. There are also concerns with labor exploitation through the platforms and the loss of drivers’ community ties and the erosion of their associations with the use of platforms.
Lessons from the Global South highlight that while there may be some benefits to drivers and passengers from digitally driven semi-formalization, the change does not address the larger investment needed for in infrastructure construction and maintenance nor the safety and regulatory safeguards that are still needed (Venter et al., 2019; Agyei-Boakye, 2022; ITDP Africa, 2022).
CONCLUSION
Our tour has touched on many of the complex issues surrounding transportation in the cities of the Global South. In addition to underscoring the distinct planning issues and challenges we highlight the innovations and opportunities across a variety of modalities. The usage of both formal and informal transportation systems in the Global South highlights the adaptability and innovation prevalent in these areas. While formal systems often mirror Western standards, they are not always widely accessible or integrated fully into a comprehensive plan, leading to the widespread use of “popular” informal systems, which play a critical role in meeting the mobility needs of the population.
As cities in the Global South continue to urbanize and motorize at unprecedented rates, transportation planning continues to evolve to address the diverse and growing demands for mobility and accessibility. The integration of digital platforms and the emergence of semi-formalized transportation modes offer new avenues for enhancing mobility solutions at a time when the past successful systems may be suffering from a lack of maintenance. The planning practices and transportation systems of the Global South are context-specific; we recognize the limitations of applying Western standards. The most effective transportation modalities and strategies instead foster innovations that respond directly to local needs and conditions.
Ultimately, understanding and addressing the transportation challenges in the Global South requires a nuanced and inclusive approach, one that values the contributions of both formal and informal systems and leverages the unique opportunities inherent in these dynamic urban environments.
QUIZ
Chapter 10 Quiz
GLOSSARY
Bus Rapid Transit (BRT): High-capacity public transportation system utilizing buses, often in dedicated lanes or roadways and with other priority design features and frequent service to improve speed and efficiency (“Bus rapid transit,” 2024).
Boda boda is a type of motorcycle taxi commonly used in East Africa, especially in countries like Kenya and Uganda. These motorcycles are used for transporting passengers and goods over short distances, often navigating through congested urban areas where larger vehicles cannot easily travel. Boda bodas are known for their flexibility, affordability, and ability to reach remote or densely populated areas.
Ciclovia: Spanish term for “cycleway.” A movement of open streets events where bicycles and people use existing streets temporarily closed for automobile traffic. The Ciclovia originated in Bogota, Columbia in 1974 by organizer Jamie Ortiz Marino and others, and has now been adopted around the world (“Ciclovia,” 2024).
Digital Divide: The digital divide is the unequal access to digital technology, including the internet, tablets, laptops, smartphones, and smartphone applications (“Digital divide,” 2024).
Fintech is a company or technology that offers financial services through software and digital platforms. This includes services like online banking, mobile payments, peer-to-peer lending, and investment management. Fintechs aim to automate the delivery and use of financial services.
Informal Transportation: Privately supplied transportation options without fixed route or schedule and often shared, which are often not formally regulated by government agencies (TUMI, 2022).
Microbus: Also called a minibus, minicoach and at least a dozen regional variations including chiva bus in Ecuador, dala dala in Tanzania, dolmuş in Turkey, jeepney in the Philippines, pesero in Mexico City, tap tap in Haiti, weyala in Ethiopia, and matatu in Kenya. These privately-operated passenger buses and vans can transport dozens of passengers and often do not serve a fixed route, but rather operate as an informal shared mobility service (“Microbus,” 2024).
Micromobility: A range of small and lightweight modes of transport, often human-powered, though occasionally electrified which operate at lower speeds (below 25 km/h or 15mph) over relatively short distances (10k or 6 miles) in urban environments (ITDP, 2020).
Motorcycle taxi: Like the microbus, this is another privately-operated informal transportation option that may have many names including cart bike, bike taxi, motodops in Cambodia, maroua in Cameroon, ojek in Indonesia, okada in Nigeria, win motoseai in Thailand, xe ôm in Vietnam and boda boda in Kenya. The motorcycle operator carries one or more passengers as they navigate rapidly through otherwise congested streets in urban regions around the world for a negotiated fare typically less than that of microbuses or automobile taxis (“Boda boda,” 2024; “Motorcycle taxi,” 2024).
Open Streets: Temporary closure of streets to automobiles, open for walking, bicycling and social activities which grew out of the Ciclovia movement. (“Tactical Urbanism,” 2024).
Rickshaw: a two- or three-wheeled cart either pulled by hand, pedaled, or using a small gasoline or electric motor, especially popular throughout Asia (“Rickshaw,” 2024).
Secondary Crashes: crashes that would not have occurred unless an earlier one in close proximity occurred. Possible causes of secondary crashes include rapidly growing queues caused by the first crash and rubbernecking by motorists (FHWA, 2020).
Super app is a mobile application that provides a wide range of services like messaging, social networking, ride-hailing, e-commerce, wallets, food delivery, etc., within a single platform. Examples of super apps include WeChat, Gojek, and Grab.
Tuk Tuk is a small, three-wheeled motorized vehicle used as a taxi. Known for its maneuverability, it is commonly found in Asian cities and other parts of the Global South. It typically seats two to three passengers and is popular for short-distance travel.
REFERENCES
Agbiboa, D. E. (2020). How informal transport systems drive African cities. Current History, 119(817). 175-181. https://www.jstor.org/stable/10.2307/48614537
Agyei-Boakye, O. P. (2022 February 1). Public Transportation in Africa: Informal transport or paratransit. Transport Africa. https://www.transportafrica.org/public-transportation-in-africa-informal-transport-or-paratransit/ – comment-811
Agyei-Boakye, O. P. (2022 May 1). Are BRTs the solution to Africa’s transport woes? Transport Africa. https://www.transportafrica.org/are-brts-the-solution-to-africas-transport-woes/
Ahasan R., Hoda M. N., Alam M. S. , Nirzhar Y. R., and Kabir, A. (2023). Changing institutional landscape and transportation development in Dhaka, Bangladesh. Heliyon, 9(7). e17887. https://doi.org/10.1016%2Fj.heliyon.2023.e17887
Akinwotu, E. and Dixon, G. (2023). Lagos, Nigeria’s coastal megacity is experiencing a population boom. NPR, Morning Edition, April 5, 2023. https://www.npr.org/2023/04/05/1168116175/lagos-the-biggest-city-in-nigeria-is-experiencing-a-population-boom
Al-Hasan, A. Z., Momoh, S., & Eboreime, L. (2015). Urban poverty and informal motorcycle transport services in a Nigerian intermediate settlement: A synthesis of operative motives and satisfaction. Urban, Planning and Transport Research, 3(1). https://doi.org/10.1080/21650020.2014.978950
Asha, A. Z., Sultana, S., He, H. A., & Sharlin, E. (2024). “Shotitow First!”: Unraveling Global South women’s challenges in public transport to inform autonomous vehicle design. Designing Interactive Systems Conference (DIS ’24) IT University of Copenhagen, Denmark. https://doi.org/10.1145/3643834.3661553
Azevedo, G. A., Sampaio, R. R., Filho, A. S. N., Moret, M. A., & Murari, T. B. (2021). Sustainable urban mobility analysis for elderly and disabled people in Sao Paulo. Scientific Reports, 11, 791. https://www.nature.com/articles/s41598-020-80906-w
Bell, D. D., & Kuranami, C. (1994). Nonmotorized vehicles in Hanoi and Phnom Penh: Existing situation and options for improvement. Transportation Research Record, 1441.https://onlinepubs.trb.org/Onlinepubs/trr/1994/1441/1441-011.pdf
Beyer, S. (2023, May 3). Road-sharing lessons from faraway places. Governing. https://www.governing.com/community/road-sharing-lessons-from-faraway-places
Boda boda. (2024, June 25). In Wikipedia. https://en.wikipedia.org/wiki/Boda_boda
Buch, E. (2024, April 16). São Paulo: Expansion of the metro and commuter rail network. Urban Transport Magazine. https://www.urban-transport-magazine.com/en/sao-paulo-expansion-of-the-metro-and-commuter-rail-network/
Bus rapid transit. (2024, June 3). In Wikipedia. https://en.wikipedia.org/wiki/Bus_rapid_transit
Cairo Transport Authority (2010, December 24). In Wikimedia.https://commons.wikimedia.org/wiki/File:Cairo_Transport_Authority.JPG
De Carvalho, F. S., de Franca Bail, R., Pagani, R. N., Pilatti, L. A., Kovaleski, J. L., & de Genaro Chiroli, D. M. (2021). Urban mobility in smart cities: A case study in the city of Curitiba. International Journal of Development Research, 11(6). 48151-48151. https://doi.org/10.37118/ijdr.22310.06.2021
Cervero, R. (2014). Transport Infrastructure and the environment in the Global South: Sustainable mobility and urbanism. Journal Perencanaan Wilayah dan Kota (Journal of Regional and City Planning Institut Teknologi Bandung), 25(3). https://doi.org/10.5614/jpwk.2015.25.3.1
Cervero, R. (2000). Informal transport in the developing world. United Nations Centre for Human Settlements (Habitat). https://unhabitat.org/sites/default/files/download-manager-files/Informal%20Transport%20in%20the%20Developing%20World.pdf
Chalermpong, S., Ratanawaraha, A., & Anuchitchanchai, O. (2023). Motorcycle taxis’ varying degrees of complementarity and substitution with public transit in Bangkok. Journal of Transport Geography, 108, 103557. https://doi.org/10.1016/j.jtrangeo.2023.103557
Ciclovia. (2024, April 27). In Wikipedia. https://en.wikipedia.org/wiki/Ciclov%C3%ADa
The City of São Paulo. (2014, September). City of São Paulo Strategic Master Plan. [Law 16.050]. https://gestaourbana.prefeitura.sp.gov.br/wp-content/uploads/2015/02/Master_plan_english_version.pdf
Clean Air Asia (2013). Promoting non-motorized transport in Asian cities: Policymakers’ toolbox. HS/020/14E United Nations Human Settlements Programme. https://unhabitat.org/sites/default/files/download-manager-files/Promoting NMT in Asian CitiesS.pdf
Collord, M., Goodfellow, T., & Asante, L. A. (2021). Uneven development, politics and governance in urban Africa: An analytical literature review. ACRC Working Paper 2021-02. www.african-cities.org
Copenhagendize. (2019) Copenhagendize Index: Bogota. https://copenhagenizeindex.eu/cities/bogota
Curitiba Centro (2010, March 2). In Wikimedia.https://upload.wikimedia.org/wikipedia/commons/e/e7/Curitiba_Centro.jpg
Día soleado en Medellin. (2011, November 1). In Wikimedia. https://commons.wikimedia.org/w/index.php?curid=128128806
Digital divide. (2024, August 5). In Wikipedia. https://en.wikipedia.org/wiki/Digital_divide
Dixon, S., Bornstein, J., & Pankratz, D. M. (2020). The 2020 Deloitte city mobility index: Gauging global readiness for the future of mobility. Deloitte. https://www2.deloitte.com/xe/en/insights/focus/future-of-mobility/deloitte-urban-mobility-index-for-cities.html
Downtown Curitiba. (2015, March 19). In Flickr. https://www.flickr.com/photos/marc_buehler/16659092537
ElDessouki, W. M. (2022) Development of a neighborhood mobility index for assessing mobility disparities in developing countries with application to the Greater Cairo Area, Egypt. Sustainability, 14(23), 15846. https://doi.org/10.3390/su142315846
El-Kadi, A. W. (2013). Suggested solutions for traffic congestion in Greater Cairo. Journal of Sustainable Development, 6(11). http://dx.doi.org/10.5539/jsd.v6n11p105
Estate Intel (2022). Why real estate investors should pay attention to Lagos Red line and blue line railway completion. Nairometrics, September 16, 2022. https://nairametrics.com/2022/09/16/why-real-estate-investors-should-pay-attention-to-lagos-red-line-and-blue-line-railway-completion/
Federal Highway Administration (FHWA). (2020, March 23). Traffic congestion and reliability: Trends and advanced strategies for congestion mitigation. https://ops.fhwa.dot.gov/congestion_report/executive_summary.htm
Gandy, M. (2006). Planning, anti-planning and the infrastructure crisis facing metropolitan lagos. Urban Studies, 43(2), 371-396. https://doi.org/10.1080=00420980500406751
Goodman, J. Laube, M. and Schwenk, J. (2006). Curitiba’s bus system is model for rapid transit.Race, poverty and the environment, Winter 2005/2006. https://www.reimaginerpe.org/files/25.Curitiba.pdf
Graglia, A. D. (2016). Finding mobility: Women negotiating fear and violence in Mexico City’s public transit system. Gender, Place & Culture: A Journal of Feminist Geography, 23(5). https://doi.org/10.1080/0966369X.2015.1034240
Graham, S. H. (2022, December 2). Can mass-transit expansion by itself solve traffic congestion? The São Paulo case suggests not. NYU Wagner Review. https://www.thewagnerreview.org/2022/12/can-mass-transit-expansion-by-itself-solve-traffic-congestion-the-sao-paulo-case-suggests-not/
Guttikunda, S. (2008). An air quality management action plan for Hanoi Vietnam. Urban emissions info working paper #14-2008. https://urbanemissions.info/wp-content/uploads/docs/SIM-14-2008.pdf
Hanoi Skyline – NKS. (2022, April 20). In Wikimedia. https://commons.wikimedia.org/w/index.php?curid=117043700
Hidalgo, D., Giesen, R., Muñoz, J. C. (2024). Bus rapid transit: End of trend in Latin America? Data & Policy, 6(2). https://doi.org/10.1017/dap.2023.44
Iamgbolahan. (2024, January 21). Contrasting strides of Agbado infrastructure: Federal & Lagos vs. neglected roads by Ogun State [Video]. YouTube. https://www.youtube.com/watch?v=vQTTMsExE5g
Ikoyi Lagos, Nigeria. (2019, June 5). In Wikimedia. https://commons.wikimedia.org/w/index.php?curid=79988917
Institute for Transportation and Development Policy (ITDP). (2020, March 24). As the impacts of Coronavirus grow, micromobility fills in the gaps. Transport Matters. https://itdp.org/2020/03/24/as-the-impacts-of-coronavirus-grow-micromobility-fills-in-the-gaps/
ITDP Africa. (2022, August 8). Kenya’s next government ought to prioritize sustainable transport. Transport Journal. https://africa.itdp.org/kenyas-next-government-ought-to-prioritise-sustainable-transport/
International Association of Public Transport (2001). Key insights into transforming the informal transport sector. Informal Transport Working Group Knowledge Brief. https://cms.uitp.org/wp/wp-content/uploads/2021/02/Knowledge-Brief-Informal-transport.pdf
International Association of Public Transport (2022). From Transmilenio to cycle-networks: Lessons learned from Bogota’s comprehensive urban mobility planning. Mobilize IAPT. https://itdp.org/wp-content/uploads/2023/05/From-Transmilenio-to-Cycle-Networks-Lessons-Learned-from-Bogotas-Comprehensive-Urban-Mobility-Planning-MAY4.pdf
International Transport Forum (2017). Chapter 2: Transport demand and CO2 emissions to 2050. ITF Transport Outlook. https://doi.org/10.1787/9789282108000-en
Jahangir, S., Bailey, A., Hasan, M. U., Hossain, S., Helbich, M., & Hyde, M. (2022). “When I need to travel, I feel feverish”: Everyday experiences of transport inequalities among older adults in Dhaka, Bangladesh. The Gerontologist, 62(4), 493-503. https://doi.org/10.1093/geront/gnab103
Kahachi, H. A. H. (2019). Analyzing public transportation plans to addressing traffic congestions in developing countries: The case study of the Greater Cairo Region. Iraqi Journal of Architecture and Planning, 15(1). https://www.iasj.net/iasj/download/2ccb818d662b54ad
Karim, R., & Salam, K. A. (2019). Organising the informal economy workers: A BILS study of rickshaw pullers in Dhaka City. Labour, 22(2). https://bilsbd.org/wp-content/uploads/2020/08/Labour-A-BILS-Journal-July-December-2019.pdf
Kessler, F. W. (2020). Assessment of mass transit in Medellin Colombia: A case study. [Doctoral Dissertation, University of Texas at Arlington]. http://hdl.handle.net/10106/29396
Kieu, M., Comber, A., Thuy, H. N. T., Quang. T. B., Huu, P. H. & Malleson, N. (2024). An open dataset on individual perceptions of transport policies. Scientific Data, 11(104). https://www.nature.com/articles/s41597-024-02950-9
Klopp, J. M. (2012). Towards a political economy of transportation policy and practice in Nairobi. Urban Forum 23, 1-21. https://doi.org/10.1007/s12132-011-9116-y
Lagos. (2024, June 18). In Wikipedia. https://en.wikipedia.org/wiki/Lagos
Leap, M. (2020). A literature review of current events and trends in Ciclovia programs across America. Tools of the Trade: 12th National Conference on Transportation Planning for Small and Medium-Sized Communities.https://trid.trb.org/view/1253571
Lwanga, A., Mwanga, H. H., & Mrema, E. J. (2022). Prevalence and risk factors for non-collision injuries among bus commuters in Dar es Salaam, Tanzania. BMC Public Health, 22, 963. https://doi.org/10.1186%2Fs12889-022-13284-9
Mapa do Metrô de São Paulo. (2022, July 13). In Wikipedia.https://en.wikipedia.org/wiki/S%C3%A3o_Paulo_Metro#/media/File:Mapa_do_Metr%C3%B4_de_S%C3%A3o_Paulo_em_escala.png
Marina Station Lagos. (2023, July 27). In Wikimedia. https://commons.wikimedia.org/wiki/File:Marina-station-lagos.jpg
Medeiros, R. M., Duarte, F., Bojic, I., Xu Y., Santi, P., & Rati, C. (2024). Merging transport network companies and taxis in Curitiba’s BRT system. Case Study and Application, 16, 269-293. https://doi.org/10.1007/s12469-023-00342-7
Metro de Medellín, Colombia. (2013, July 26). https://commons.wikimedia.org/wiki/File:Metro_de_Medell%C3%ADn,_Colombia.jpg
Metropolitan Transit Authority (MTA). (2020). 2020 Annual Report to the Governor.https://new.mta.info/document/78921
Minibus. (2024, July 1). In Wikipedia. https://en.wikipedia.org/wiki/Minibus
Mittal, K. M., Timme, M. & Schroder, M. (2024). Efficient self-organization of informal public transport networks. Nature Communications, 15 4910. https://doi.org/10.1038/s41467-024-49193-1
Montero, S. (2016). Worlding Bogota’s Ciclovia: From urban experiment to international “best practice.” Latin American Perspectives, 44(2). https://doi.org/10.1177/0094582X16668310
Motorcycle taxi. (2024 May 1). In Wikipedia. https://en.wikipedia.org/wiki/Motorcycle_taxi
Nair, P. & Kumar, D. (2005). Mumbai urban transport project: Development and challenges, The Institute of Chartered Financial Analyst of India Journal of Infrastructure, 34-42.
Nakamura, F., Makimura, K, & Toyama, Y. (2016). Perspectives on an urban transportation strategy with BRT for developing cities. Engineering and Applied Science Research, 44(3), 196-201. https://www.tci-thaijo.org/index.php/easr/index
Ngoc, A. M, Hung, K. V., and Tuan, V. A. (2017). Towards the development of quality standards for public transport service in developing countries: Analysis of public transport users’ behavior,”, Transportation Research Procedia, 25, 4560-4579. https://doi.org/10.1016/j.trpro.2017.05.354.
Ngoc, A. M., Nishiuchi, H., Trong, N. V., and Huyen, L. T. (2022). A comparative study on travel mode share, emission, and safety in five Vietnamese cities. Journal of ITS Research, 20(1). 157-169. https://doi.org/10.1007%2Fs13177-021-00283-0
Nikitas, A. & Karlsson, M. (2015). A worldwide state-of-the-art analysis for bus rapid transit: Looking for the success formula. Journal of Public Transportation, 18(1). https://doi.org/10.5038/2375-0901.18.1.3
Pojani, D., and Stead, D. (2018). Policy design for sustainable urban transport in the global south. Policy Design and Practice, 1. https://doi.org/10.1080/25741292.2018.1454291
Rickshaw. (2024 June 12). In Wikipedia. https://en.wikipedia.org/wiki/Rickshaw
SafeBoda (2024, August 6). Key details of SafeBoda. https://download.cnet.com/safeboda/3000-20426_4-77540335.html
Salau, T. (2015). Public transportation in metropolitan Lagos, Nigeria: analysis of public transport users’ socioeconomic characteristics. Urban Planning and Transport Research, 3(1) 132-139. http://dx.doi.org/10.1080/21650020.2015.1124247
São Paulo Metro. (2024, June 30). In Wikipedia. https://en.wikipedia.org/wiki/S%C3%A3o_Paulo_Metro
Shah, S. (2018). Women-only transport: a “solution” to what end? Sustainable Transport Institute for Transportation and Development Policy. https://itdp.org/wp-content/uploads/2019/01/Women-only-Transport.pdf
Sil, A., Chowdhury, S., & Thoreau, R. (2023). Moving towards an inclusive public transport system for women in the South and Southeast Asia region. Transport Reviews, 43(6), 1144-1164. https://doi.org/10.1080/01441647.2023.2200983
Tactical urbanism. (2024, June 4). In Wikipedia. https://en.wikipedia.org/wiki/Tactical_urbanism#Open_Streets
TUMI. (2022, December 6). Improving informal transport services through the use of data and digitalization. https://transformative-mobility.org/improving-informal-transport-services-through-the-use-of-data-and-digitalisation/
The World Bank (2018). Implementation completion and results report IDA-43470 / TF-58293 P083581). https://documents1.worldbank.org/curated/ar/598911517844600614/Implementation-Completion-and-Results-Report-ICR-Document-01312018.docx
Transport for Cairo. (2022, August 11). Using new urban mobility data in accessibility analysis. Transport for Cairo. https://transportforcairo.com/portfolio/https://transportforcairo.com/wp-content/uploads/2023/09/2_Main_Report.pdf
Transport in Cairo. (2023, August 7). In Wikipedia. https://en.wikipedia.org/wiki/Transport_in_Cairo
Tuk Tuk in Nairobi. (2010, March 25). In Wikimedia. https://commons.wikimedia.org/wiki/File:Tuk-tuk_in_Nairobi_2.JPG
Umutoni, b., Tumushime, J. C., Hewins, B., Udahemuka, J. C., Ndishimye, P., Kelvin, D. J., & Martinez, G. S. (2024). The impact of public transportation on the transmission of COVID-19 in Rwanda. Forntiers in Public Health, 12, 1345433. https://doi.org/10.3389%2Ffpubh.2024.1345433
Urban_EAFIT. (2019, November 12). Medellín: dos historias de transformación [Video]. YouTube.https://www.youtube.com/watch?v=CFtLKU9AzZw
UNDP (2024). A closer look at informal (popular) transportation: An emerging portrait. United Nations Development Programme. Accelerator Labs, Popular Transportation Global Network.https://www.undp.org/acceleratorlabs/publications/closer-look-informal-popular-transportation-emerging-portrait
usdotfta. (2024, July 23). FTA history part 2 [Video]. YouTube. https://www.youtube.com/watch?v=qFZOMMq5Yss
Venter, C., Mahendra, A., & Hidalgo, D. (2019). From mobility to access for all: Expanding urban transportation choices in the Global South. World Resources Institute. https://www.sipotra.it/wp-content/uploads/2019/05/From-Mobility-to-Access-for-All-Expanding-Urban-Transportation-Choices-in-the-Global-South.pdf
Welch, B. (2021, February 16). When Bogota belongs to the bicycles: How Ciclovia has shaped Colombia’s capital city: We speak with Jamie Ortiz Marino, who started Ciclovia 47 years ago. Velo Outside.https://velo.outsideonline.com/road/road-culture/when-bogota-belongs-to-the-bicycles-how-ciclovia-has-shaped-colombias-capital-city/
WorldSteel Association (2024). Transforming transport in Nigeria’s megacity. https://worldsteel.org/media/steel-stories/infrastructure/transforming-transport-in-nigerias-megacity/
Microbus: Also called a minibus, minicoach and at least a dozen regional variations including chiva bus in Ecuador, dala dala in Tanzania, dolmuş in Turkey, jeepney in the Philippines, pesero in Mexico City, tap tap in Haiti, weyala in Ethiopia, and matatu in Kenya. These privately-operated passenger buses and vans can transport dozens of passengers and often do not serve a fixed route, but rather operate as an informal shared mobility service (“Microbus,” 2024).
Bus Rapid Transit (BRT): High-capacity public transportation system utilizing buses, often in dedicated lanes or roadways and with other priority design features and frequent service to improve speed and efficiency (“Bus rapid transit,” 2024).
Micromobility: A range of small and lightweight modes of transport, often human-powered, though occasionally electrified which operate at lower speeds (below 25 km/h or 15mph) over relatively short distances (10k or 6 miles) in urban environments (ITDP, 2020).
Ciclovia: Spanish term for “cycleway.” A movement of open streets events where bicycles and people use existing streets temporarily closed for automobile traffic. The Ciclovia originated in Bogota, Columbia in 1974 by organizer Jamie Ortiz Marino and others, and has now been adopted around the world (“Ciclovia,” 2024).
Open Streets: Temporary closure of streets to automobiles, open for walking, bicycling and social activities which grew out of the Ciclovia movement. (“Tactical Urbanism,” 2024).
Rickshaw: a two- or three-wheeled cart either pulled by hand, pedaled, or using a small gasoline or electric motor, especially popular throughout Asia (“Rickshaw,” 2024).
Informal transportation: Privately supplied transportation options without fixed route or schedule and often shared, which are often not formally regulated by government agencies (TUMI, 2022).
Boda bodas are a type of motorcycle taxi commonly used in East Africa, especially in countries like Kenya and Uganda. These motorcycles are used for transporting passengers and goods over short distances, often navigating through congested urban areas where larger vehicles cannot easily travel. Boda bodas are known for their flexibility, affordability, and ability to reach remote or densely populated areas.
Motorcycle taxi: Like the microbus, this is another privately-operated informal transportation option that may have many names including cart bike, bike taxi, motodops in Cambodia, maroua in Cameroon, ojek in Indonesia, okada in Nigeria, win motoseai in Thailand, xe ôm in Vietnam and boda boda in Kenya. The motorcycle operator carries one or more passengers as they navigate rapidly through otherwise congested streets in urban regions around the world for a negotiated fare typically less than that of microbuses or automobile taxis (“Boda boda,” 2024; “Motorcycle taxi,” 2024).
A tuk-tuk is a small, three-wheeled motorized vehicle used as a taxi. Known for its maneuverability, it is commonly found in Asian cities and other parts of the Global South. It typically seats two to three passengers and is popular for short-distance travel.
Super app is a mobile application that provides a wide range of services like messaging, social networking, ride-hailing, e-commerce, wallets, food delivery, etc., within a single platform. Examples of super apps include WeChat, Gojek, and Grab.
Fintech is a company or technology that offers financial services through software and digital platforms. This includes services like online banking, mobile payments, peer-to-peer lending, and investment management. Fintechs aim to automate the delivery and use of financial services.
The digital divide is the unequal access to digital technology, including the internet, tablets, laptops, smartphones, and smartphone applications ("Digital divide," 2024).

