11 Unconfined Compressive Strength Test
Introduction
Practical Application
The test is used in all geotechnical engineering designs (e.g., design and stability analysis of foundations, retaining walls, slopes, and embankments) to obtain a rough estimate of the soil strength and determine the viable construction techniques.
Objective
The objective of this experiment is
- To determine the unconfined compressive strength (qu) of the soil
Equipment
- Unconfined compression testing machine (triaxial machine)
- Specimen preparation equipment
- Sample extruder
- Balance
Standard Reference
- ASTM D2166: Standard Test Method for Unconfined Compressive Strength of Cohesive Soil
Method
- Remolded specimens are prepared in the laboratory and are dependent upon the Proctor data pertaining to the required molding water content.
- If testing undisturbed specimens retrieved from the ground by various sampling techniques, trim the samples into regular triaxial specimen dimensions (2.8 inch x 5.6 inch)
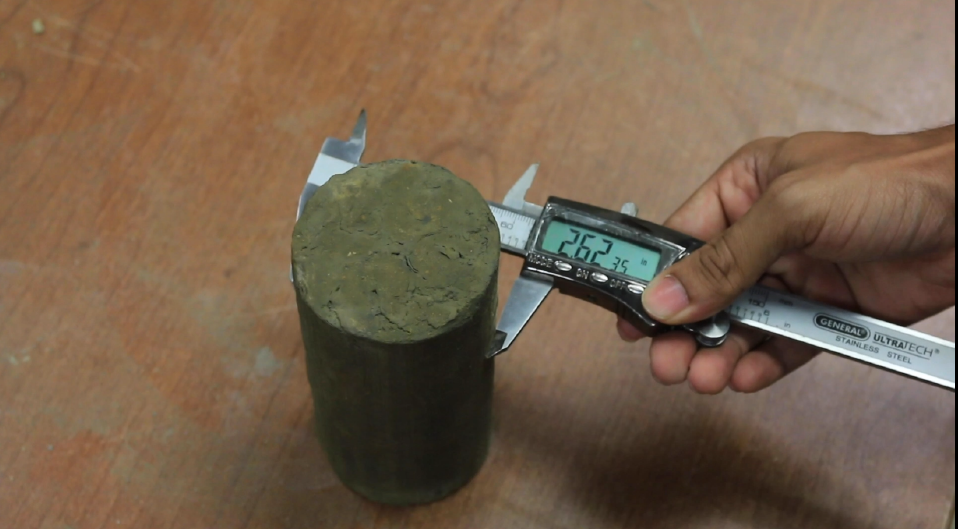
Figure 11.1: Measuring the specimen width 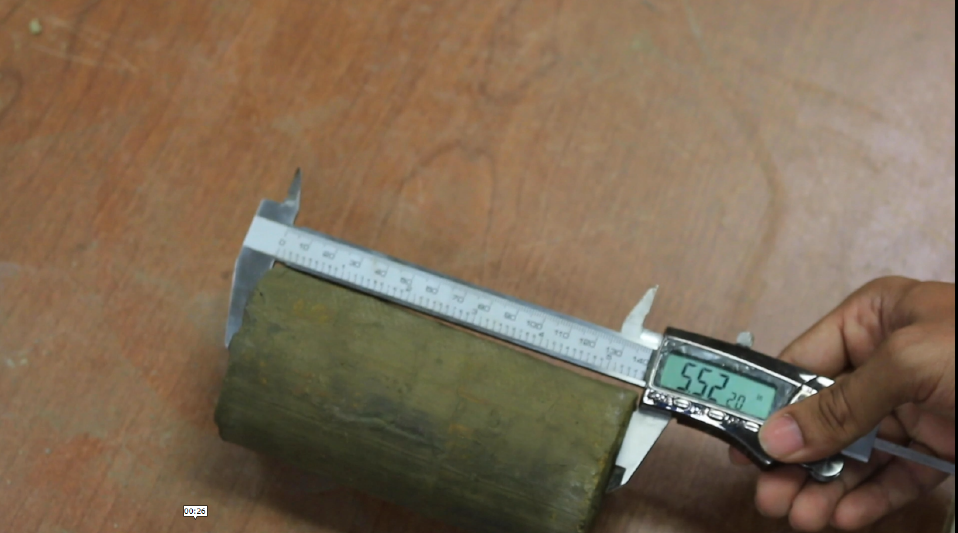
Figure 11.2: Measuring the specimen height - There will be significant variations in the strength of undisturbed and remolded samples.
Measure the diameter and length of the specimen to be tested - If curing the soil samples (treated soils), wrap them in a geotextile and put them in a ziplock bag. Place the sample in a humidity room maintained at a relative humidity of 90%.
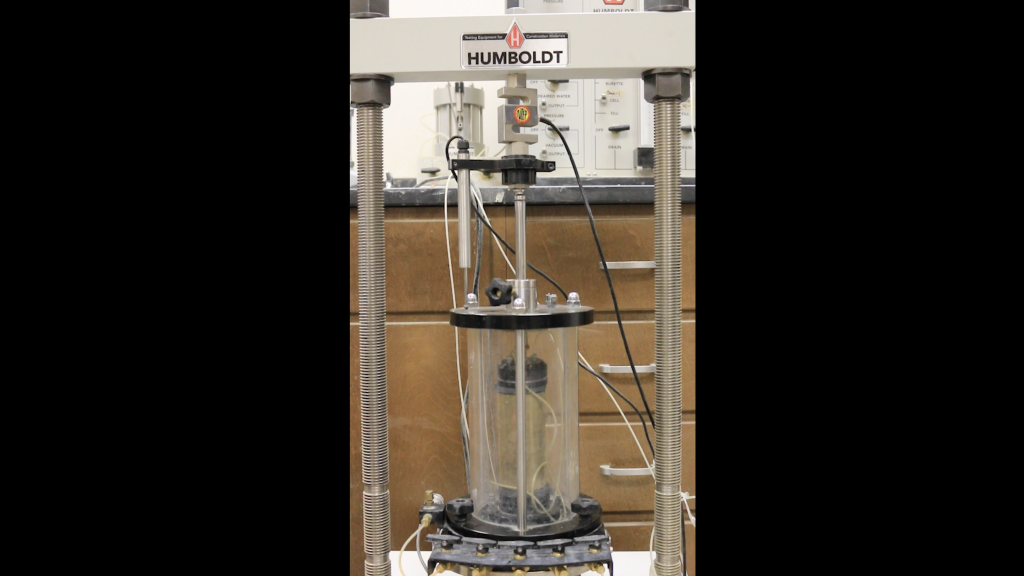
Figure 11.3: Unconfined compression - Prior to testing, avoid any moisture loss in the sample, and place it on an acrylic triaxial base. The ends of the sample are assumed to be frictionless.
- Without applying confinement, place the triaxial cell above the sample.
- Maintain the rate of strain at 1.2700 mm/min, as per ASTM specifications.
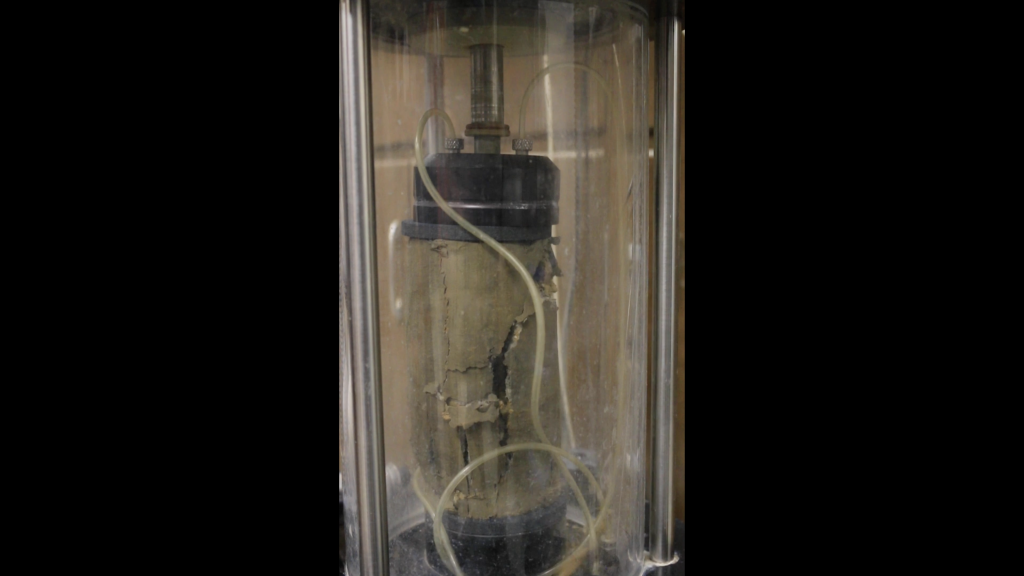
Figure 11.4: Broken specimen - Stop the test when you observe a drop in the strain versus load plot. The data acquisition system collects real-time data.
Video Materials
Lecture VIdeo
A PowerPoint presentation is created to understand the background and method of this experiment.
Demostration Video
A short video is executed to demonstrate the experiment procedure and sample calculation.
Results and Discussions
Sample Data Sheet
Diameter (d) = 7.29 cm
Length (L0) = 14.78 cm
Mass = 1221.4 g
Table 11.1: Moisture content determination

Area (Ao)= p/ × (7.29)= 41.74 cm2
Volume= p/4 × (7.29)2 × 14.78$= 616.9 cm2
Wet density= 1221.4/616.9 = 1.98 g/cm3
Water content (w%) = 25.9%
Dry density (γd) = 1.98/(1+25.9/100) =1.57 g/cm3
Table 11.2: Unconfined Compression Test Data (Deformation Dial: 1 unit = 0.10mm; LoadDial: 1 unit = 0.3154 lb)
| Deformation
Dial Reading |
Load
Dial Reading |
Sample
Deformation (mm) |
Strain | %
Strain |
Corrected
Area, A |
Load
(lb) |
Load
(kN) |
Stress
(kPa) |
| 0 | 0 | 0 | 0 | 0 | 41.7 | 0.0 | 0.0 | 0.0 |
| 20 | 4 | 0.2 | 0.001 | 0.1 | 41.8 | 1.3 | 56.1 | 1.3 |
| 40 | 9 | 0.4 | 0.003 | 0.3 | 41.9 | 2.8 | 126.3 | 3.0 |
| 60 | 12 | 0.6 | 0.004 | 0.4 | 41.9 | 3.8 | 168.4 | 4.0 |
| 80 | 19 | 0.8 | 0.005 | 0.5 | 42.0 | 6.0 | 266.6 | 6.4 |
| 100 | 21 | 1 | 0.007 | 0.7 | 42.0 | 6.6 | 294.7 | 7.0 |
| 120 | 24 | 1.2 | 0.008 | 0.8 | 42.1 | 7.6 | 336.8 | 8.0 |
| 140 | 26 | 1.4 | 0.009 | 0.9 | 42.1 | 8.2 | 364.9 | 8.7 |
| 160 | 29 | 1.6 | 0.011 | 1.1 | 42.2 | 9.1 | 406.9 | 9.6 |
| 180 | 33 | 1.8 | 0.012 | 1.2 | 42.3 | 10.4 | 463.1 | 11.0 |
| 200 | 36 | 2 | 0.014 | 1.4 | 42.3 | 11.4 | 505.2 | 11.9 |
| 250 | 45 | 2.5 | 0.017 | 1.7 | 42.5 | 14.2 | 631.5 | 14.9 |
| 300 | 54 | 3 | 0.020 | 2.0 | 42.6 | 17.0 | 757.8 | 17.8 |
| 350 | 64 | 3.5 | 0.024 | 2.4 | 42.8 | 20.2 | 898.1 | 21.0 |
| 400 | 74 | 4 | 0.027 | 2.7 | 42.9 | 23.3 | 1038.4 | 24.2 |
| 450 | 84 | 4.5 | 0.030 | 3.0 | 43.1 | 26.5 | 1178.8 | 27.4 |
| 500 | 93 | 5 | 0.034 | 3.4 | 43.2 | 29.3 | 1305.0 | 30.2 |
| 550 | 102 | 5.5 | 0.037 | 3.7 | 43.4 | 32.2 | 1431.3 | 33.0 |
| 600 | 112 | 6 | 0.041 | 4.1 | 43.5 | 35.3 | 1571.7 | 36.1 |
| 650 | 120 | 6.5 | 0.044 | 4.4 | 43.7 | 37.9 | 1683.9 | 38.6 |
| 700 | 129 | 7 | 0.047 | 4.7 | 43.8 | 40.7 | 1810.2 | 41.3 |
| 750 | 138 | 7.5 | 0.051 | 5.1 | 44.0 | 43.5 | 1936.5 | 44.0 |
| 800 | 144 | 8 | 0.054 | 5.4 | 44.1 | 45.4 | 2020.7 | 45.8 |
| 850 | 152 | 8.5 | 0.058 | 5.8 | 44.3 | 48.0 | 2133.0 | 48.2 |
| 900 | 160 | 9 | 0.061 | 6.1 | 44.4 | 50.5 | 2245.2 | 50.5 |
| 950 | 166 | 9.5 | 0.064 | 6.4 | 44.6 | 52.4 | 2329.4 | 52.2 |
| 1000 | 171 | 10 | 0.068 | 6.8 | 44.8 | 53.9 | 2399.6 | 53.6 |
| 1100 | 182 | 11 | 0.074 | 7.4 | 45.1 | 57.4 | 2554.0 | 56.6 |
| 1200 | 192 | 12 | 0.081 | 8.2 | 45.4 | 60.6 | 2694.3 | 59.3 |
| 1300 | 202 | 13 | 0.088 | 8.8 | 45.8 | 63.7 | 2834.6 | 61.9 |
| 1400 | 209 | 14 | 0.095 | 9.5 | 46.1 | 65.9 | 2932.8 | 63.6 |
| 1500 | 217 | 15 | 0.101 | 10.1 | 46.5 | 68.5 | 3045.1 | 65.6 |
| 1600 | 223 | 16 | 0.108 | 10.8 | 46.8 | 70.3 | 3129.3 | 66.9 |
| 1700 | 229 | 17 | 0.115 | 11.5 | 47.2 | 72.2 | 3213.5 | 68.1 |
| 1800 | 234 | 18 | 0.122 | 12.2 | 47.5 | 73.8 | 3283.7 | 69.1 |
| 1900 | 240 | 19 | 0.129 | 12.9 | 47.9 | 75.7 | 3367.9 | 70.3 |
| 2000 | 243 | 20 | 0.135 | 13.5 | 48.3 | 76.7 | 3410.0 | 70.6 |
| 2200 | 250 | 22 | 0.149 | 14.9 | 49.0 | 78.9 | 3508.2 | 71.5 |
| 2400 | 253 | 24 | 0.162 | 16.2 | 49.8 | 79.8 | 3550.3 | 71.2 |
| 2600 | 255 | 26 | 0.176 | 17.6 | 50.6 | 80.4 | 3578.3 | 70.7 |
| 2800 | 256 | 28 | 0.189 | 18.9 | 51.5 | 80.8 | 3592.4 | 69.8 |
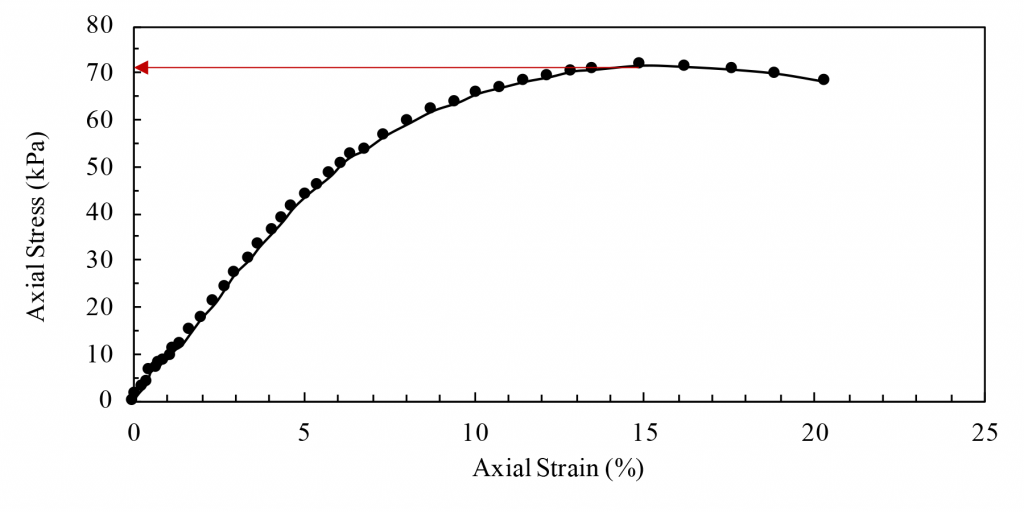
| 3000 | 254 | 30 | 0.203 | 20.3 | 52.4 | 80.1 | 3564.3 | 68.1 |
Unconfined compressive strength, qu = 71.5 kPa
Undrained cohesion, cu = qu/2= 35.75 kPa
Report
Use the template provided to prepare your lab report for this experiment. Your report should include the following:
- Objective of the test
- Applications of the test
- Apparatus used
- Test procedures (optional)
- Analysis of test results – Complete the table provided and show one sample calculation.
- Summary and conclusions – Comment on the cohesion value of the tested sample.
