Chapter 2: Transportation and Climate Change
Chapter Overview
In this chapter, we specifically focus on the carbon emissions aspects of transportation policies, technologies, and investments. We start with the historical backdrop of the broader discussion on climate change. Then, we narrow down the discussion in the realm of transportation. Broadly, this chapter classifies the actions to be taken in the transportation sector to mitigate climate change as follows – short term (1-10 years), medium term (11- 30 years), and longer term (30+ years). Within each block, the actions are classified in (a) steps that reduce travel (b) increase efficiency (c) change the energy pathways (d) reduce exposure or increase resiliency.
In October of 2018, the Intergovernmental Panel on Climate Change (IPCC) released the Special Report on Global Warming of 1.5°C. The IPCC report found that any increase in average global temperatures would have negative health and economic impacts on people throughout the world. They also found that limiting global warming to temperature increases of no more than 1.5°C above pre-industrial levels could reduce the number of people who would experience those impacts by up to several hundred million. In order to limit temperature increases to 1.5°C above pre-industrial levels, we would need to reduce human-generated carbon emissions by 45 percent over the next decade or so, and by 100 percent by 2050.
Transportation represents about 15 percent of all carbon emissions globally (Center for Climate and Energy Solutions 2017) and about 28 percent of all carbon emissions in the United States (Environmental Protection Agency 2015). It is clear that the way we are currently meeting our mobility needs is unsustainable. We urgently need to reduce our mobility dependence on carbon.
Chapter Topics
- Basics of Climate Change Science
- Impact of Transportation Sector on Climate Change Related Emissions
- Relation of Emissions with Vehicle Activity
- Actions to Mitigate Climate Change Impacts from Transportation
- Impacts of Climate Change on Transportation
Learning Objectives
At the end of the chapter, the reader should be able to do the following:
- Explain the basic concepts of climate change science.
- Discuss the anthropogenic drivers of climate change.
- Identify the transportation decisions and activities contributing to climate change.
- Select actions to address climate change within the transportation sector considering the economic implications and technological maturity.
Climate Change
The Earth’s climate is continually changing. If we are to understand the current climate and predict the climate of the future, we need to be able to account for the processes that control the climate. One hundred million years ago, much of North America was arid and hot, with giant sand dunes common across the continent’s interior. Six hundred and fifty million years ago it appears that the same land mass—along with the rest of the globe—was covered in a layer of snow and ice. What drives these enormous changes through Earth’s history? If we understand these fundamental processes we can explain why the climate of today may also change.
Weather Vs. Climate
Weather describes the short term state of the atmosphere. This includes such conditions as wind, air pressure, precipitation, humidity and temperature. Climate describes the typical, or average, atmospheric conditions. Weather and climate are different as the short term state is always changing but the long-term average is not. On the 1 of January, 2011, Chicago recorded a high temperature of 6 C; this is a measure of the weather. Measurements of climate include the averages of the daily, monthly, and yearly weather patterns, the seasons, and even a description of how often extraordinary events, such as hurricanes, occur. So if we consider the average Chicago high temperature for the 1 of January (a colder 0.5 C) or the average high temperature for the entire year (a warmer 14.5 C) we are comparing the city’s weather with its climate. The climate is the average of the weather.
The Atmospheric Blanket: The Natural Greenhouse Effect
The Earth’s atmosphere is an extremely thin shell compared with the size of our planet. The primary gases in the atmosphere by volume are nitrogen (78.1%), oxygen (20.9%), and argon (0.9%). These figures don’t include water vapor, which varies significantly with location and altitude but averages about 0.4% of the atmosphere globally. Other naturally occurring gases include carbon dioxide (designated by chemists as CO2), ozone, and methane, which all occur in trace amounts. Although CO2, methane, and ozone occur naturally, human activities are increasing their concentrations.
Our planet’s fundamental energy source is incoming radiation from the sun, which we will refer to as incoming solar energy. Not all of this solar energy is absorbed by the planet. About 29% of it is reflected back into space by the atmosphere, the land surface, and the sea surface. The percentage of solar radiation reflected back into space is called the albedo. The primary climate variables responsible for the Earth’s 29% albedo are clouds, snow cover, ice sheets, sea ice, glaciers, and oxygen and nitrogen in the atmosphere. In general, whiter substances (clouds, ice, and snow) reflect more solar radiation. The scattering of sunlight by oxygen and nitrogen gives the sky its blue color.
After 29% of the incoming solar radiation is reflected back to space, the Earth absorbs the remaining 71%, which heats the land, ocean surface, and atmosphere. In response, the surface and the atmosphere radiate (i.e., give off) this heat by emitting infrared radiation. This infrared radiation is commonly referred to as heat energy because the infrared radiation emitted by any substance depends on its temperature. The higher an object’s temperature, the more heat energy it emits.
However, not all of the emitted heat energy can escape to space. The greenhouse gases in the intervening atmosphere absorb (trap) some of this heat energy. As a result, the heat energy leaving the planet is reduced by the intervening atmosphere. It is this trapping of heat energy that otherwise would have escaped to space through the atmosphere that is referred to as the greenhouse effect.
CO2 increased by human activities
While the natural greenhouse effect is vital for maintaining life on Earth, humans have added an enormous amount of carbon dioxide to the thin shell of the atmosphere since the dawn of the Industrial Revolution. As of 2017, we have dumped 2,200,000,000,000 (2.2 trillion) tons of carbon dioxide into the atmosphere over the past 240 years. About 45% of that carbon dioxide still remains in the air today. That leaves a blanket of human-generated carbon dioxide in our thin atmospheric shell whose sheer weight is astounding—990 billion tons. That’s equivalent to the weight of about 490 billion cars circling the planet all the time.
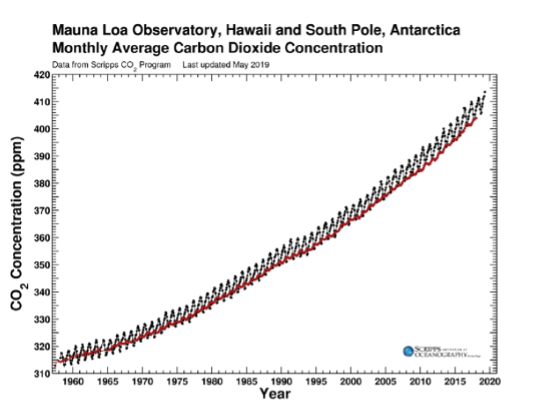
How do we know the weight of the human-made CO2? From direct measurements initiated by Charles David Keeling of the Scripps Institution of Oceanography (UC San Diego). This wiggly curve (Figure 2.1) is called the Keeling Curve and shows the concentration of carbon dioxide in the atmosphere. When Keeling first started making measurements in 1958, the atmospheric carbon dioxide concentration was 313 parts per million (abbreviated as 313ppm). That is, out of every million molecules in the atmosphere, 313 were carbon dioxide molecules in 1958.
What are the sources for the observed increase in CO2?
Many human activities that address our basic needs, development, and well-being are sources of greenhouse gases. Most of the energy used by society since the Industrial Revolution has come from fossil fuels: coal, oil, and natural gas. Burning fossil fuels emits the largest amount of CO2 by far, contributing an estimated 34 billion tons in 2016. Major anthropogenic sources of carbon dioxide include the following:
- Using fossil fuels to produce electricity: In 2016, 65% of electricity worldwide was generated by burning fossil fuels, including 38% from coal and 23% from natural gas. Coal emits roughly twice as much CO2 per unit of electricity generated as natural gas, so burning coal to generate electricity is particularly concerning.
- Transportation: There are about 1 billion motor vehicles in use around the world, the vast majority of which use oil-based fuels. Aviation and commercial shipping are also major emitters of carbon dioxide.
- Residential and commercial buildings and activities: In addition to indirect emissions from electricity use, buildings can be a direct source of CO2 emissions, primarily through heating. In developed countries, natural gas is frequently used for space heating, water heating, and cooking. The least affluent 3 billion, with limited access to fossil fuels, frequently burn wood or animal dung for heating and cooking, which also release CO2.
- Industrial processes: A range of industrial processes, in particular cement and steel production, emit significant amounts of CO2. Cement production alone is estimated to have been responsible for 2 billion tons of CO2 emissions in 2016.
- Land use: Changes in land use, in particular burning forests to clear land for farming, grazing, or housing, also emit significant amounts of carbon dioxide. Over the decade 2007–2016, CO2 emissions from land use averaged about 5 billion tons per year.
Impact of Transportation on Emissions
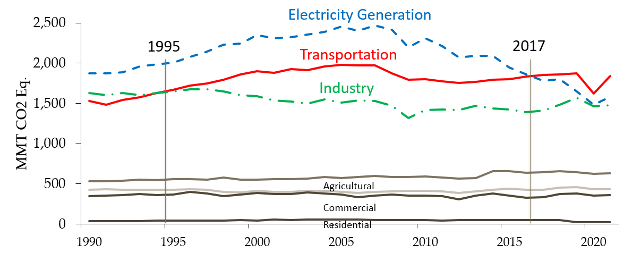
Today’s transportation systems depend on motor vehicles. As shown in Figure 2.2, by 2017 transportation as a whole had become the largest emitter of greenhouse gases in the United States. In fact, in 2017 the US Environmental Protection Agency (US EPA) reported transportation emissions to be 1,866 million metric tons of CO2 equivalent (MMT CO2e), approximately 29% of total US emissions. If one also considers the refining of fuels and the energy used to build roads, the emissions attributable to transportation are even higher. Where electricity generation has low greenhouse gas (GHG) emissions, transportation’s share of the total is much higher. For example, in California in 2017, transportation-related emissions accounted for 41% of California’s GHG emissions, or about 48% with refining of transportation fuels.
Transportation is also the largest source of directly emitted air pollutants that cause local air pollution, including carbon monoxide (CO), oxides of nitrogen (NOx), and particulate matter (PM). Motor vehicles emit other gases as well, including hydrocarbons (HC) that lead to the formation of ozone (O3) and secondary PM. And air-conditioning units in vehicles increase fuel use and emit hydrofluorocarbon (HFC) refrigerant emissions that are short-lived climate super pollutants. Vehicle-related pollution causes about 15,000 premature deaths annually in the US and between 184,000 and 242,000 globally.
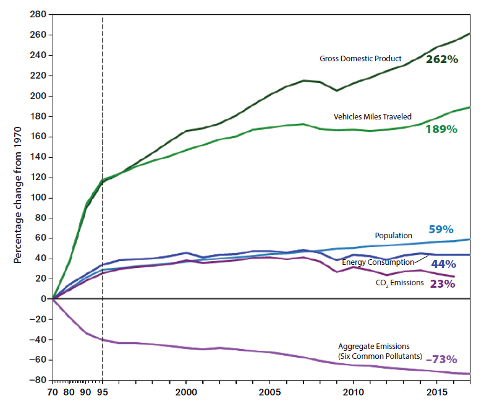
Fortunately, air quality has dramatically improved in US cities since the 1970s. Figure 2.3 shows that air pollutants from cars and light trucks were reduced by 73% from 1970 to 2016, even though VMT almost doubled.
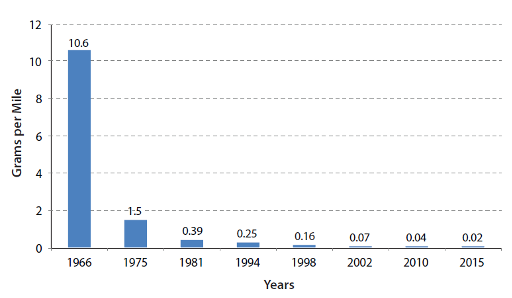
This huge reduction in air pollutants was due to technological advances in vehicle emission control technology and the reformulation of gasoline and diesel fuels. These technology and refining improvements are the result of increasingly stringent performance standards adopted by the US EPA and the California Air Resources Board (CARB). Hydrocarbon and carbon monoxide exhaust emissions from new light-duty vehicles have decreased by over 99% in the US, as shown in Figure 2.4. Massive improvements are also being achieved with trucks, ships, locomotives, and other transportation modes, but they are lagging improvements in cars.
Vehicle activity and emissions
In order to understand the breadth of potential transportation-related emissions reductions, it is useful to understand the relationship between vehicle activity and the corresponding emissions. There are several factors that play a role in how much a vehicle emits from the tailpipe. A typical driving trip will consist of idling, accelerating, cruising, and decelerating. The proportion of a trip spent in these different stages will depend on the driver’s behavior (for example, aggressive versus mild driving habits), the roadway type (for example, freeway versus arterial roadway), and the level of traffic congestion.
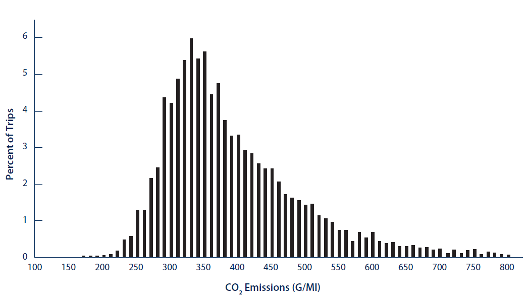
We can create histograms of emissions for large regional areas. Data collected from passenger vehicles in Southern California are presented in Figure 2.5. As indicated, most trips produce about 330 grams of CO2 emissions per mile, corresponding to approximately 26 miles per gallon of fuel economy. Other trips, however, produce far less or far more CO2 emissions per mile, depending on the specific driving pattern. This variation comes from the driver’s behavior, the roadway type, and the level of traffic congestion. Other vehicle types will have quite different emissions depending on their weight, power, and other vehicle factors.
Electric vehicles have zero tailpipe emissions, but their energy efficiency (and upstream power plant emissions) is affected by these same factors.
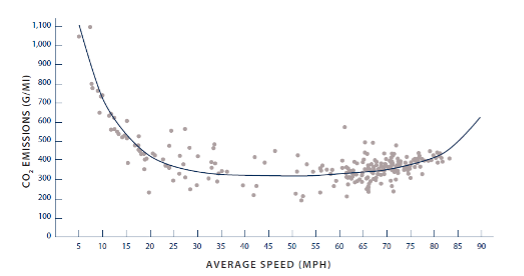
If one plots emissions against speeds, one observes a U-shaped pattern as shown in Figure 2.6. The resulting emissions-speed curve can be generalized for different types of vehicles, different driving behaviors, and different types of trips, as shown in Figure 2.7. This generalized curve can then be used as a tool for evaluating different carbon reduction schemes for transportation management. The upper line in Figure 2.7 shows a representative emissions-speed curve for typical traffic. We can use this curve to examine how different traffic management techniques can affect vehicle emissions such as CO2. The lower line represents the approximate lower bound of CO2 emissions for typical internal combustion vehicles traveling at a constant steady-state speed.
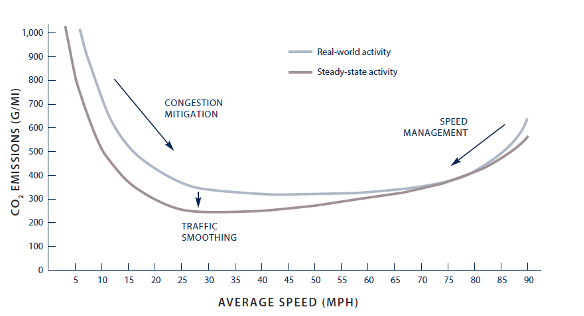
Several important results can be derived from Figure 2.7:
- If congestion reduces the average vehicle speed below 45 mph (for this particular freeway scenario), emissions increase. At these lower speeds, vehicles operate less efficiently and spend more time on the road, resulting in higher emissions. In this scenario, congestion mitigation programs will directly reduce emissions.
- If moderate congestion reduces average speeds from a free-flow speed over 70 mph to a slower speed of 45 to 55 mph, this moderate congestion can reduce emissions (because emissions are higher and energy efficiency is lower at very high speeds). With no congestion, average traffic speeds can increase to over 65 mph, increasing emissions.
- Smoothing stop-and-go traffic will reduce emissions.
- Electric vehicles (EV) powered by renewable energy will have near-zero life cycle emissions; if electric vehicles are powered by fossil fuels, emissions from power plants will be lower at lower speeds, for the same reason as for internal combustion engine vehicles (ICEV) but even more so because regenerative braking captures energy in stop-and-go traffic. EVs are more energy efficient than similar ICEVs, but their GHG mitigation potential depends on the upstream source of electricity production. This upstream GHG intensity constitutes the Well-to-Tank (WtT) part of the total lifecycle emissions for EV. In addition to WtT emissions, emissions from battery pack manufacturing and vehicle manufacturing are critical for an accurate life cycle assessment (LCA) emission for EVs. These sources of emissions are better captured in the cradle-to-grave LCA estimate which includes emissions related to raw material extraction, fuel production and transport, vehicle manufacturing, vehicle use, and vehicle-end-of-life
Transportation Sector GHG Reduction Strategies
Pollutant and GHG emissions can be reduced in many ways. See Figure 2.8 for a simplified framework. GHG emissions may be treated as primary energy carbon intensity multiplied by vehicle and transportation efficiency multiplied by total travel demand.
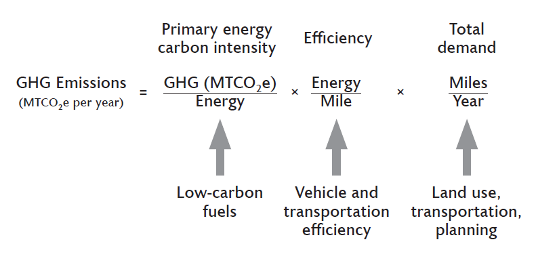
Primary energy carbon intensity can be reduced by using lower-carbon fuels or low-carbon electrification. The energy needed to drive a specific distance can be reduced by improving both (1) vehicle efficiency and (2) transportation system efficiency. This analytical construct—separating the determinants of emissions into carbon intensity, efficiency, and demand—can be used as a policy framework. A large carbon tax would address all three strategies, though it must be very large to be effective. In practice, an environmentally sustainable transportation solution will depend on a mix of policies and strategies.
Strategies to reduce transportation GHG emissions and energy include the following:
- Vehicle technology strategies that reduce fuel consumption, including fuel efficiency improvements and engine technologies;
- Fuel technology strategies using alternative transportation fuels such as biodiesel, compressed natural gas, electric vehicles and hydrogen fuel cell vehicles;
- Land use planning and multimodal transportation strategies that reduce emissions through more compact land uses or changing travel behavior to reduce vehicle trips using transit, rail, ride-sharing, and telework;
- Regulatory instruments and pricing strategies, including congestion pricing, pay-as-you-drive insurance, mileage-based user fees, tolls and fuel taxes;
- Vehicle operations and highway system management strategies such as speed management, congestion relief, incident management, traffic smoothing, traveler information services, and other logistics improvements as well as more fuel-efficient “eco-driving” practices; and
- Construction, maintenance and operations strategies that reduce GHG emissions, such as upgrading construction equipment; different pavement practices and mixes; work-zone management; and energy efficient practices for traffic lighting, transportation buildings, mowing and roadside vegetation management. New York State DOT’s Climate Change and Energy Initiative is an example of the wide range of efforts transportation agencies are taking to reduce greenhouse gas emissions and reliance on petroleum products.
Climate Change Impacts on Transportation
Climate change will affect transportation primarily through increases in several types of weather and climate extremes, such as very hot days; intense precipitation events; intense hurricanes; drought; and rising sea levels, coupled with storm surges and land subsidence. The impacts will vary by mode of transportation and region, but they will be widespread and costly in both human and economic terms and will require significant changes in the planning, design, construction, operation, and maintenance of transportation systems. The changes made in the transporation system to withstand the climate change impacts increase the system resilience against direct and indirect vulnerabilities. In 2008 report of U.S. Transportation Research Board the following statement was made:
“Potentially, the greatest impact of climate change for North America’s transportation systems will be flooding of coastal roads, railways, transit systems, and runways because of global rising sea levels, coupled with storm surges and exacerbated in some locations by land subsidence… The Atlantic and Gulf Coasts are particularly vulnerable because they have already experienced high levels of erosion, land subsidence, and loss of wetlands…”
Key Takeaways
- Human related activities or anthropogenic emissions of carbon dioxide is the prime reason for global climate change.
- Transportation is the highest emitting sector of greenhouse gases in the United States.
- There is a huge variability in carbon emissions among trips made in modern automobile depending on congestion on the route and average traffic speed. Emissions can be controlled by changing the vehicle type or the fuel type used.
- Total travel demand increases the amount greenhouse gas emissions given no change in how the traveling is done.
- Climate change in turn affect how a transportation system is planned, designed, and operated in the future.
Self-Test
Glossary: Key Terms
Albedo: The fraction of light that a surface reflects. If it is all reflected, the albedo is equal to 1. If 30% is reflected, the albedo is 0.3. The albedo of Earth’s surface (atmosphere, ocean, land surfaces) determines how much incoming solar energy, or light, is immediately reflected back to space.
Climate: The weather conditions prevailing in an area in general or over a long period.
Climate Super Pollutants: Hydrofluorocarbons (HFCs) are a climate “super-pollutant”: greenhouse gases with hundreds to thousands of times the heat-trapping power of carbon dioxide (CO).
Congestion Pricing: Fees charged for driving on busy city roads reduce greenhouse gas emissions and improve air quality while also generating funding for the transit systems.
Eco-Driving: Adoption of a driving behavior (or a driving style) that aims at saving fuel and reducing harmful emissions of greenhouse gases (GHG).
Fossil Fuels: Fossil fuels are formed from the decomposition of buried carbon-based organisms that died millions of years ago. They create carbon-rich deposits that are extracted and burned for energy. They are non-renewable and currently supply around 80% of the world’s energy.
Greenhouse Effect: a warming of Earth’s surface and troposphere (the lowest layer of the atmosphere) caused by the presence of water vapour, carbon dioxide, methane, and certain other gases in the air.
Heat Energy: Heat energy is the result of the movement of tiny particles called atoms, molecules or ions in solids, liquids and gases.
Incident Management: Planned and coordinated multi-disciplinary process to detect, respond to, and clear traffic incidents and restore traffic flow as safely and quickly as possible.
Incoming Solar Energy: Incoming ultraviolet, visible, and a limited portion of infrared energy (together sometimes called “shortwave radiation”)
Infrared Radiation: Infrared radiation (IR), sometimes referred to simply as infrared, is a region of the electromagnetic radiation spectrum where wavelengths range from about 700 nanometers (nm) to 1 millimeter (mm).
Parts Per Million (ppm): This is a way of expressing very dilute concentrations of substances. Just as percent means out of a hundred, so parts per million or ppm means out of a million. Usually describes the concentration of something in air, water or soil. One ppm is equivalent to 1 milligram of something per liter of water (mg/l) or 1 milligram of something per kilogram soil (mg/kg).
Resilience: The ability to prepare for changing conditions and withstand, respond to, and recover rapidly from disruptions.
Traffic Smoothing: Reduction of acceleration and deceleration (braking) in the traffic stream using traffic management and operations.
Weather: A description of the short term state of the atmosphere.
Work Zone: A work zone is an area of a trafficway with highway construction, maintenance, or utility-work activities. A work zone is typically marked by signs, channeling devices, barriers, pavement markings, and/or work vehicles.
Media Attributions
- Figure 2.1: “Bending the Curve: Climate Change Solutions” by Ramanathan et al. (2019) and reproduced from the Scripps CO2 Program from the Scripps Institution of Oceanography is under the following Creative Commons license: CC BY-NC-SA 4.0
- Figure 2.2: “Change in Total Greenhouse Gas Emissions from Different Sectors in the United States during 1990- 2023” by Shams Tanvir using data from the EPA is under the following Creative Commons license: CC BY-NC-SA 4.0
- Figure 2.3: “Air pollution emissions yearly trends” by Ramanathan et al. (2019) and adapted from US Environmental Protection Agency 2019 is under the following Creative Commons license: CC BY-NC-SA 4.0
- Figure 2.4: “California tailpipe HC performance standards for new light duty vehicle” by Ramanathan et al. (2019) is under the following Creative Commons license: CC BY-NC-SA 4.0
- Figure 2.5: “CO2 emissions, in grams per mile, for a representative database of passenger vehicle trips in Southern California” by Ramanathan et al. (2019) is under the following Creative Commons license: CC BY-NC-SA 4.0
- Figure 2.6: “Emission-speed plot of individual trips or trip segments” by Ramanathan et al. (2019) is under the following Creative Commons license: CC BY-NC-SA 4.0
- Figure 2.7: “Possible use of traffic operation strategies in reducing on-road CO2 emissions” by Ramanathan et al. (2019) is under the following Creative Commons license: CC BY-NC-SA 4.0
- Figure 2.8: “General approach for calculating GHG emissions from transportation” by Ramanathan et al. (2019) is under the following Creative Commons license: CC BY-NC-SA 4.0
References
- Transportation system resilience to extreme weather and climate change. FHWA-HOP-15-025. November 2015. Pursuant to Title 17 Section 105 of the United States Code, this file is not subject to copyright protection and is in the public domain. Copyright information.
Attributions
- Bending the Curve: Climate Change Solutions by Ramanathan, V., Aines, R., Auffhammer, M., Barth, M., Cole, J., Forman, is licensed under CC BY-NC-SA 4.0
- Climate Change and Transportation, Climate Change and Variability by Yuri Yevdokimov is licensed under CC BY-NC-SA-3.0
A description of the short term state of the atmosphere.
The weather conditions prevailing in an area in general or over a long period.
Incoming ultraviolet, visible, and a limited portion of infrared energy (together sometimes called "shortwave radiation")
the fraction of light that a surface reflects. If it is all reflected, the albedo is equal to 1. If 30% is reflected, the albedo is 0.3. The albedo of Earth's surface (atmosphere, ocean, land surfaces) determines how much incoming solar energy, or light, is immediately reflected back to space.
Infrared radiation (IR), sometimes referred to simply as infrared, is a region of the electromagnetic radiation spectrum where wavelengths range from about 700 nanometers (nm) to 1 millimeter (mm).
heat energy is the result of the movement of tiny particles called atoms, molecules or ions in solids, liquids and gases.
A warming of Earth’s surface and troposphere (the lowest layer of the atmosphere) caused by the presence of water vapour, carbon dioxide, methane, and certain other gases in the air.
this is a way of expressing very dilute concentrations of substances. Just as per cent means out of a hundred, so parts per million or ppm means out of a million. Usually describes the concentration of something in air, water or soil. One ppm is equivalent to 1 milligram of something per liter of water (mg/l) or 1 milligram of something per kilogram soil (mg/kg).
fossil fuels are formed from the decomposition of buried carbon-based organisms that died millions of years ago. They create carbon-rich deposits that are extracted and burned for energy. They are non-renewable and currently supply around 80% of the world's energy.
Hydrofluorocarbons (HFCs) are a climate “super-pollutant”: greenhouse gases with hundreds to thousands of times the heat-trapping power of carbon dioxide (CO ).
Fees charged for driving on busy city roads reduce greenhouse gas emissions and improve air quality while also generating funding for the transit systems.
Planned and coordinated multi-disciplinary process to detect, respond to, and clear traffic incidents and restore traffic flow as safely and quickly as possible
Reduction of acceleration and deceleration (braking) in the traffic stream using traffic management and operations.
Adoption of a driving behavior (or a driving style) that aims at saving fuel and reducing harmful emissions of greenhouse gases (GHG)
A work zone is an area of a trafficway with highway construction, maintenance, or utility-work activities. A work zone is typically marked by signs, channeling devices, barriers, pavement markings, and/or work vehicles.
The ability to prepare for changing conditions and withstand, respond to, and recover rapidly from disruptions.

