8 Evaluating System Performance
Chapter Overview
This chapter introduces readers to performance-based planning and common measures and methods for evaluating the performance of the multimodal transportation system in relation to established goals and objectives. Topics include the emergence of performance-based planning, traditional methods of performance evaluation and their limitations, examples of multimodal system performance measures, and approaches for assessing modal quality/level of service and accessibility. The chapter provides case examples of selected topics and applications.
Chapter Topics
- Performance-Based Planning
- Performance Measures for Multimodal Plans
- Modal Quality and Level of Service (LOS)
- Evaluating Accessibility
Learning Objectives
- At the completion of this chapter, readers will be able to:
- Define performance-based planning
- Identify potential performance measures for various aspects of the multimodal system
- Discuss basic approaches to evaluating multimodal quality/level of service and accessibility
- Explain why accessibility is an important measure of multimodal system performance and the limitations of traditional methods of performance evaluation
*
Introduction
Monitoring and measuring system performance is critical to understanding how well a multimodal system is performing in relation to planning goals and objectives. These goals and objectives emerge from the public involvement process and guide the assessment of existing conditions, strategies for improvement, and selection of appropriate metrics to monitor progress. This chapter reviews the concepts and practice of performance-based planning, performance measurement, and related topics, including the limitations of traditional performance evaluation methods.
Performance-Based Planning
Federal transportation law, beginning with the Moving Ahead for Progress in the 21st Century Act (MAP-21), continued in the Infrastructure Investment and Jobs Act (IIJA) , includes provisions requiring states, transit agencies, and metropolitan planning organizations (MPOs) to use performance-based planning and programming processes. The goal of these legislative provisions is to ensure that the diminishing resources available for transportation investments are spent wisely. The U.S. Department of Transportation (2013) describes performance-based planning as “the application of performance management within the planning and programming processes of transportation agencies to achieve desired performance outcomes for the multimodal transportation system” (p. 1). Performance, in this sense, is focused on two general considerations:
- Physical condition of the transportation infrastructure
- Transportation system performance in terms of issues such as safety, efficiency, and reliability
According to FHWA (n.d.), “performance-based planning is the use of a strategic direction (goals and objectives) and performance trends to drive the development of agency strategies and priorities in the long-range transportation plan (LRTP) and other performance-based plans (e.g., safety, asset management, mobility/operations and freight)” (para. 3). In a performance-based planning process, each step is clearly connected to the next to ensure that goals and objectives translate into specific measures that are the basis for selecting and analyzing transportation planning strategies.
The performance areas noted in federal law seek to improve performance in the areas of safety, transit asset management, pavement and bridge performance, and system performance (Table 8. 1). The federal government establishes the standard by which transportation performance is measured. State and MPOs then determine what can be realistically achieved in their respective regions. When the targets are established, agency plans and programs are required to demonstrate how they will achieve those targets.
| Safety (all public roads) |
|---|
| Number of fatalities |
| Number of serious injuries |
| Rate of fatalities per 100 million vehicle miles traveled |
| Rate of serious injuries per 100 million vehicle miles traveled |
| Number of non-motorized fatalities and non-motorized serious injuries |
| Transit Asset Management (TAM) |
| % of revenue vehicles meeting or exceeding useful life benchmark |
| % of non-revenue service vehicles meeting or exceeding useful life benchmark |
| % of facilities rated under 3.0 on the TERM scale |
| % of track segments (by mode) that have performance restrictions |
| Pavement |
| % of pavements of the Interstate system in good condition |
| % of pavements of the non-Interstate NHS (National Highway System) in good condition |
| % of pavements of the Interstate system in poor condition |
| % of pavements of the non-Interstate NHS in poor condition |
| Bridge |
| % of NHS bridges classified as in “good” condition |
| % of NHS bridges classified as in “poor” condition |
| System Performance |
| % of person-miles traveled on the Interstate that are reliable |
| % of person-miles traveled on the non-Interstate NHS that are reliable |
| Truck travel time reliability ratio (TTTR) |
| Congestion Management Air Quality |
| On-road mobile source emissions reduction |
| Rate of reduction particulate matter 2.5 (PM2.5) |
Source: U.S. Department of Transportation, n.d.
Performance Measures for Multimodal Plans
Multimodal plans go beyond the traditional objectives of improving roadway safety and mobility, to address a variety of social, economic and environmental goals and objectives. To do so, requires different performance measures and evaluation methods than have traditionally been used. Equity, for example, is a topic of growing emphasis in planning. Performance measures relative to equity may address topics such as transportation affordability, safety, access to opportunity, and distributional equity of investment relative to underserved populations. The role of transportation in creating quality places or improving public health and activity are other untraditional transportation performance areas increasingly addressed in multimodal planning and evaluation.
Performance measures are metrics that allow decision makers to see how planned projects and strategies are affecting transportation system performance and to monitor system performance over time. Also known as indicators or measures of effectiveness (MOEs), they establish “specific measurable outcomes used to evaluate progress toward established goals and objectives” (Victoria Transport Policy Institute, 2019a, para. 1). Goals and objectives established in a multimodal plan emerge in part from the public involvement process. Table 8. 2 illustrates the multimodal planning process from public input through performance measurement.
| Citizen Input | Goals & Policies | Inventory Baseline | Implementation Step | Performance Measure |
|---|---|---|---|---|
| I want to ride my bike to work but I don’t feel safe | Increase the safety of bicycling in the community. | Inventory of bicycle crashes, facilities and routes. | New bicycle lanes and other facilities on key routes. | Number of key destinations and activity centers that can be reached using designated bicycling facilities; number of bicycle-related crashes. |
| The bus doesn’t go where I need to go. | Fixed route bus service should go to major activity and employment centers. | Examine the relationship of existing bus routes to activity and employment centers. | Redesign bus routes or add new routes as necessary. | Number of routes and frequency of service to activity and employment centers. |
| I need to drive everywhere even just to get a loaf of bread and would like to be able to walk sometimes. | Provide for compatible food, education, retail and service uses on a neighborhood level within or in close proximity to residential areas. | Identify residential neighborhoods lacking proximity to commercial and service uses. | Adjust zoning to allow activity centers near residential areas. | Number of residential units within walking distance of urban core areas or activity centers. |
| Ensure adequate pedestrian facilities. | Inventory existing pedestrian facilities. | Fill gaps in the pedestrian network. | Number of gaps filled in the pedestrian network. |
Source: Williams & Seggerman, 2014, as adapted
Objectives should be measurable so progress can be evaluated and monitored over time. Targets are the benchmark used to determine whether progress is made and may be general (e.g., increase/decrease) or specific (e.g., numeric). One or more performance measures and associated targets can be established to track progress for each planning objective. Table 8. 3 is an example of this practice as applied by a metropolitan planning organization to a goal and objective addressing quality places.
Goal 4: Create Quality Places
Objective 4: Support community social values by developing facilities that are user friendly, multimodal, and encourage healthy and active lifestyles.
Source: Pasco County MPO, 2020, pp. 11–14Modal Quality and Level of Service (LOS)Modal quality and level of service (LOS) analysis is used in planning to determine available capacity and service quality of transportation modes based on existing and anticipated travel demand and a variety of other considerations. LOS evaluates how well the system operates based on the speed, convenience, comfort, and security of transportation facilities and services (Victoria Transport Policy Institute, 2019b). Roadway LOS has long been widely used for motor vehicles, but use of LOS measures for non-auto modes has become increasingly widepread in recent years to evaluate both the quality and level of service provided for bicycle, pedestrian, and transit modes. For example, Table 8. 4 shows the modal LOS standards used by Alachua County, Florida.Source: Alachua County, 2019Variables that influence LOS are demand, control, and geometry. Demand refers to vehicular traffic, transit ridership, and pedestrian flow rates. Control includes those interventions that influence speed such as the posted speed limit, traffic signals, stop signs, and traffic calming features. Geometry includes those physical elements of the system such as the number of lanes, shoulders, parking, sidewalks, bicycle lanes, and medians.A rating system of “A” to “F” is used to convey the quality of transportation service relative to a given mode. In this rating system, “A” represents a higher quality of service and “F” represents a poor quality of service. The chart in Figure 8. 1 illustrates the different LOS concepts for automobiles, transit, bicycles, and pedestrians. No single method characterizes how the rating system is applied, but rather it continues to evolve and a variety of tools and metrics have been used in practice (Brozen et al., 2014). This rating system has been widely critiqued, particularly with regard to automobile level of service, as over simplifying the experience of transportation system users and “overemphasiz[ing] the free flow of automobile traffic while neglecting other users of the transportation system” (Brozen et al., 2014, p. 4). In particular, the use of this rating system for automobiles can lead officials to overbuild the arterial system. The next sections discuss the methods and related issues in more detail.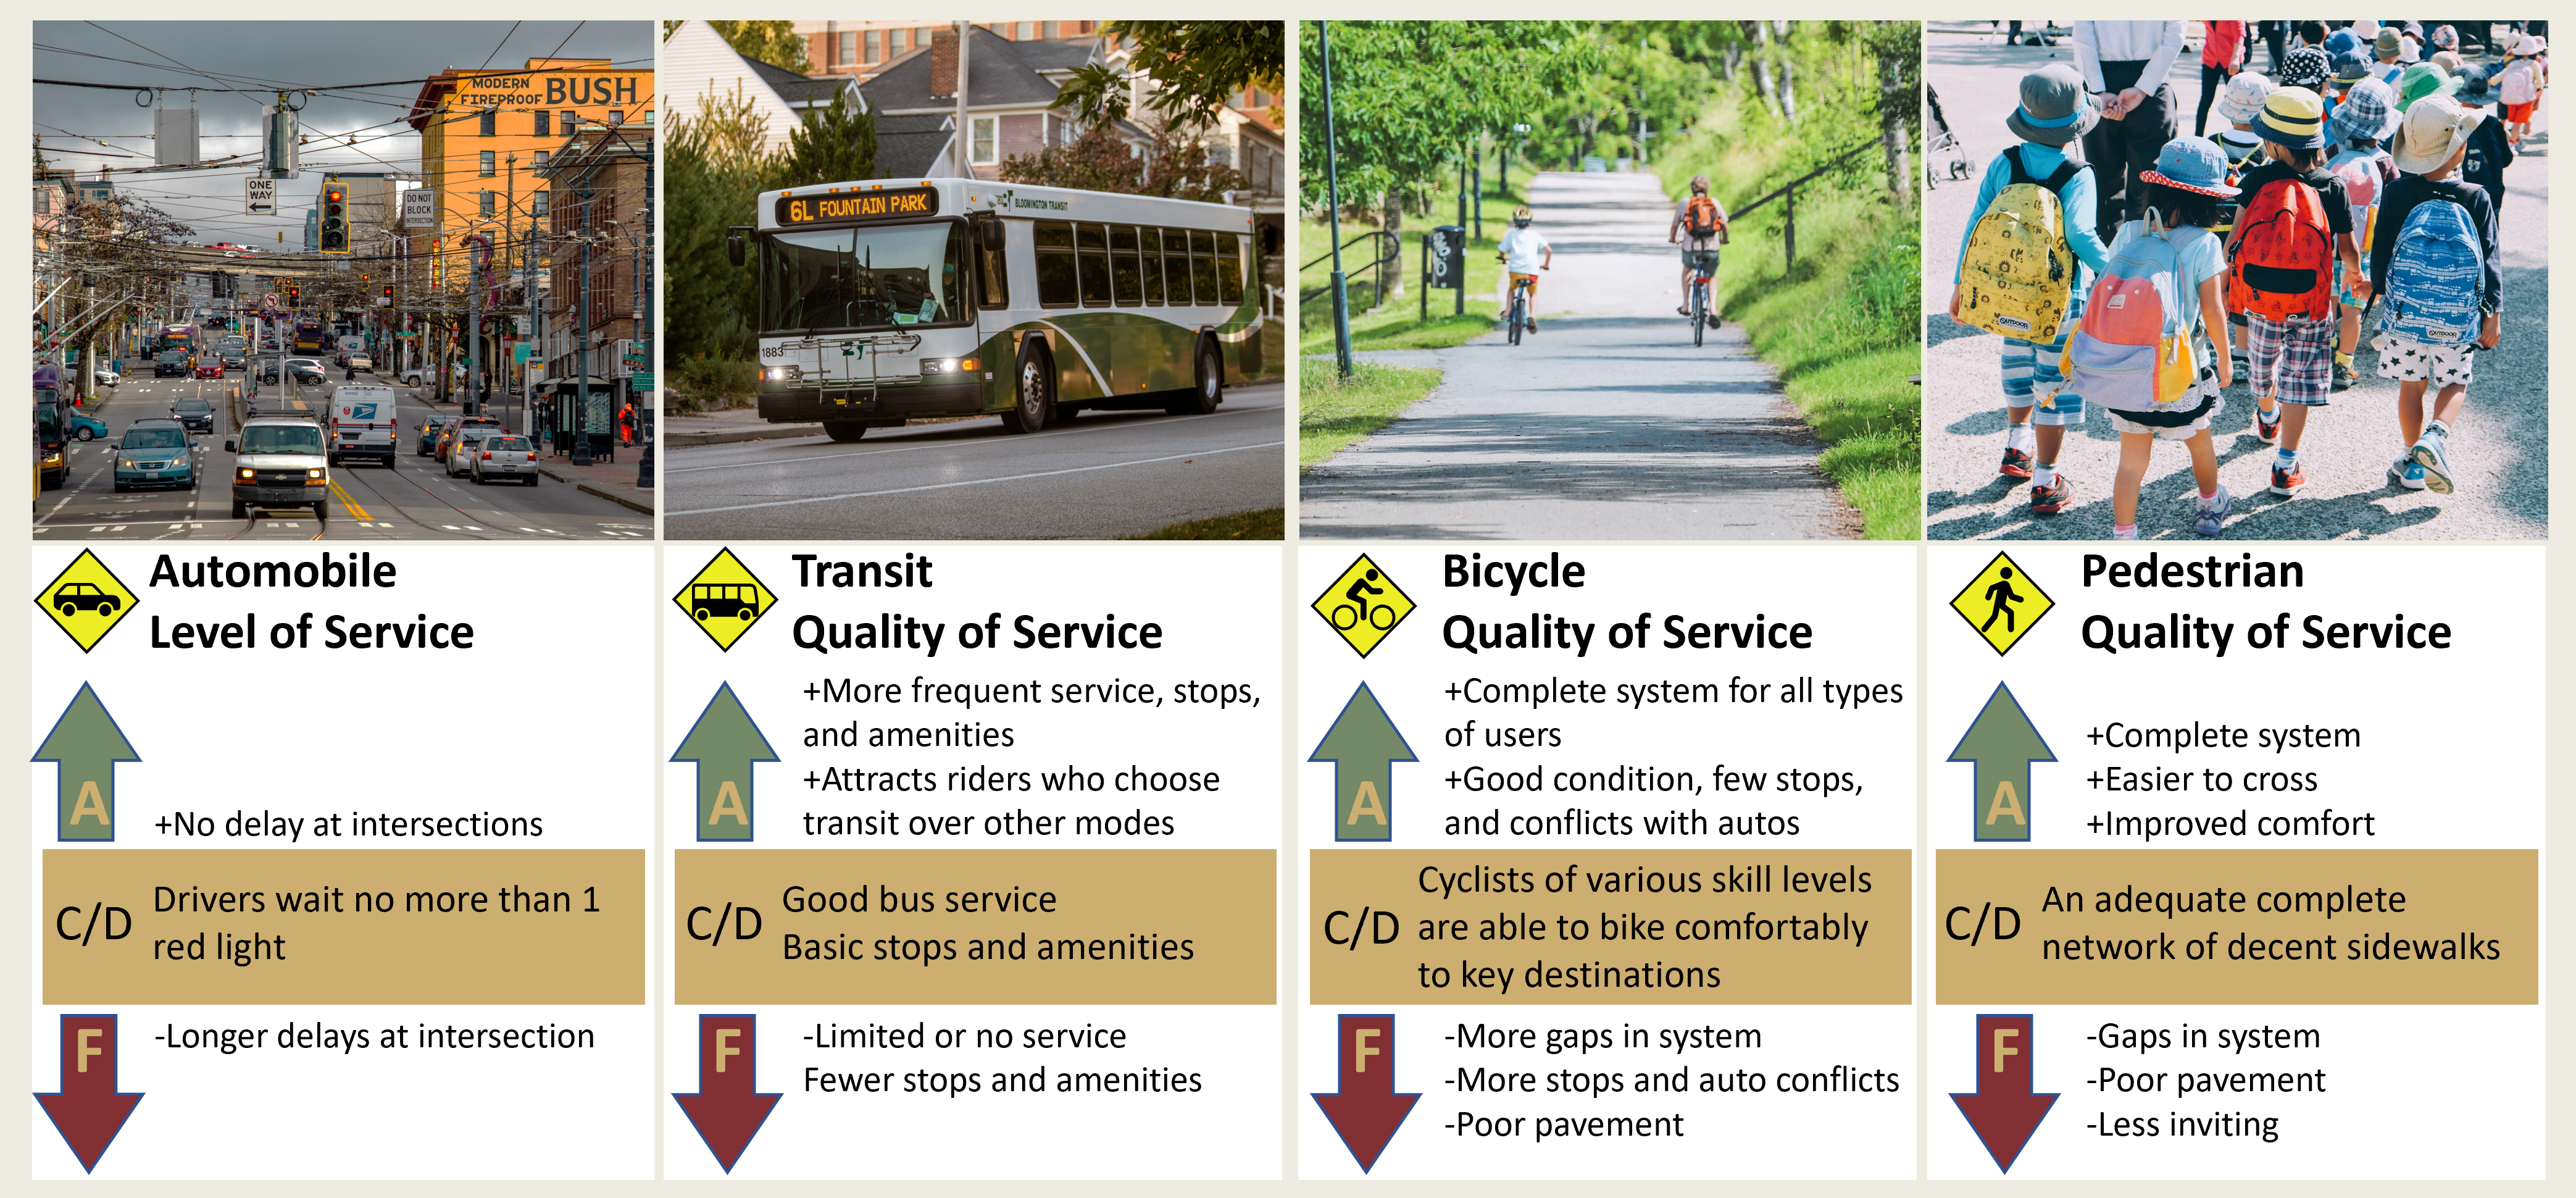
Figure 8. 1. Level of service by mode.
Source: Strader, 2010 reprinted with permission from Brad Strader, MKSK
Automobile LOSFor automobile traffic, LOS is used to evaluate the quality of traffic flow or throughput on roadways and intersections based on performance measures like vehicle speed, density, and congestion (delay) (Table 8. 5). The 2010 Highway Capacity Manual (HCM) defines LOS as “A quantitative stratification of a performance measure or performance measures that represent quality of service measured on an A-F scale with LOS A representing the best operating conditions from the traveler’s perspective and LOS F the worst” (Transportation Research Board, 2010, Vol. 1, p. 5-3). Note that this description in the HCM is based on the traveler’s perspective.When evaluating LOS, it is important to consider a variety of factors such as roadway capacity, the functional classification of the roadway, adjacent land uses, and the needs of the traveling public. For instance, a LOS of A, with free-flowing traffic, low travel times, and high speeds is not always an indication of an efficient roadway system. This LOS may be ideal for local roads at certain times of the day (i.e., non-peak hour), but on arterials or collectors during peak hour it may indicate an overbuilt roadway and misuse of finite agency resources. A LOS of B or C are characterized by free flow or stable traffic flow with some restrictions. A LOS of D or E, with reduced speed and some delays, may not necessarily indicate poor traffic conditions. In these instances, consideration should be given to how much delay is occurring, how long the delay lasts, how often the delay happens, and the overall travel time reliability. LOS F is characterized by stop-and-go traffic, very high delays, and unpredictable travel time. When a roadway has a LOS of F, transportation professionals should consider factors such as existing capacity and demand, and roadway operations and conditions.In the HCM, the performance of roadways is measured by traffic volume, as recorded by loop detectors (sensors under the pavement). These sensors detect vehicles passing or arriving at a certain point; thus, traffic volume information can be derived by aggregating the loop detector’s readings over a certain time window to better understand the nature of traffic flow. Transportation planners and engineers also use the basic volume to capacity ratio to measure LOS for road traffic.Source: Highway Capacity Manual, 1994 as adapted.While level of service A may be considered best for drivers, as it represents free flow and a complete lack of congestion, from a system perspective it indicates that the system is not being used efficiently and that infrastructure is over supplied. In fact, level of service D is generally considered the best situation, especially during peak hours, as it represents a system that is being used to the fullest. Level of service E and F indicate the system is severely congested, and countermeasures are needed to mitigate the congestion.Transit LOSMany different factors enter into determining the availability and adequacy of transit service. Measures of quality/level of service are primarily evaluated from the passenger’s point of view, and include, but are not limited to level of service using the “A” through “F” scale. For example, factors important to passengers include issues such as frequency of service, accessibility considerations (e.g., distance to bus stops), safety and security, travel time, directness of service, speed of boarding and travel, frequency of service, affordability, reliability, comfort, and amenities (Victoria Transport Policy Institute, 2019b). Another set of performance measures focus more on the agency’s perspective. For example, measures used by the Florida Department of Transportation to evaluate transit agency performance are shown in Table 8. 6 .Source: Florida Department of Transportation, 2014, Table 13.Bicycle LOS: BikeabilityPerformance measures for bicycle transportation assess the comfort and convenience of bicycling. Multiple studies have developed methods to evaluate the quality of bicycle infrastructure (Botma, 1995; Dixon, 1996; Jensen, 2007; Lowry et al., 2012; Petritsch et al., 2007).These indices may be referred to as bikeability, bicycle suitability, or bicycle friendliness (Lowry et al., 2012). Factors frequently included in evaluating bicycle level of service are width of outside lane, width of bike lane, width of shoulder, occupied street parking, vehicle traffic volume, vehicle speed, percentage of heavy vehicles, pavement condition, presence of curb, and the number of through lanes (Lowry et al., 2012).Results of the bikeability analysis can be used to evaluate alternatives and prioritize improvement proposals. The deficiencies identified and the benefits of the proposed improvements can be visualized with bikeability maps. The analysis can be supported with demographic data to further illustrate who may experience increased bikeability from a proposed project and how bikeability is experienced by affected persons (Lowry et al., 2012).Sidewalk LOS: WalkabilityIn recent years, a growing number of agencies developed criteria to evaluate walkability for multimodal transportation planning purposes (Lo, 2009). These criteria have been integrated into a variety of tools, such as walk audits, that measure the quality of the walking environment. By comparing different examples, several factors are frequently selected as key elements, including the following (Ewing & Handy, 2009; Frank et al., 2010; Lo, 2009):
- Presence and continuity of sidewalks and pedestrian routes
- Accessibility of facilities to people with different abilities
- Directness of pedestrian paths and connectivity of the street network
- Sidewalk width
- Connections to transit stops and services
- Ease and safety of crossings
- Visual interest
- Perceived or actual security
- Pavement quality
- Shading
- Land use: net residential density & retail floor area ratio
Evaluating AccessibilityAccessibility is a key indicator of a high quality, efficient, and sustainable multimodal transportation system. As explained by Miller (2018): “The primary role of a transportation system is to provide people and businesses with access to other people and businesses so that they can physically engage in spatially and temporally distributed activities of all kinds (social, economic, etc.), and so that they can physically exchange information, goods and services” (p. 551). In the past few decades, the rapid expansion of the internet has added another important dimension to this topic.Accessibility is commonly defined in relation to opportunities for spatial interactions (Hansen, 1959). It is a composite measure of the relationship between the service provided by the transportation system and the socioeconomic activities associated with land use across different scales. The transportation component of accessibility consists of travel distance on a network, the generalized monetary cost of travel, and the corresponding impedance between an origin and a destination. The land use component of accessibility consists of the number of destinations, the characteristics and demand for activities, and the competition effects among multiple destinations (Geurs & van Eck, 2001).Accessibility is generally measured based on the number of destinations that can be reached in a given travel time. Those destinations that take longer to reach are considered less accessible. It follows, therefore, that accessibility can be improved through land use strategies that locate destinations closer together and through transportation strategies that make them quicker and easier to access. Improving accessibility requires not only an efficient transportation system, but also plans and policies that facilitate destinations with a mix of land uses, housing, and services.For multimodal planning, accessibility is increasingly preferred for evaluating system performance. The traditional reliance on measures, like roadway level of service, has led to a focus on road widening as the primary solution to transportation problems. Accessibility instruments can evaluate a broader range of important considerations, such as network connectivity, connections between modes, affordability, equity, and proximity of land uses (Litman, 2022). Attention to these and other accessibility issues results in a systems-oriented approach to multimodal planning with integrated land use and transportation strategies.Accessibility MeasuresMany methods have been proposed for measuring accessibility. Accessibility measures can be classified into six categories: infrastructure measures, contour measures, activity measures, competition measures, time-space measures, and utility measures. These can be defined as follows:
- Infrastructure measure: an extension of the Hansen index with a focus on travel time. The Hansen index (1959) was the first accessibility measure to apply the gravity model to evaluate the relationship between transportation and land use.
- Contour measure: counts opportunities within a threshold of travel cost based on a selected location.
- Activity measure: comprehensively incorporates travel time and land use components.
- Competition measure: addresses the capacity constraint at each destination that individuals compete over for access.
- Utility measure: describes the individually perceived utility of different travel choices.
- Time-space measure: quantifies opportunities within predetermined time constraints and is well suited for sequential events and spatially clustered activities.
Several reviews have compared the strengths and weaknesses of these different accessibility measures (Bhat et al., 2000; Curtis & Scheurer, 2010; Geurs & van Eck, 2001; Geurs & van Wee, 2004; van Wee et al., 2001). For example, the contour measure is easiest to calculate and counts the number of opportunities reachable within a given level of travel impedance from a given location. Yet this and other conventional accessibility measures fail to account for competition among people targeting the same resources. The relative attractiveness of an area is determined by both the number of jobs within reach and the amount of competition for these jobs (van Wee et al., 2001).The gravity model is a widely used method for estimating accessibility in transportation planning, such as Manuel Santana Palacios and Ahmed El-geneidy’s work in 2022 . To better understand this approach, see https://findingspress.org/article/32444-cumulative-versus-gravity-based-accessibility-measures-which-one-to-use.Another consideration is that individuals all have a travel time budget and activity chain. The time-space measure accounts for this by quantifying opportunities for activity participation open to an individual under a given set of location, time, and speed constraints. It results in a defined activity space that is denoted as a potential path area (Wu & Miller, 2001). The utility measure relates to consumer surpluses in economics and considers the relative economic advantages of access to activities in an area. The utility measure and time-space measure are both individual-level accessibility measurements that can incorporate many socioeconomic factors.Planning ApplicationsAccessibility instruments support multimodal transportation planning analysis by informing practitioners on “the accessibility of land uses by different modes of transport at various geographical scales” (Papa et al., 2015, p. 57). With appropriate empirical evidence, accessibility instruments have been included as the core index for planning support systems. Such systems help decide location activities, manage the use of a particular travel mode, ensure access to opportunity for underserved populations, ensure community cohesion, and stimulate economic development (Papa et al., 2015).The Washington State Department of Transportation (WSDOT), for example, uses accessibility metrics and CUBE Access, an ArcGIS modelling tool, for planning support to identify multimodal mobility problems and opportunities for improvement. Examples of planning applications of accessibility instruments by WSDOT include evaluating multimodal accessibility around train stations, understanding the link between environmental justice and health, scoring and rating access to destinations for different travel methods, and identifying demand response gaps for the Human Services Transportation Plan (Washington State Department of Transportation, n.d.). For more information, see the WSDOT Multimodal Accessibility website at https://wsdot.wa.gov/engineering-standards/planning-guidance/multimodal-accessibility.Case Example: I-95 Corridor Mobility Planning ProjectThe I-95 Corridor Mobility Planning Project in Southeast Florida exemplifies the use of performance measures to monitor progress related to regional multimodal planning goals and objectives (see figure 8. 2). The project was initiated to address growing congestion on 1-95 through a regional, system-oriented, and integrated approach to transportation and land use planning that involves numerous local governments, agencies, and other stakeholders. The planning framework balances traditional mobility objectives, like maintaining roadway levels of service, with other objectives, like providing walkable urban, mixed-use centers. An integrated vision of the multimodal system was adopted that identifies place types in relation to corridors, together with performance measures to quantify progress and implementation strategies.
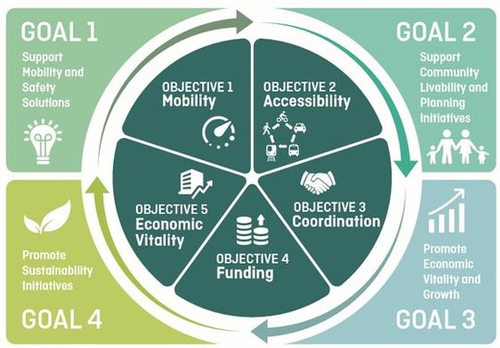
Figure 8. 2. I-95 Corridor Mobility Planning Project goals and objectives.
Twenty-six performance measures were initially established through collaboration to illustrate current conditions and measure progress toward achieving the aspirational future vision (FDOT District 4, 2017). The performance measures vary for primary highway corridors and multimodal districts and are listed below. Simple illustrations and values on a performance dashboard depict each measure so condition and progress can be easily understood by decision makers and the public. The performance measures are as follows:
- Traffic Volume
- Vehicle Miles of Travel
- VMT per Capita
- Greenhouse Gas Emissions
- Daily Truck Volume
- I-95 Interchange Volumes
- Average Travel Speed
- Percent of Travel Severely Congested
- Hours of Travel Severely Congested
- Percent Travel Meeting Level of Service Criteria
- Travel Time Reliability
- Freight Travel Time Reliability
- Person Throughput
- Cargo Volume – Airport and Seaport
- Passenger Volume – Airport and Seaport
- Commute Mode Share
- Average Travel Time to Work
- Employment Density
- Population Density
- Transit Ridership
- Percent Transit Coverage
- Sidewalk Coverage
- Bike Lane/Shoulder Coverage
- Bicycle and Pedestrian Safety
- Property Values
- Transportation Funding
New integrated and system-oriented “capstone” performance measures are also being developed to better report on multimodal system performance in a given study area. The capstone measures are “Multimodal Accessibility (MMA),” which quantifies the propensity to travel between origins and destinations by travel mode, and “Multimodal System Productivity (MSP),” which addresses the productivity of travel based on the origins, destinations, and travel times between origins and destinations, as well as travel paths and travel times along each network segment (FDOT District 4, 2019). As summarized in the technical report (FDOT District 4, 2019):MMA and MSP performance can be increased either with land use-oriented proximity strategies such as higher intensity and mixed-use development, or with mobility strategies such as widening a road to improve travel speeds or increasing the frequency of transit services. Which strategies to apply depends on the desired balance among goals in a given context. For the CMPP, proximity strategies align with multimodal nodes and districts along multimodal facilities, whereas roadway mobility strategies are better suited for commercial areas along commerce facilities. (p. 4.)*
Key Takeaways
Monitoring and measuring system performance is critical to understanding how well a multimodal system is performing in relation to planning goals and objectives. In recent years, there has been a growing emphasis on the use of performance measures in planning to evaluate transportation system performance based on adopted goals and objectives. Federal transportation law now requires agencies to engage in performance-based planning to ensure that transportation investments are properly managed. The performance areas noted in federal law seek to improve performance in the areas of safety, transit asset management, pavement and bridge performance, and system performance. State and regional transportation agencies must set targets for each performance measure establish by the federal government and demonstrate how they are achieving those targets.
Multimodal plans go beyond the traditional objectives of improving roadway safety and mobility, to address a variety of social, economic, and environmental goals and objectives. To do so, requires different performance measures and evaluation methods than have traditionally been used. For example, level of service measures used to evaluate the transportation system now go beyond roadway level of service to consider transit, bicycle, and pedestrian modes. Modal quality and level of service (LOS) analysis is used to evaluate how well the system is performing in terms of delay, convenience, comfort, and security of transportation facilities and services.
Accessibility is another key indicator of a high quality, efficient, and sustainable multimodal transportation system. For multimodal planning, accessibility is increasingly preferred as a measure of system performance. The traditional reliance on measures, like roadway level of service, has led to a focus on road widening as the primary solution to transportation problems. Accessibility instruments can evaluate a broader range of important considerations, such as network connectivity, connections between modes, affordability, equity, and proximity of land uses. Accessibility instruments can support integrated land use and transportation planning by providing explicit information regarding the accessibility of land uses via different travel modes at various geographical scales.
*
Self Test
*GlossaryActivity chain: Sequenced tours with different trip purposes, tracked by location and time.Asset management: A strategic and systematic process of operating, maintaining, upgrading, and expanding physical assets of the transportation system effectively throughout their lifecycle.Gravity model: A model that calculates how the size and distance of places may increase or decrease interactions, or in transportation terms, the interchange of trips between zones.Impedance: The difficulty of getting from one place to another, as typically measured in travel time, distance, cost or some combination.Performance-based planning: The application of performance management within the planning and programming processes of transportation agencies to achieve desired performance outcomes for the multimodal transportation system.Performance measures (aka measures of effectiveness): Quantitative indicators for evaluating and monitoring how transportation projects and strategies are affecting system performance in relation to adopted goals, objectives, and policies.Planning support systems: Computer-based tools that use geographic information systems (GIS) and decision support functions to convert data into information useful for planning purposes.Travel time budget: The amount of time an individual is willing to travel in a given day or week.*ReferencesAlachua County. (2019). Comprehensive plan 2019-2040: Transportation mobility. https://growth-management.alachuacounty.us/CompPlan/TransportationBhat, C., Handy, S., Kockelman, K., Mahmassani, H., Chen, Q., & Weston, L. (2000). Development of an urban accessibility index: Literature review. (TX-01/7-4938-1). https://ctr.utexas.edu/wp-content/uploads/pubs/4938_4.pdfBotma, H. (1995). Method to determine level of service for bicycle paths and pedestrian-bicycle paths. Transportation Research Record, 1502, Article 1502.Brozen, M., Huff, H., Liggett, R., & Wang, R. (2014). September 2014 working paper. 79.Bullard, D., Christiansen, D. L., & Fitzgerald, A. V. (1981). Level-of-service concept: Applied to public transportation (UMTA-TX-81-10671F). Texas Transportation Institute. https://static.tti.tamu.edu/tti.tamu.edu/documents/1067-1F.pdfCurtis, C., & Scheurer, J. (2010). Planning for sustainable accessibility: Developing tools to aid discussion and decision-making. Progress in Planning, 74(2), 53–106. https://doi.org/10.1016/j.progress.2010.05.001Dixon, L. B. (1996). Bicycle and pedestrian level-of-service performance measures and standards for congestion management systems. Transportation Research Record, 1538(1), 1–9. https://doi.org/10.1177/0361198196153800101Ewing, R., & Handy, S. (2009). Measuring the unmeasurable: Urban design qualities related to walkability. Journal of Urban Design, 14(1), 65–84. https://doi.org/10.1080/13574800802451155FDOT District 4. (2017). Performance measures. I-95 Corridor Mobility Planning Project. http://www.i95corridormobility.com/measures.htmlFDOT District 4. (2019). Capstone performance measures: Background report. I-95 corridor mobility planning project.FHWA. (n.d.). Component 03: Performance-Based Planning. TPM Toolbox. Retrieved October 13, 2022, from https://www.tpmtools.org/guidebook/chapter-03/Frank, L. D., Sallis, J. F., Saelens, B. E., Leary, L., Cain, K., Conway, T. L., & Hess, P. M. (2010). The development of a walkability index: Application to the neighborhood quality of life study. British Journal of Sports Medicine, 44(13), 924–933. https://doi.org/10.1136/bjsm.2009.058701 %J British Journal of Sports MedicineGeurs, K. T., & van Eck, J. R. R. (2001). Accessibility measures: Review and applications. Evaluation of accessibility impacts of land-use transportation scenarios, and related social and economic impact [Report]. Universiteit Utrecht-URU. https://rivm.openrepository.com/handle/10029/259808Geurs, K. T., & van Wee, B. (2004). Accessibility evaluation of land-use and transport strategies: Review and research directions. Journal of Transport Geography, 12(2), 127–140. https://doi.org/10.1016/j.jtrangeo.2003.10.005Hansen, W.G., 1959. How accessibility shapes land use. Journal of the American Institute of planners 25(2), 73-76.Jensen, S. U. (2007). Pedestrian and bicyclist level of service on roadway segments. Transportation Research Record, 2031(1), 43–51. https://doi.org/10.3141/2031-06Kittelson & Associates, Inc. (2003). Transit capacity and quality of service manual (Vol. 42). Transportation Research Board.Litman, Todd. (2022). Evaluating Accessibility for Transport Planning. https://www.vtpi.org/access.pdfLo, R. H. (2009). Walkability: What is it? Journal of Urbanism: International Research on Placemaking and Urban Sustainability, 2(2), 145–166. https://doi.org/10.1080/17549170903092867Lowry, M. B., Callister, D., Gresham, M., & Moore, B. (2012). Assessment of communitywide bikeability with bicycle level of service. Transportation Research Record, 2314(1), 41–48. https://doi.org/10.3141/2314-06Miller, E. J. (2018). Accessibility: Measurement and application in transportation planning. Transport Reviews, 38(5), 551–555. https://doi.org/10.1080/01441647.2018.1492778Papa, E., Silva, C., te Brömmelstroet, M., & Hull, A. (2015). Accessibility instruments for planning practice: A review of European experiences. Journal of Transport and Land Use, 9(3). https://doi.org/10.5198/jtlu.2015.585Pasco County MPO. (2020). Pasco County, mobility 2045. http://mobilitypasco.com/wp-content/uploads/2020/08/MOBILITY-2045-LRTP-Final-Report.pdfPetritsch, T. A., Landis, B. W., Huang, H. F., McLeod, P. S., Lamb, D., Farah, W., & Guttenplan, M. (2007). Bicycle level of service for arterials. Transportation Research Record, 2031(1), 34–42. https://doi.org/10.3141/2031-05Strader, B. (2010). Planning urban roadway systems. ITE Webinar.Transportation Research Board. (2010). Highway capacity manual (Vol. 2).U.S. Department of Transportation. (n.d.). Transportation performance management (TPM) implementation plan. https://www.fhwa.dot.gov/tpm/plan.pdfU.S. Department of Transportation. (2013). Performance based planning and programming guidebook. https://www.transit.dot.gov/sites/fta.dot.gov/files/Performance_Based_Planning_and_Programming_Guidebook.pdfvan Wee, B., Hagoort, M., & Annema, J. A. (2001). Accessibility measures with competition. Journal of Transport Geography, 9(3), 199–208. https://doi.org/10.1016/S0966-6923(01)00010-2Victoria Transport Policy Institute. (2019a, March). Performance evaluation: Practical indicators for evaluating progress toward planning objectives. https://www.vtpi.org/tdm/tdm131.htmVictoria Transport Policy Institute. (2019b, September). Multi-modal level-of-service indicators: Tools for evaluating the quality of transport services and facilities. https://www.vtpi.org/tdm/tdm129.htmWashington State Department of Transportation. (n.d.). Multimodal accessibility. Retrieved June 8, 2022, from https://wsdot.wa.gov/engineering-standards/planning-guidance/multimodal-accessibilityWilliams, K., & Seggerman, K. (2014). Multimodal transportation best practices and model element. https://www.nctr.usf.edu/wp-content/uploads/2015/08/77954.pdfWu, Y.-H., & Miller, H. (2001). Computational tools for measuring space-time accessibility within dynamic flow transportation networks. Journal of Transportation & Statistics, 4(2/3), 1–14.
| Performance Measure | Target | 2018 Conditions | Mobility 2040 | Mobility 2045 | Result |
|---|---|---|---|---|---|
| % of major road network with bicycle facilities | Increase | 32% | Not reported | 62% | Increase |
| % of major road network with sidewalks | Increase | 26% | Not reported | 43% | Increase |
| % of major road network served by local bus routes | Increase | 23% | 52% | 36% | Increase |
| % of population within 1/4 mi of bus route | Increase | 28% | 42% | 31% | Increase |
| % of population within 1 mi of a multi-use trail | Increase | 55% | 84% | 90% | Increase |
| Level of Service (LOS) | Standard of Measure | ||||
| Pedestrian | B | Based on presence of a pedestrian facility | |||
| Bicycle | B | Based on presence of bike lanes/paved shoulders | |||
| Express Transit | B | Based on peak hour frequency of 15 minutes or less | |||
| Motor Vehicle* | D | Professionally accepted traffic analysis | |||
| *Guideline applies to collector and arterial roads | |||||
| LOS General Operating | Conditions | Speed (mph) | Flow (veh/hour/lane) | Density (veh/mile) | |
| A | Free flow, with low volumes and high speeds. | Over 60 | Under 700 | Under 12 | |
| B | Reasonably free flow, but speeds beginning to be restricted by traffic conditions. | 57-60 | 700-1,100 | 12-20 | |
| C | Stable flow, but most drivers are restricted in the freedom to select their own speeds. | 54-57 | 1,100-1,550 | 20-30 | |
| D | Approaching unstable flow; drivers have little freedom to select their own speeds. | 46-54 | 1,550-1,850 | 30-42 | |
| E | Unstable flow; may be short stoppages. | 30-46 | 1,850-2,000 | 42-67 | |
| F | Forced or breakdown flow; unacceptable congestion; stop-and-go. | Under 30 | Unstable | Over 67 | |
| General Performance Indicators | Effectiveness Measures | Efficiency Measures | |||
| Service area population | Service Supply | Cost Efficiency | |||
| Service area size | Vehicle miles per capita | Operating expense per capita | |||
| Passenger trips | Service Consumption | Operating expense per peak vehicle | |||
| Passenger miles | Passenger trips per capita | Operating expense per passenger trip | |||
| Vehicle miles | Passenger trips per mile | Operating expense per passenger mile | |||
| Revenue miles | Passenger trips per revenue hour | Operating expense per revenue mile | |||
| Vehicle hours | Average trip length | Operating expense per revenue hour | |||
| Revenue hours | Quality of Service | Maintenance expense per revenue mile | |||
| Route miles | Average speed | Maintenance expense per operating expense | |||
| Total operating expense | Average headway | Operating Ratios | |||
| Total maintenance expense | Average age of fleet | Farebox recovery | |||
| Total capital expense | Number of incidents | Local revenue per operating expense | |||
| Federal revenue | Number of vehicle system failures | Operating revenue per operating expense | |||
| State revenue | Revenue miles between failures | Vehicle Utilization | |||
| Local revenue | Availability | Vehicle miles per peak vehicle | |||
| Total employees | Revenue miles per route miles | Vehicle hours per peak vehicle | |||
| Transportation operating employee | Weekday span of service | Revenue miles per vehicle mile | |||
| Administrative employees | Route miles per square mile of service area | Revenue miles per (total) vehicle | |||
| Vehicle available in maximum service | Revenue hours per (total) vehicle | ||||
| Vehicle operated in maximum service | Labor Productivity | ||||
| Spare ratio | Revenue hours per employee | ||||
| Total gallons consumed | Passenger trips per employee | ||||
| Total energy consumed | Energy Utilization | ||||
| Vehicle miles per gallon | |||||
| Vehicle miles per kilowatt-hour | |||||
| Fare | |||||
| Average fare | |||||
The application of performance management within the planning and programming processes of transportation agencies to achieve desired performance outcomes for the multimodal transportation system.
A strategic and systematic process of operating, maintaining, upgrading, and expanding physical assets of the transportation system effectively throughout their lifecycle.
Quantitative indicators for evaluating and monitoring how transportation projects and strategies are affecting system performance in relation to adopted goals, objectives, and policies.
The difficulty of getting from one place to another, as typically measured in travel time, distance, cost or some combination.
A model that calculates how the size and distance of places may increase or decrease interactions, or in transportation terms, the interchange of trips between zones.
The amount of time an individual is willing to travel in a given day or week.
Sequenced tours with different trip purposes, tracked by location and time.
Computer-based tools that use geographic information systems (GIS) and decision support functions to convert data into information useful for planning purposes.
