9 Lean Operations
Chapter Table of Contents
Wastes
The word “lean” means skinny or having no fat. Lean operations have no waste. The types of wastes, also called muda, that lean operations can be referred to as TIM WOODS:
- T – Transport – Moving people, products & information
- I – Inventory – Storing parts, pieces, documentation ahead of requirements
- M – Motion – Bending, turning, reaching, lifting
- W – Waiting – For parts, information, instructions, equipment
- O – Over production – Making more than is IMMEDIATELY required
- O – Over processing – Tighter tolerances or higher grade materials than are necessary
- D – Defects – Rework, scrap, incorrect documentation
- S – Skills – Under utilizing capabilities, delegating tasks with inadequate training
The framework of lean operations focuses on the concepts of value, value stream, flow, pull, and perfection in order to reduce all of these types of waste.
Value is defined by the customer. An organization must have a clear definition of value as perceived by the customer. Time and money spent on features of a product or a service that the customer does not perceive have value are wasted time and money. Knowing what the customer values requires becoming close to the customer and constantly soliciting feedback.
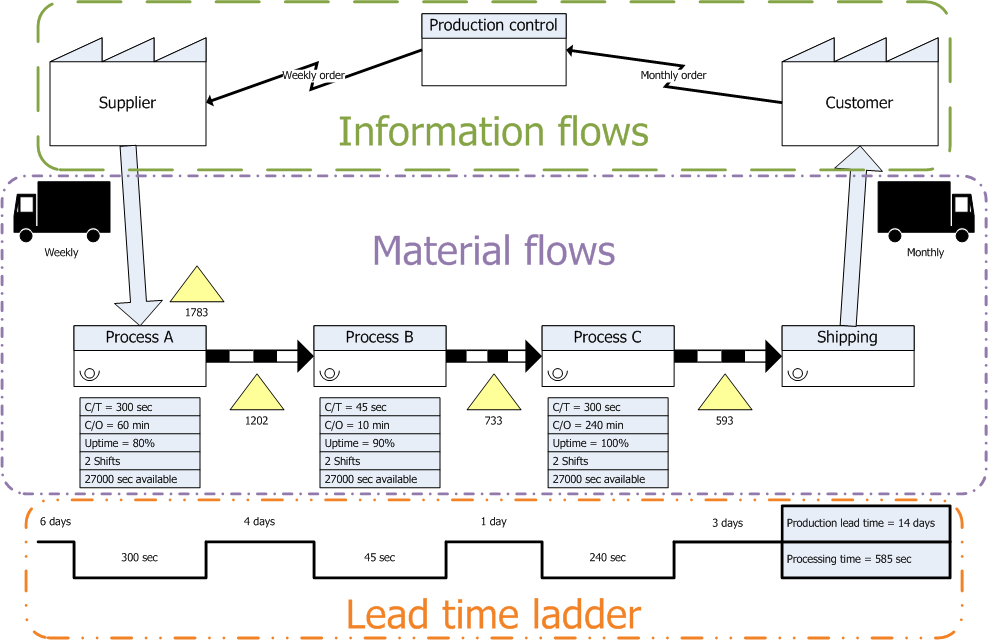
In lean operations, a process flow diagram is called a value stream map. The diagram is similar, but the reason for creating the diagram is to identify all the activities in a process and place them into one of the following categories.
- Value Added (VA) – activities that create value as perceived by the customer
- Non-Value Added (NVA)– activities which don’t create value as perceived by the customer and so should be eliminated immediately
- Essential Non-Value Added (ENVA) – activities that create no value but are company or regulatory policies and so can’t be eliminated just yet
The value stream mapping also identifies the time actually spent in adding value and the time the product spends in storage or transport. Time in storage or transport is waste and should be eliminated.
Continuous flow
Picture-Perfect Manufacturing, from MMS Online, describes how Stremel Manufacturing, in Minneapolis, Minnesota, used current state maps and future state maps to make sure that waste-reduction initiatives “improve the overall flow rather than merely optimize individual steps.”
In continuous flow, a product never waits but flows continuously through the manufacturing system, thus eliminating time in storage and in transport. Batches and queues should be eliminated. If products move through the production systems in batches, then the first item in a batch must wait until the last item in a batch is completed before it moves to the next processing time; batches mean product spends time waiting, and that time is waste. The presence of queues mean that a product was completed at a previous processing step before the next step was ready for more input. Since the final step of the production process is shipping the product to customers, product should be produced at the rate that meets the market demand. The principle can be applied in the production of services also.
One barrier to flow and one reason for using batches is the time necessary to switch the production facility from producing one kind of product to producing another, which is referred to as setup. Setup Reduction: At the Heart of Lean Manufacturing, also from MMS Online, describes how Richards Industries, a manufacturer of specialty valves in Cincinnati, Ohio, reduced its setup times from an average of 50 minutes to 27 minutes. This reduction enabled them to reduce the typical batch size from 200 to about 20 to 30.
Flow can be improved by eliminating bottlenecks as shown by the following example from World War II as described by in Methods of Operations Research [1].
An operations research worker during his first day of assignment to a new field command noticed that there was considerable delay caused by the soldiers having to wait in line to wash and rinse their mess kits after eating. There were four tubs, two for washing and two for rinsing. The operations research worker noticed that on the average it took three times as long for the soldier to wash his kit as it did for him to rinse it. He suggested that, instead of there being two tubs for washing and two for rinsing, there should be three tubs for washing and one for rinsing. This change was made, and the line of waiting soldiers did not merely diminish in size; on most days no waiting line ever formed.
A bottleneck is the narrowest part of a bottle and limits the flow in or out of the bottle. In the original situation with only two tubs for washing, the lines in front of those tubs would have been long, indicating that the wash tubs were the bottleneck, that is, the place in the production process with the least capacity. If washing took three minutes and rinsing took one minute, two wash tubs can serve 40 soldiers per hour while two rinse tubs can serve 120 soldiers per hour. With the new configuration, three wash tubs can serve 60 soldiers per hour, the same service rate as one rinse tub.
Bottlenecks can be identified by looking for places where WIP (Work in Progress) piles up and create queues. The processing rate at a bottleneck can be increased by reducing the time to process one item or by adding more processing capability. As a bottleneck’s rate is improved, WIP in front of the bottleneck will disappear, but another bottleneck may now appear.
Pull and Continuous Improvement
In a lean system, no product or service is produced until a customer asks for it, that is, product is pulled not pushed through the system. Some product must be maintained in sales places to meet immediate demand, but reduction in lead time through improvements such as daily deliveries reduces the amount of stock kept on hand and allows more variety in stock.
Lean systems constantly seek perfection by working to continuously improve. An organization should not compete against its competitors. If benchmarking shows the company is doing better than its competitors, it should not relax. As Womack and Jones state in their preeminent book on lean operations, Lean Thinking [2], state:
To hell with your competitors; compete against perfection by identifying all activities that are muda and eliminating them.
- Morse, P., & Kimball, G. (1951). Methods of operations research (1st ed., rev.). Cambridge: Published jointly by the Technology Press of Massachusetts Institute of Technology, and Wiley, New York. ↵
- Jones, D. T., & Womack, J. P. (2014). Lean thinking: Banish waste and create wealth in your corporation. Place of publication not identified: Free Press. ↵
