11 Dissemination
11.1 Introduction
The final step in the research process is to report your findings.1 This chapter covers the dissemination of research studies using secondary data from national health surveys. It includes details on how to disseminate results by abstracts, presentations, and original research manuscripts. This chapter builds on previous curricula designed to train medical students2 and physician assistant students3 in research methods. The previous curricula materials have been modified and enhanced for researchers focused on disseminated results from secondary data analysis.
11.2 Abstracts
Abstracts are brief summaries (typically 150-350 words) of preliminary findings or completed research projects. Abstracts are included at the beginning of most research manuscripts to inform the reader of the purpose, methods, most important findings, and implications of the research study. However, prior to being written to accompany manuscripts, abstracts can be written and submitted to professional organizations in calls for presentations during scientific sessions at professional meetings. Abstracts are usually structured like manuscripts using the following four sections: 1) introduction; 2) methods; 3) results; and 4) discussion (IMRAD).4 The IMRAD structure aligns with the processes of scientific discovery and health research. The health research process includes identifying a study question (introduction), selecting the study approach, designing the study and collecting data (methods), analyzing data (results), and reporting findings (discussion).1 However, some abstracts are unstructured without headings. Both formats include the same basic information about the research study. For abstracts using secondary data, it is important to include the source of the data as well as the years of data analyzed. Abstract guidelines for different professional meetings vary by organization. These guidelines should be provided with the call for abstracts shared on each professional meeting’s website. An overview of some guidelines for public health research conferences that accept abstracts for studies using secondary data from national health surveys is provided in Table 11.1.
Table 11.1. Sample abstract requirements for professional meetings accepting abstracts for research using secondary data from national health surveys for presentations
| blank cell | Academy Health | American Public Health Association | Gerontological Society of America |
|---|---|---|---|
| Word limit | 500 | 250 | 250 |
| Headings | Research Objective Study Design Population Studied Principal Findings Conclusions Implications for Policy or Practice |
Background Methods Results Conclusions |
None |
| Additional Requirements | None | At least 1 learning objective | At least 1 learning objective |
| *Note. This table has been adapted and updated from Table 11.1: Abstract requirements for common professional meetings in Kindratt & Kitzman-Ulrich’s (2014) chapter on dissemination in Gimpel & Mokuria (eds.) Community Action Research in Family Medicine Residencies: A Community Medicine Handbook.5 |
|||
Abstracts accepted for conference presentation are usually published on the organizations’ website as part of the program for the meeting. Some professional organizations partner with journals to publish abstracts is supplementary issues of their journals. For example, the Gerontological Society of America publishes abstracts from the previous year in a supplemental issue of Innovation in Aging. Examples of both primary and secondary research abstracts presented at professional meetings and published in journals by this textbook’s primary author are provided in Table 11.2. Several primary studies were led and disseminated by students and residents.
Table 11.2. Examples of abstract publications6-9 after presentation at professional meetings
| Conference | Authors & Year | Title | Journal |
|---|---|---|---|
| 2021 Gerontological Society of America Annual Scientific Meeting | Kindratt et al., 20216 | ADRD Caregiving Experiences and Health by Race, Ethnicity and Care Recipient Geographic Context | Innovation in Aging |
| 2020 Academy Health Annual Research Meeting | Kindratt et al., 20207 | Cognitive disability among Arab Americans by nativity status: lack of evidence for the healthy migrant effect | Health Services Research |
| 2019 Gerontological Society of America Annual Scientific Meeting | Dallo & Kindratt, 20198 | The epidemiology of Alzheimer’s disease and related dementias among Arab Americans. | Innovation in Aging |
| 2018 Food & Nutrition Conference & Expo | Xiao et al., 20189 | Teaching mobile health technology. | Journal of the Academy of Nutrition and Dietetics |
11.3 Presentations
Part of the scientific process is to disseminate research by poster and oral presentation at professional scientific meetings prior to publication in peer reviewed journals. Poster presentations are often used for preliminary findings and oral presentations highlight the results from completed research studies. By presenting at professional scientific meetings, researchers are able to obtain feedback on their research methods and make changes as needed. Researchers may also network and learn about similar research studies being conducted that they may not know about because the results have not been published yet. A brief overview of poster and oral presentations with examples are provided in this section. Some details are also provided on the impact of the COVID-19 pandemic on presentations at professional scientific meetings.
11.3.1 Poster Presentations
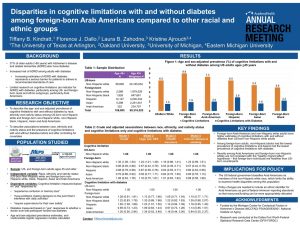
Poster presentation sessions have been utilized at professional meetings in the US since the 1970s.11 Poster presentations are a useful way for students to present their research findings in a way that is usually considered to be less stressful than a formal oral presentation in front of an audience. Poster presentations are often created as one slide using Microsoft PowerPoint. Most posters are large (3ft x 4ft) and landscape format. An example is provided in Figure 11.1.
Figure 11.1. Landscape poster example from 2021 Academy Health Annual Research Meeting
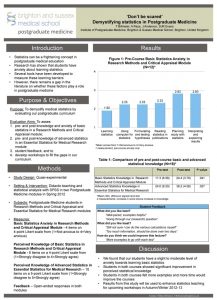
It may be more common for conferences overseas to have posters presented in a vertical format. An example of a poster presentation from a conference in England is provided in Figure 11.2.
Figure 11.2. Vertical poster example from 2012 Association for the Study of Medical Education (ASME) Conference in Brighton, England
Some benefits of a poster presentation are that research findings can reach a larger audience and it may be easier to engage in a conversation and network with professional contacts. Poster presentations also allow the audience member to view multiple points of entry.10 The audience member may view the title and go straight to the results section before having to view the introduction or methods of the presentation. An effective poster presentation is a condensed version of a full research abstract and may also be referred to as an illustrated abstract.9 It should include all IMRAD sections as well an acknowledgment of the funding source (if applicable) and contact information for the principal investigator so that the viewer may contact them after the presentation. Additional tips on creating poster presentations include:
- the less text the better
- use a specific title related to the research aim (see Figure 11.1), or title that tries to catch the audience’s attention (see Figure 11.2)
- use bright colors
- use pictures to portray a specific intervention or population of interest, particularly if conducting primary research with students or community members.
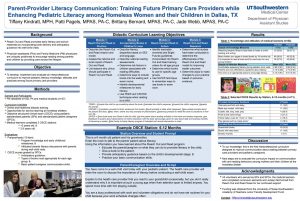
A photo release form is recommended if using pictures. An example of a poster presentation with pictures of physician assistant students and community member participants is provided in Figure 11.3.
Figure 11.3. Poster example using pictures of student and community member participants
11.3.2 Oral Presentations
An oral or platform presentation allows the researcher to practice sharing their research findings in a formal presentation. Oral presentations at professional meetings typically range from 10-20 minutes with 5-10 minutes at the end designated for audience members to ask questions. Oral presentations are usually created using Microsoft PowerPoint slides or slides from a similar program. Slides should emphasize key points to engage with the audience. Similar to poster presentations, the oral presentation should include a combination of bulleted text, figures, tables and pictures. It is sometimes recommended that researchers create a poster presentation first and then transfer the information from each section to a new set of slides for the oral presentation. A good rule of thumb is to include 1 slide per minute of each presentation. Slides should use basic text and a large font of size 28 or larger for visual accessibility. The presenter should use the slides as a guide but not just read directly off each slide while presenting. Animations and transition slides can be used; however, they may be distracting and difficult for individuals with seeing disabilities. Since the short timeframe of oral presentations may not all allow the investigator to include all of the details of the research study, presenters may be interested in including some supplemental slides at the end in case the audience asks questions about any content that was not covered in the presentation.10
11.3.3 Virtual and Online Presentations
In March 2020, stay-at-home orders and safety precautions due to the COVID-19 pandemic forced most professional meetings to be virtual using online platforms, including social media (e.g. twitter presentations), video conferencing (e.g. Zoom), and other software systems.11 Some presentations were required to be given live while others were pre-recorded and posted to YouTube or a meeting portal. There are several benefits and limitations to hosting virtual conferences.12 Some of the benefits include the ability to reach a wider international audience and allow those who may not have the funding or other ability to attend in-person meetings due to obligations at home. Some of the limitations include technical issues while presenting, such as issues with lighting, webcams, and inconsistent internet access.12 While presenting in virtual panel sessions, at least one or more of the presenters may have technical difficulties. Virtual conferences may also limit the ability of the presenter to fully engage in the presentation. For example, the presenter may have children at home due to school closures or have other work obligations that they may not have been required to attend if they were at an in-person meeting. Virtual conference attendance may allow some individuals greater comfort in networking activities while others may be more comfortable networking with their peers in-person. Regardless of a researcher’s preference for in-person, virtual, or hybrid presentation formats, virtual poster and oral presentations allow researchers to share their work in additional accessible ways which will most likely continue to be offered as a mode of dissemination beyond the COVID-19 pandemic.11,12
11.4 Manuscripts
The final step in the research process is to write and submit a manuscript for peer-reviewed publication. The publication process is completed after conducting poster and oral presentations so that any feedback obtained can be incorporated into the final manuscript. Writing manuscripts using the scientific method is a teachable skill. Scientific writing is formulaic, comprising of short and concise simple sentences. Five principles of scientific writing include: 1) clarity; 2) simplicity; 3) conciseness; 4) exactness, and 5) authenticity.2,3 Once the principal investigator decides on the journal to submit to, the manuscript should be tailored to that journal. Journals should provide instructions for authors on their specific formatting that should be followed before submission, including word count limits. Original research articles allow for word counts ranging from 2,000 to 5,000 words. Brief reports can limit word counts from 1,000 to 2,500 words. Letters to the editor are even shorter and may be limited to 500 words. Review articles are usually longer to allow for a comprehensive assessment of all research addressing the topic of interest in the study.
11.4.1 Manuscript Sections
Manuscripts usually start with a brief abstract and then are usually structured using the following four sections: 1) introduction; 2) methods; 3) results; and 4) discussion (IMRAD).4 As mentioned in the section on abstracts, this IMRAD structure aligns with the processes of scientific discovery and health research, which includes identifying a study question (introduction), selecting the study approach, designing the study and collecting data (methods), analyzing data (results), and reporting findings (discussion).1
Online platforms for journals allow for including supplemental material to complement these sections. However, not all journals follow this format. For example, in the journal Innovation in Aging, the methods section is replaced with “materials and methods.” Each section usually requires subheadings to structure the material for the reader. These subheadings may be required by the journal but are usually designated by the authors. For example, the introduction may include a subheading for “literature review.” The results may include subheadings for “selected characteristics” or “bivariate analysis.” Finally, the discussion may include a subheading for “strengths and limitations” or “conclusions.”
When writing research manuscripts, authors can benefit from the use of writing checklists. These checklists are sometimes required by journals. An example is the Strengthening the Reporting of Observational Studies in Epidemiology (STROBE) checklist which is used for writing observational studies.13 The Consolidated Standards of Reporting Trial (CONSORT) statement provides guidance for reporting randomized clinical trials.14 The Preferred Reporting Items for Systematic Reviews and Meta-Analyses (PRISMA) statement is used for systematically and accurately reporting reviews.15
11.4.1.a Abstract
As mentioned earlier in this chapter, the abstract provides a brief summary of the article. There is a need to ensure consistency with the information in the abstract and the text of the manuscript.4 The abstract can be the most important part of the research article because it is the first thing that readers will view prior to accessing and reading full articles. While some full-text articles require fees or library access to obtain, abstracts are available on the internet free to all readers. Abstracts may be written before the final manuscript as an outline for what to include in the formal paper. Another strategy is to write the abstract after completing the paper so that the writer can rephrase key points from the completed manuscript that may be the most impactful to potential readers.
11.4.1.b Introduction
The introduction starts the manuscript. A common framework used for developing an introduction section for research projects using data from national health surveys is an inverted pyramid or funnel approach (see Figure 11.4). The funnel approach allows the writer to describe the importance and rationale of the study from a broad perspective and then narrow it down to its specific aims.16 With this approach, the introduction is separated into five sections that can be combined into 3 paragraphs or left separate depending on the article type (e.g., original research or brief report) and the variables of interest. The five sections include: 1) morbidity, mortality, and health services use context; 2) social determinants of health; 3) identification of exposure; 4) gap in the literature; and 5) specific aims of the study.
Figure 11.4. Overview of introduction section funnel outline for writing manuscripts using national health surveys
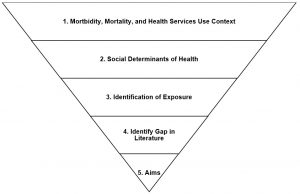
The first paragraph of the introduction should provide the broad context of the outcome. Its purpose is to contextualize the dependent variable or outcome. A question that the writer might address could be: “what is the morbidity and/or mortality of the disease and outcome under investigation?” Let’s uses Alzheimer’s disease and related dementias (ADRD) as the outcome. The writer may want to start the introduction by highlighting the burden of ADRD in the United States (over 6 million individuals), including the costs for treatment (over $350 million per year).17 The second paragraph for many public health research studies focuses on social determinants of health. This paragraph starts to narrow down the context of the outcome by including details on the health disparities that exist as they relate to race, ethnicity, sex, gender, age or other social determinants of health. If ADRD is still our example, we may want to include studies that demonstrate differences in the prevalence of ADRD among non-Hispanic Black individuals compared to non-Hispanic White individuals. The third paragraph focuses on the exposure, or independent variable. It includes details on the exposure that is being investigated and what research has already been conducted on the relationship between the exposure and outcome. For studies looking at social determinants of health as an exposure, this may be combined with the previous paragraph. For example, if we look at racial and ethnic disparities in the prevalence of ADRD, we may want to go further and determine whether differences exist among foreign-born and US-born racial and ethnic minority groups since previous studies indicate that foreign-born individuals tend to have better health outcomes than their US-born counterparts. The fourth paragraph identifies the gap in the literature on the relation between the exposure and the outcome. The fifth paragraph outlines the specific aims or objectives of the study. This may also include the research questions or hypotheses depending on the project and journal requirements.
11.4.1.c Methods
The methods section should include the details of how the study was conducted and why the study was conducted in a particular fashion. It should be written in past tense since the methods have already been conducted.18 The choice of active or passive voice when writing is dependent on where the paper is submitted. The methods section should provide enough detail that anyone who wanted to replicate the study could do so. This is particularly important when writing manuscripts using public-use data because any researcher could download the data and run the same analysis but yield different results. When writing articles using large data sources, it is recommended that there are specific subsections to describe the data source, participants, variables, statistical analysis, and institutional review board (IRB) approval process. It is recommended that the writer writes the answers to these questions delineated for each section in paragraph form.
Data Source
When reporting the results of a research study using national data, it is important to identify the national health survey that was used in the study. The years that were combined or specific data files (e.g., sample adult file for NHIS data or longitudinal file for MEPS data) should also be reported. Since the details of each survey have already been published on the survey website, this section should only include brief details on the history and purpose of the national health survey. The reader should also be referred to the website for more details and citations should be included for other studies that may have used the same methodology to create the sample with this data source. For example, Dallo and Kindratt used restricted NHIS data for several studies using the country of birth data from the NHIS. The original manuscript published included more details on the data sources and methods used19 and the later studies20,21 included a reference to the original study published. The level of details requested about the national health survey used is dependent on the peer reviewers and editor.
Participants
Based on the sampling frame, it is important to include the total number of participants who completed the national health survey used in the study. This section should include the details describing how the sample was limited based predetermined inclusion and exclusion criteria. The total number of unweighted participants that meet the inclusion and exclusion criteria should be included. It may also be beneficial to the reader if the total number of individuals that the unweighted sample represents when weighted is included.
Variables
The variables (or measures) section should include details on the questions used in your analysis to meet your study aims. This section may include subsections for independent variables (exposures or predictors), dependent variables (disease or outcomes), and covariates (including confounders, mediators, and other explanatory factors) selected for inclusion in the statistical analysis. Each section should include a description of the questions collected by the national health survey to gather data on each variable and ways that the investigator has changed the variable by combining it with other questions or removing missing responses. If applicable, these sections should include references to previous studies that have served as the basis for recoding variables or adjusting for specific covariates (e.g. confounders, other contributing factors) during the statistical analysis. As many details about the survey questions and response options should be included in this section in order to alleviate the readers concerns about potential information biases or concerns about internal validity.
Statistical Analysis
The statistical analysis section should include details on what analyses were conducted to meet the research aims. This section should include: 1) basic descriptive statistical procedures, such as frequencies, percentages, means and standard deviations; 2) comparative (or bivariate) statistical procedures, such as t-tests or chi square tests; and 3) inferential statistical procedures, such as regression analyses. Specific information about the weighting, stratification, and primary sampling units used for national health surveys should be included. It is common to cite the analytic guidelines for each specific national health survey in this section, specifically if changes have been made to these variables. The specific analytical software should be included to ensure that the proper procedures were used to account for the complex sample design.
Ethical Approval
Most scientific journals require a section or at least one sentence on ethical approval. The secondary analysis of public-use data is not considered human subjects research because the data extracted for analysis cannot be identified by the researcher. However, some universities require that research using public-use data from national health surveys go through a formal review process. These studies are often deemed as the “exempt” classification.
11.4.1.d Results
The results section is the “heart,” or most important section of the paper.22 It highlights the researchers’ contribution to the scientific literature and overall general knowledge in the public health field. The results section should directly align with the objectives and hypotheses presented in the introduction, the methods outlined to meet those objectives in the methods section, and a comparison to other studies in the discussion section. Every research question in the introduction section should have a delineated method and related result. The results section should only present the main findings but not interpret them in the context of other literature.23
The results section includes a mixture of tables (figures, if applicable) and text. It should include all findings obtained while conducting the research study. At least one paragraph should be included for each table presented and tables should be referred to in the text. It may be useful to use headings that are similar to the table titles to direct the reader between the tables and text. Depending on the journal the article is being submitted to, authors may be requested to include a placeholder (e.g., insert table 1 here) in the document that is submitted for review. Results should be presented using at least two tables describing 1) the demographics of the sample and 2) the main analytic results. Tables should be presented by increasing complexity of the analysis (first demographics, second bivariate analysis, last multivariate analysis) and present large amounts of data in one place.22,23 Each table should be able to stand alone with specific titles and footnotes to describe its contents.
Table 1
The first table usually provides demographic information about the sample. It may be presented with basic frequencies and percentages or including bivariate statistics that compare two groups. Key findings from table 1 should be included in written form in the text. Instead of including all of the results from the tables in the text, the author may want to only highlight statistically significant or clinically relevant results in the text. Examples of potential tables shells are provided below.
Table 11.3.a. Table shell representing how to present basic sample characteristics
| blank cell |
Unweighted N (%) |
Weighted N (%) |
|---|---|---|
| Race, Ethnicity and Nativity | ||
| US-Born Non-Hispanic Whites | ||
| Foreign-born Non-Hispanic Whites | ||
| Foreign-born Arab Americans | ||
| Sex | ||
| Male | ||
| Female |
Table 11.3.b. Table shell representing ways to present bivariate analyses using sample characteristics
| blank cell | Flu Vaccine Last 12 months | blank cell | |
|---|---|---|---|
|
No |
Yes |
p-value | |
| Race, Ethnicity and Nativity | |||
| US-Born Non-Hispanic Whites | |||
| Foreign-born Non-Hispanic Whites | |||
| Foreign-born Arab Americans | |||
| Sex | |||
| Male | |||
| Female | |||
Tables 2+
Table 2 and further tables include more complex statistical analysis. Since many national health surveys use cross-sectional designs, prevalence estimates may be calculated. Journal reviewers may be interested in seeing prevalence estimates reported in an adjusted analysis, such as the age- and sex- adjusted prevalence. These results are obtained by calculating predicted marginals using a LS MEANS statement with the regression analyses. Results may be presented in a table similar to Table 11.3.c, which demonstrates differences in age- and sex-adjusted prevalence estimates of cognitive health outcomes by race, ethnicity, and nativity status.
Table 11.3.c. Table shell for age- and sex-adjusted prevalence estimates
| blank cell | US-Born | Foreign-Born | |
|---|---|---|---|
| Alzheimer’s disease and related dementias (ADRD) | |||
| ADRD with comorbid diabetes | |||
| ADRD with comorbid hypertension | |||
Regression models may also be used for determining associations between the independent and dependent variables of interest before and after adjusting for covariates. Logistic, linear, multinomial, binomial, cox, Poisson, or other regression models may be presented. The explanations of each of these regressions models is beyond the scope of this textbook. An example table shell that may be used for logistic regression results is presented in Table 11.3.d.
Table 11.3.d. Table shell for logistic regression results
| blank cell | Model 1 Crude OR (95% CI) |
Model 2 |
Model 3 Fully Adjusted OR (95% CI) |
|---|---|---|---|
| Race, Ethnicity and Nativity | |||
| US-Born Non-Hispanic Whites | |||
| Foreign-born Non-Hispanic Whites | |||
| Foreign-born Arab Americans | |||
| *Include details of variables adjusted in footnotes underneath | |||
Sensitivity Analysis
The methods and results sections may include details on a sensitivity analysis. Sensitivity analyses are used to determine whether a different model or set of assumptions will yield similar results.24 For example, in research evaluating foreign-born Arab Americans using NHIS data, studies by Dallo and colleagues have used data from foreign-born individuals born in the Middle East to represent the Arab ethnicity.25,26 Recent efforts to separate Arab Americans from non-Hispanic Whites in the US have recommended creating an inclusive racial/ethnic category for Middle Eastern and North African (MENA) populations.27 Kindratt and colleagues expanded the formerly used Middle Eastern category to include non-Hispanic White Africans to represent MENA individuals in a study evaluating cognitive limitations.28 A sensitivity analysis was conducted to compare results from using the new MENA variable with results from using the Middle East only variable using logistic regression models. The odds ratios and 95% confidence intervals were overlapping, which indicated that the results were similar.28 Results from a sensitivity analysis are sometimes included in the manuscript or included as supplementary material due to limitations on word count and the number of tables or figures allowed to be included with the text.
11.4.1.e Discussion
The purpose of the discussion section is to interpret the findings and provide meaning to the results in the context of the other medical literature. The discussion section should mirror the introduction section as a pyramid or reverse funnel (See Figure 11.5). Instead of starting off with the broad context and ending with a specific purpose and objectives, the discussion section starts off with specific results and expands to include the broader context throughout the section. With this approach, the discussion section is separated into four sections that can be expanded to five or more paragraphs depending on the article type (e.g., original research or brief report) and the exposures and outcomes of interest. The five sections include: 1) summary of the purpose and main findings; 2) comparison of results to existing literature; 3) strengths and limitations; and 4) conclusions and implications.
Figure 11.5. Overview of discussion section pyramid outline for writing manuscripts using national health surveys
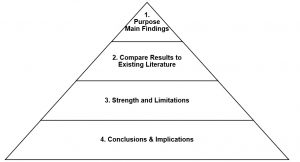
The first paragraph of the discussion should restate the purpose of the study then briefly summarize the main findings. The implications of the main findings should be expanded on in the next section. The second section of the discussion should include a paragraph for each of the most relevant findings with references to compare and contrast the results with other studies. This section should include reasons why the results may be the same or different from other literature. The third section of the discussion should acknowledge the strengths and limitations of the study. For example, some strengths of studies using national health surveys may be that the sample was selected using a probability-based sample design versus a convenience sample. A strength may also be a large sample size. National health surveys also have many different content areas that allow for a broad assessment of other potential contributing factors related to the research question. Despite these strengths, there will also be limitations that need to be noted. For example, some limitations may include that the survey uses a cross-sectional design and causation cannot be established. Since the independent and dependent variables were measured at the same time, there may be no way of determining whether the independent variable (exposure) causes the dependent variable (disease/outcome). There may also be information biases with self-reported data. For example, a limitation of self-reported data for cancer screenings is that the data may overrepresent or underrepresent screening estimates. Self-reported data may not be as accurate as other measures such as electronic medical records. The final paragraph of the discussion section is a conclusion. The conclusion should discuss the generalizability of the results and the impact the findings may have on potential interventions and policies. The manuscript should end with the “take home message” from the research and provide future directions and recommendations.
11.5 Writing Tips and Tricks
Here are some writing tips and tricks that may be useful.
- Start with the results section, then write the methods section. You may want to create your tables or figures first, then write 1-2 sentences about them.23 By creating the tables and writing the results first, the introduction and discussion sections can be framed around the key findings.
- Select a similar article to use as a model for writing. If there is already an article published with the same dataset in the journal you plan to submit to, use it as a model for structuring your paper.
- If you wrote a grant proposal or IRB protocol, use the same information to start writing your paper. The proposals were probably written in future tense (e.g., “we will analyze” or “the data will be analyzed”) so change it to past tense (e.g., “we analyzed” or “the data were analyzed”).
- If you are unclear whether someone from the team qualifies as an author, check to see if they meet the ICJME guidelines on authorship.4 If you have co-authors, make sure they are contributing to the manuscript and you are not doing everything yourself.
- Use a referencing software like Endnote or Zotero to manage your in-text citations and references at the end of the paper.
- When all else fails, hand write your manuscript on a piece of paper – not type it.
11.6 Summary
In summary, this chapter provided an in-depth overview of disseminating research by presentation and publication. Dissemination is the final step in the research process and is essential when conducting research using national health surveys. Several examples have been provided to demonstrate different types of presentations created and sections of manuscripts written by the primary author of this textbook.
11.7 References
- Jacobsen KH. Introduction to Health Research Methods: A Practical Guide. 3rd ed. Jones & Bartlett Learning; 2021.
- Dehaven MJ, Gimpel NE, Dallo FJ, Billmeier TM. Reaching the underserved through community-based participatory research and service learning: description and evaluation of a unique medical student training program. J Public Health Manag Pract. 2011;17(4):363-368. doi:10.1097/PHH.0b013e3182214707
- Kindratt TB. Research Extension Experience in Directed Studies: Solidifying Evidence-Based Medicine Competencies Through Research Participation. J Physician Assist Educ. 2020;31(1):36-41. doi:10.1097/JPA.0000000000000291
- International Committee of Medical Journal Editors. Recommendations for the Conduct, Reporting, Editing, and Publication of Scholarly Work in Medical Journals. Accessed December 8, 2020. http://www.icmje.org/recommendations/
- Kindratt T, Kitzman-Ulrich H. Dissemination: Reporting and writing. In: Community Action Research in Family Medicine Residencies: A Community Medicine Handbook. University of Texas Southwestern Medical Center Print Shop; 2014:133-150.
- Kindratt T, Sylvers D, Yoshikawa A, Anuarbe ML, Webster N, Bouldin E. ADRD Caregiving Experiences and Health by Race, Ethnicity and Care Recipient Geographic Context. Innov Aging. 2021;5(Suppl 1):990. doi:10.1093/geroni/igab046.3557
- Kindratt TB, Dallo FJ, Zahodne LB. Cognitive Disability Among Arab Americans By Nativity Status: Lack of Evidence for the Healthy Migrant Effect. Health Services Research. 2020;55(S1):21-21. doi:10.1111/1475-6773.13352
- Dallo F, Kindratt T. The epidemiology of Alzheimer’s disease and related dementias among Arab Americans. Innov Aging. 2019;3(Suppl 1):S463. doi:10.1093/geroni/igz038.1731
- Xiao C, Kindratt T, Rodder S. Teaching Mobile Health Technology. J Acad Nutr Diet. 2018;118(9 Supplement):A34. doi:10.1016/j.jand.2018.06.138
- Hess GR, Tosney KW, Liegel LH. Creating effective poster presentations: AMEE Guide no. 40. Med Teach. 2009;31(4):319-321. doi:10.1080/01421590902825131
- Price M. Scientists discover upsides of virtual meetings. Science. 2020;368(6490):457-458. doi:10.1126/science.368.6490.457
- Rubinger L, Gazendam A, Ekhtiari S, et al. Maximizing virtual meetings and conferences: a review of best practices. Int Orthop. 2020;44(8):1461-1466. doi:10.1007/s00264-020-04615-9
- Vandenbroucke JP, Elm E von, Altman DG, et al. Strengthening the Reporting of Observational Studies in Epidemiology (STROBE): Explanation and Elaboration. PLOS Medicine. 2007;4(10):e297. doi:10.1371/journal.pmed.0040297
- Schulz KF, Altman DG, Moher D, CONSORT Group. CONSORT 2010 statement: updated guidelines for reporting parallel group randomised trials. PLoS Med. 2010;7(3):e1000251. doi:10.1371/journal.pmed.1000251
- Page MJ, McKenzie JE, Bossuyt PM, et al. The PRISMA 2020 statement: an updated guideline for reporting systematic reviews. BMJ. 2021;372:n71. doi:10.1136/bmj.n71
- Bahadoran Z, Jeddi S, Mirmiran P, Ghasemi A. The Principles of Biomedical Scientific Writing: Introduction. Int J Endocrinol Metab. 2018;16(4):e84795. doi:10.5812/ijem.84795
- Alzheimer’s Association. 2021 Alzheimer’s Disease Facts and Figures. Alzheimer’s Association; 2021:108. Accessed April 15, 2021. https://www.alz.org/media/Documents/alzheimers-facts-and-figures.pdf
- Ghasemi A, Bahadoran Z, Zadeh-Vakili A, Montazeri SA, Hosseinpanah F. The Principles of Biomedical Scientific Writing: Materials and Methods. Int J Endocrinol Metab. 2019;17(1):e88155. doi:10.5812/ijem.88155
- Dallo FJ, Kindratt TB. Disparities in preventive health behaviors among non-Hispanic White men: heterogeneity among foreign-born Arab and European Americans. Am J Mens Health. 2015;9(2):124-131. doi:10.1177/1557988314532285
- Dallo FJ, Kindratt TB. Disparities in Chronic Disease Prevalence Among Non-Hispanic Whites: Heterogeneity Among Foreign-Born Arab and European Americans. J Racial Ethn Health Disparities. 2016;3(4):590-598. doi:10.1007/s40615-015-0178-8
- Kindratt TB, Dallo FJ, Roddy J. Cigarette Smoking among US- and Foreign-Born European and Arab American Non-Hispanic White Men and Women. J Racial Ethn Health Disparities. 2018;5(6):1284-1292. doi:10.1007/s40615-018-0476-z
- Bahadoran Z, Mirmiran P, Zadeh-Vakili A, Hosseinpanah F, Ghasemi A. The Principles of Biomedical Scientific Writing: Results. Int J Endocrinol Metab. 2019;17(2):e92113. doi:10.5812/ijem.92113
- Iskander JK, Wolicki SB, Leeb RT, Siegel PZ. Successful Scientific Writing and Publishing: A Step-by-Step Approach. Prev Chronic Dis. 2018;15:E79. doi:10.5888/pcd15.180085
- Szklo M, Nieto FJ. Epidemiology: Beyond the Basics. 3rd ed. Jones & Bartlett Learning; 2014.
- Dallo FJ, Kindratt TB, Snell T. Serious psychological distress among non-Hispanic whites in the United States: the importance of nativity status and region of birth. Soc Psychiatry Psychiatr Epidemiol. 2013;48(12):1923-1930. doi:10.1007/s00127-013-0703-1
- Dallo FJ, Kindratt TB, Zahodne L. Prevalence of Self-Reported Cognitive Impairment among Arab American Immigrants in the United States. Innovation in Aging. 2020;(igaa058). doi:10.1093/geroni/igaa058
- Awad GH, Abuelezam NN, Ajrouch KJ, Stiffler MJ. Lack of Arab or Middle Eastern and North African Health Data Undermines Assessment of Health Disparities. Am J Public Health. 2022;112(2):209-212. doi:10.2105/AJPH.2021.306590
- Kindratt TB, Dallo FJ, Zahodne LB, Ajrouch KJ. Cognitive Limitations Among Middle Eastern and North African Immigrants. J Aging Health. Published online May 23, 2022:8982643221103712. doi:10.1177/08982643221103712
