6 National Health Interview Survey
6.1 Introduction
Chapter 6 covers the National Health Interview Survey (NHIS). The NHIS has been collected by the National Center for Health Statistics (NCHS) since 1957 to monitor and explore trends in the health status and health care utilization among the US population.1 This chapter includes details on: how data are collected; how data are made publicly available as machine-actionable data files; what variables must be included to address design features of the complex sample; the strengths and limitations of the survey; and practical tips for conducting statistical analysis; and how to answer research questions using a case study. The practical tips provided for analysis of NHIS data are based on the primary author’s previous experiences analyzing NHIS data from 2000-2018 to answer questions related examining the associations between predisposing and enabling factors that contribute to health behaviors, morbidity, mortality and health services use. The NHIS case study will explore whether Arab American adults are more or less likely to receive an annual flu vaccine in comparison to other racial/ethnic groups, such as other non-Hispanic Whites. The bulk of this chapter will comprise of section 6.6: NHIS Case Study in order to give the reader hands-on practice downloading and cleaning large databases and conducting basic categorical data analysis using PROC SURVEYFREQ and PROC SURVEYLOGISTIC. The syntax provided was created for use with SAS 9.4.
6.2 Data Collection
The NHIS uses a cross-sectional study design to collect face-to-face household interviews from the US civilian, non-institutionalized population to produce national health estimates. The sample design excludes individuals living in correctional facilities (e.g. prisons), long-term care institutions (e.g. nursing homes), military personnel, and US nationals living overseas.1 The sample design is modified every ten years after the decennial census.1 Prior to 2016, the NHIS used a multi-stage area probability design. The sample was drawn from over 400 primary sampling units (PSU) (counties, small groups of counties, or metropolitan statistical areas) covering all 50 states and Washington, D.C. Within each PSU, addresses were sampled and underrepresented minority groups (non-Hispanic Black, Hispanic, and non-Hispanic Asian) were oversampled. In 2016, the NHIS sample design was modified to provide more robust estimates for state-level analysis. The multi-stage process was removed and over 300 clusters located within the boundaries of each state were used as sampling units.1 Instead of oversampling racial and ethnic minority groups, the new design oversamples certain populations within each state to increase sample sizes among less populous states.2 Sample sizes have been increased in the 10 least populous states and Washington D.C. and decreased in the 40 most populous states.2 In 2019, a redesigned version of the NHIS was implemented to reduce response burden for participants, improve coverage of health topics, streamline overlapping content with other national health surveys, develop a long-term plan for periodic and ongoing topics, and incorporate new methodologies.2,3 Data for 2019 were not available as of this writing. Further details of the NHIS sampling design and data collection methods are reported on the NHIS website.4
6.3 Data Files
The NHIS is comprised of two main components: 1) core questions that are consistently collected on an annual basis and 2) an assortment of supplements sponsored by other agencies outside of NCHS, such as National Heart, Lung, and Blood Institute, Center for Tobacco Products, and National Center for Environmental Health. Core questionnaire sections include the family core (which includes the household composition and person level file), sample adult core and sample child core. In 2018, supplemental questions focused on food security, health care access and utilization among families, asthma, occupational health, cancer screening, functioning and disability (including cognitive disability), immunizations, e-cigarettes and other tobacco use, heart disease and stroke among adults, and asthma and immunizations among children.1
6.3.1 Household File
One adult member of each household provides responses to the household composition section of the NHIS questionnaire. The participant provides relationship information and demographics of all members of the household to determine the number of families in each housing unit.1 Each household has a unique identifier, represented by variable HHX, which is used for merging data files within and across years. The household data file includes questions assessing the type of living quarters (e.g. house, apartment, mobile home), number of families, number of persons, and the US region (Northeast, Midwest, South, West) where the household is located.1
6.3.2 Family File
One adult member of each family within each household is identified to answer questions about adult and child members of the family. Any adults within the household not designated as the “family respondent” can respond for themselves.1 Each family is defined by groups of two or more related persons living in the same household or unrelated individuals living together, such as unmarried couples.1 Each family has a unique identifier, represented by variable FMX, which is used for merging data files within and across years. The family data file includes topics such as telephone use (landline, cell phones), family type and structure, family member disabilities, family level income, health insurance, and government assistant programs (e.g. Women’s, Infants and Children [WIC]).
6.3.3 Person File
Person level data are collected as part of the family core component for each household. Person level data are collected from all adults and children in the household. Each person has a unique identifier (variable name: PX years 2000-2003; FPX years 2004 onward) which is used for merging data files within and across years. The person level data file includes topics such as demographics, socioeconomics, health status, limitations of activity, health care access and utilization, health insurance and English language proficiency. Race and ethnicity are collected in accordance with the 1997 Office of Management and Budget standards.5
6.3.4 Sample Adult
One adult per family is randomly selected as a sample adult. There is an increased likelihood of being selected if the adult is non-Hispanic Black, non-Hispanic Asian, Hispanic, or ages 65 years or older. The sample adult responds to questions about their own health for this section. If the participant is not mentally or physically able to do so, questions about their health will be asked to a proxy.1 Individuals represented as the sample adult in each household are identified in the person level file with a “flag” (variable: ASTATFLG). The sample adult file includes individual-level topics such as demographics, socioeconomics, adult health conditions, adult health status and activity limitations, health behaviors, health care access and utilization, and additional selected items. Additional selected items cover a wide range of health and social determinants of health topics such as frequency of computer use, satisfaction with health care received, perceived neighborhood social cohesion, sexual orientation and HIV testing.
6.3.5 Sample Child
One child per family is randomly selected as a sample child. Information about the sample child is collected from an adult in the family that has the most knowledge about the child’s health.1 Individuals represented as the sample child in the household are identified in the person level file with a “flag” (variable: CSTATFLG). The sample child file includes topics such as child health conditions, limitations of activity, health status, child health care access and utilization, child mental health, and child influenza vaccination.
6.4 Strengths and Limitations
A strength of the NHIS is the ability to evaluate health characteristics by many different sociodemographic characteristics.1 Limitations of the NHIS include an inability to calculate reliable statewide estimates. Statewide estimates can only be calculated using data from restricted data centers. All data collected are cross-sectional and self-reported. Although this is seen as a limitation, in the context of preventive health services research, previous studies have demonstrated that self-reported receipt of mammograms for early detection of breast cancer and other preventive health services are consistent with reports from medical providers and electronic medical records.
6.5 Design Features
Data analysts must use special procedures to account for the complex sample design used by the NHIS. Analytic procedures must include variables to adjust for the clustering, stratification, and weighting of each data file. Each time the NHIS sample design has been modified, the clustering and stratification variables were renamed. An overview of the NHIS clustering and stratification variables from 2000 through 2018 are provided in Table 6.1.
Table 6.1. Overview of complex sample design variables across NHIS data collection years
| Survey Years | Clustering | Stratification |
|---|---|---|
| 2000-2005 | PSU | STRATUM |
| 2006-2015 | PSU_P | STRAT_P |
| 2016-2018 | PPSU | PSTRAT |
Interim and annual weights are provided for each file. The final annual weights are used to provide population estimates. An overview of final annual weight variables for each file type are provided in Table 6.2.
Table 6.2. Overview of NHIS final annual weight variables for each file type
| Household | Family | Person | Sample Adult | Sample Child |
|---|---|---|---|---|
| WTFA_HH | WTFA_FAM | WTFA | WTFA_SA | WTFA_SC |
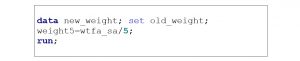
When combining multiple years of NHIS data, you must divide the total annual weight by the total number of years in the merge prior to conducting their statistical analysis. For example, if combining data from sample adults from 2014-2018, WTFA_SA should be divided by 5. An example of how to do this in SAS 9.4 is provided in Box 6.1.
Box 6.1. SAS program to create new weight variable for five years of NHIS data
6.6 NHIS Case Study
Previous studies have demonstrated that Arab Americans are less likely than US-born Whites to receive preventive services, including influenza vaccines. Previous research using NHIS data has demonstrated that Arab American women were 66% less likely (OR=0.34; 95% CI=0.21-0.58) and Arab American men were 62% less likely (OR=0.38; 95% CI=0.21-0.67) to receive a flu vaccine when compared to their US-born non-Hispanic White counterparts.6,7 These studies used restricted 2000-2011 NHIS data and created a variable for foreign-born Arab Americans. The Arab American ethnicity group was limited to foreign-born adults who were born in 15 countries that belong to the Arab League of Nations geographically located in the Middle East. In this case study, we will determine whether the results are similar using public-use 2018 NHIS data. Arab Americans will be defined as any adult who identified as self-reporting a White race, non-Hispanic or Latino/a ethnicity, and was born in a country in the Middle East region based on previous studies by the primary author and others.8-13
6.6.1 Specific Aims
- Aim 6.1: Compare sociodemographic and health related characteristics of Arab Americans compared to US-born Whites and foreign-born non-Hispanic Whites from Europe (including Russia and Former USSR).
- Aim 6.2: Determine associations between region of birth and flu vaccine uptake among Arab Americans compared to US-born Whites and foreign-born non-Hispanic Whites from Europe.
6.6.2 Methods
Complete the following steps to download, clean, recode, and analyze NHIS data to answer the specific aims.
Step 1: Download Person and Sample Adult datasets and SAS programming files
The association between region of birth and flu vaccine uptake can be examined using data from the NHIS person and sample adult level files.
- Go to the 2018 NHIS data release website
- Click (+) next to “Data Files”
- Under Person File, click on “ASCII data” and save to computer. A zip file will be downloaded which contains the person file. Open the zip file and save the data file to a permanent location on your computer. It is recommended that you create a folder on the ‘C Drive’ labeled NHIS and separated by each year (e.g. “18” for “2018’) so that the location is consistent with the examples in this textbook.
- Under Person File, click on “Sample SAS Statements” and save the SAS programming statements in the same folder as the data files on your computer.
- Under Sample Adult File, click on “ASCII data” and save to your computer. A zip file will be downloaded which contains the sample adult file. Open the zip file and save the data file to a permanent location on your computer. Similar to the Sample Adult file, I recommend creating a folder on the ‘C Drive’ labeled NHIS and separated by each year (e.g. “18” for “2018’) so that the location is consistent with the examples in this textbook.
- Under Sample Adult File, click on “Sample SAS Statements” and save the SAS programming statements in the same folder as the data file.
Step 2: Run SAS programming statements to create library and input person and sample adult files
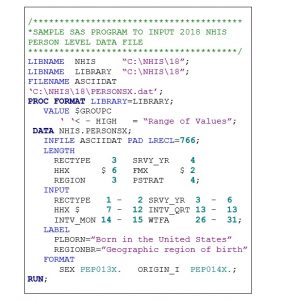
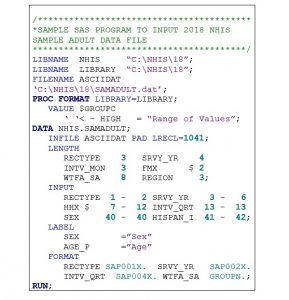
Sample SAS programs to create the libraries and input the 2018 person and sample adult files are in provided in Box 6.2 and Box 6.3, respectively. To create these programming statements, complete the following steps:
Person Level SAS Programming File
- Open the SAS Person Level Programming File
- Create a LIBNAME statement which houses the data and files associated with the analysis. It is recommended that you create the LIBNAME statement as the survey name (e.g. “NHIS”) and use the same location that the data files are saved in on the C drive (e.g. “C:\NHIS\18”)
- Create a FILENAME statement which lets SAS know where the data file is stored (e.g. ‘C:\NHIS\18\PERSONSX.dat’)
- Modify or remove any instructions (/*green text*/) that you do not need in the programming file.
- Highlight all programming statements and click RUN.
The full SAS program for the person file is available for download in the Chapter 6 folder, in the Open ICPSR data repository.
Box 6.2. SAS Program to input 2018 NHIS person file
Sample Adult SAS Programming File
- Open the SAS Sample Adult Level Programming File.
- Create a LIBNAME statement which houses the data and files associated with the analysis. It is recommended that you create the LIBNAME statement as the survey name (e.g. “NHIS”) and use the same location that the data files are saved in on the C drive (e.g. “C:\NHIS\18”).
- Create a FILENAME statement which lets SAS know where the data file is stored (e.g. ‘C:\NHIS\18\SAMADULT.dat’).
- Modify or remove any instructions (/*green text*/) that you do not need in the programming file.
- Highlight all programming statements and click RUN.
The full SAS program for the sample adult file is available for download in the Chapter 6 folder, in the Open ICPSR data repository.
Box 6.3. SAS Program to input 2018 NHIS Sample Adult file
Step 3: Combine Person Level and Sample Adult Data using MERGE statement
Once the data files have been input into SAS, the person and sample adult files must be combined. First, create a temporary file name for each file to indicate the type of data file and the year (e.g. person18 and samadult18). Second, sort each file by the household number (variable: HHX) and family number (variable: FMX) prior to merging. I also recommend using a KEEP statement to keep only the variables that you need for the analysis in your analytical dataset. Removing additional variables will allow the SAS program to run and present results faster. In this case study, I have kept the following variables (Table 6.3) to denote the survey design features and creation of the independent variable, dependent variable and selected covariates.
Table 6.3. Overview of variables used for NHIS case study
| File | Variable Name | Variable Description |
|---|---|---|
| Design Variables | ||
| Person and Sample Adult | SRVY_YR | Survey year |
| Person and Sample Adult | HHX | Household number |
| Person and Sample Adult | FMX | Family number |
| Person and Sample Adult | FPX | Person number |
| Sample Adult | WTFA_SA | Final annual weight |
| Sample Adult | PPSU | Primary sampling unit |
| Sample Adult | PSTRAT | Stratum |
| Independent Variable | ||
| Person | REGIONBR | Region of birth |
| Person | HISCODI3 | Race and ethnicity combined |
| Dependent Variable | ||
| Sample Adult | FLUVACYR | Flu vaccine in past 12 months |
| Covariates | ||
| Sample Adult | AGE_P | Age |
| Sample Adult | SEX | Sex |
| Person | EDUC1 | Highest level of education |
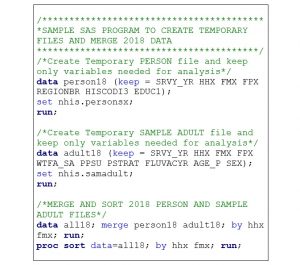
Third, merge and sort the combined dataset with only the variables from the person and sample adult files that are needed for analysis designed to meet your research aims. A sample SAS program for merging and sorting 2018 NHIS person and sample adult files is provided in Box 6.4.
Box 6.4. Sample SAS program to merge and sort NHIS person and sample adult data
Step 4: Recode and rename variables
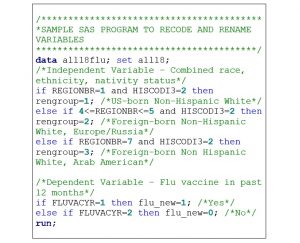
Questionnaire responses often need to be recoded or responses collapsed prior to conducting statistical analysis. For example, the NHIS has response options “7=Refused,” “8=Not ascertained,” and “9=Don’t know” for several questions. The responses are often removed and made “missing” prior to analysis. Furthermore, the numbers that represent certain values may need to be changed for easier interpretation of statistical analysis results. For example, NHIS has response options “1=Yes” and “2=No.” It is common practice to change “no” responses to 0, “0=No.” It is best practice to rename these recoded variables with a new variable name instead of replacing the original variable. Two or more variables may need to be combined in order to create the independent, dependent or other variables to answer study aims. In this case study, the variable created to make comparisons between US-born non-Hispanic Whites and foreign-born non-Hispanic Whites from Europe and the Middle East is created by combined two variables for 1) race and ethnicity and 2) region of birth. The variables recoded and renamed for analysis in this case study are provided in Table 6.4.
Table 6.4. Overview of NHIS variables recoded and renamed to meet research aims
| Question Description | Original Variable | Original Responses | Renamed Variable | Recoded Responses |
|---|---|---|---|---|
| Race and ethnicity | HISCODI3 | 1=Hispanic 2=Non-Hispanic White 3=Non-Hispanic Black 4=Non-Hispanic Asian 5-Non-Hispanic other races |
RENGROUP (represents race, ethnicity and nativity group) | 1=US-born non-Hispanic White 2=Foreign-born non-Hispanic White from Europe/Russia 3=Foreign-born non-Hispanic White from the Middle East (representing Arab Americans) |
| Region of birth | REGIONBR | 01=United States 02=Mexico, Central America, Caribbean Islands 03=South America 04=Europe 05-Russia (and former USSR) 06=Africa 07=Middle East 08=Indian Subcontinent 09=Asia 10=SE Asia 11=Elsewhere 99=Unknown |
||
| Flu vaccine, past 12 months | FLUVACYR | 1=Yes 2=No 7=Refused 8=Not ascertained 9=Don’t know |
FLU_NEW | 0=No 1=Yes |
Table 6.4 (continued) Overview of NHIS variables recoded and renamed to meet research aims
| Question Description | Original Variable |
Original Responses | Renamed Variable | Recoded Responses |
|---|---|---|---|---|
| Age | AGE_P | 18-84=18-84 years 85=85+ years |
AGE_NEW | 1=18-34 years 2=35-54 years 3=55-64 years 4=65+ years |
| Highest level of education | EDUC1 | 00=Never attended/ kindergarten only 01-12=1st through 12th grade, no diploma 13=GED or equivalent 14=High school (HS) graduate 15=Some college, no degree 16-17=Associate’s degree programs 18=Bachelor’s degree 19=Master’s degree 20-21=Doctorate 96=Child <5 97=Refused 98=Not ascertained 99=Don’t know |
EDUC_NEW | 1=Less than HS graduate 2=HS graduate/ GED 3=Some college/ Associate’s degree 4=Bachelor’s degree or higher |
A sample SAS program for recoding and renaming 2018 NHIS data for this case study is provided in Box 6.5.
Box 6.5. Sample SAS program to recode and rename NHIS variables
Step 5: Conduct Descriptive Statistical Analysis
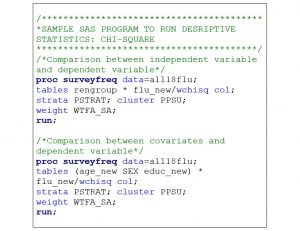
Once all variables are recoded, collapsed, and renamed they can be used for statistical analysis. Statistical analysis should always start with descriptive analysis to describe the data source. Chi square analyses should be conducted to make comparisons between the independent variable, covariates, and dependent variables. It is important to remember that all analysis of NHIS data needs to be conducted with SAS survey procedures due to the complex sample design. Weighting (variable: WTFA_SA), clustering (variable: PPSU) and stratification (variable: PSTRAT) variables must be included in the programming statements. A sample SAS program for conducting chi-square tests using 2018 NHIS data for this case study is provided in Box 6.6.
Box 6.6. Sample SAS program for running descriptive statistics (chi-square)
Step 6: Conduct Inferential Statistical Analysis
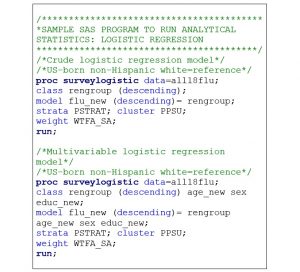
After calculating descriptive statistics, inferential statistical analysis can be conducted. Crude and multivariable logistic regression models can be calculated to determine associations between race, ethnicity, and nativity status and flu vaccine uptake among US- and foreign-born non-Hispanic Whites from Europe and the Middle East. Crude logistic regression models are used to determine the association between the independent and dependent variables without adjusting for other factors. Multivariable logistic regression models are used to determine associations between the independent and dependent variables after adjusting for potential covariates (e.g. age, sex, highest level of education). A reference category for the independent variable is needed. For this analysis, the reference group is US-born non-Hispanic Whites. Results from foreign-born non-Hispanic Whites from Europe and the Middle East are presented in comparison to US-born non-Hispanic Whites. A sample SAS program for conducting logistic regression analysis using 2018 NHIS data for this case study is provided in Box 6.7.
Box 6.7. Sample SAS program for running inferential statistics (logistic regression)
6.7 Summary
This chapter provided an overview of the NHIS and ways to conduct basic statistical analysis using 2018 public-use data files. The NHIS case study explored whether foreign-born Arab American adults were more or less likely to receive an annual flu vaccine in comparison to US-born non-Hispanic Whites. Sample SAS programming statements were provided for downloading and importing data files, merging data files, recoding and renaming variables and conduction categorical descriptive and inferential statistical analysis. The dataset and full SAS programming statements for the NHIS case study are available in the Chapter 6 folder, in the Open ICPSR data repository.
6.8 References
- National Center for Health Statistics. Survey Description, National Health Interview Survey, 2018.; 2019.
- Blewett LA, Dahlen HM, Spencer D, Rivera Drew JA, Lukanen E. Changes to the Design of the National Health Interview Survey to Support Enhanced Monitoring of Health Reform Impacts at the State Level. Am J Public Health. 2016;106(11):1961-1966. doi:10.2105/AJPH.2016.303430
- National Center for Health Statistics. NHIS – 2019 Questionnaire Redesign. Published November 27, 2019. Accessed September 2, 2020. https://www.cdc.gov/nchs/nhis/2019_quest_redesign.htm
- National Center for Health Statistics. National Health Interview Survey, 2018. Public-use data file and documentation. Published 2019. Accessed August 10, 2020. https://www.cdc.gov/nchs/nhis/data-questionnaires-documentation.htm
- Office of Management and Budget. Revisions to the Standards for the Classification of Federal Data on Race and Ethnicity. The White House. Published 1997. Accessed July 6, 2021. https://obamawhitehouse.archives.gov/omb/fedreg_1997standards
- Dallo FJ, Kindratt TB. Disparities in vaccinations and cancer screening among U.S.- and foreign-born Arab and European American non-Hispanic White women. Womens Health Issues. 2015;25(1):56-62. doi:10.1016/j.whi.2014.10.002
- Dallo FJ, Kindratt TB. Disparities in preventive health behaviors among non-Hispanic White men: heterogeneity among foreign-born Arab and European Americans. Am J Mens Health. 2015;9(2):124-131. doi:10.1177/1557988314532285
- Dallo FJ, Kindratt TB, Snell T. Serious psychological distress among non-Hispanic whites in the United States: the importance of nativity status and region of birth. Soc Psychiatry Psychiatr Epidemiol. 2013;48(12):1923-1930. doi:10.1007/s00127-013-0703-1
- Dallo FJ, Kindratt TB, Zahodne L. Prevalence of Self-Reported Cognitive Impairment among Arab American Immigrants in the United States. Innovation in Aging. 2020;(igaa058). doi:10.1093/geroni/igaa058
- Read JG, Amick B, Donato KM. Arab immigrants: a new case for ethnicity and health? Soc Sci Med. 2005;61(1):77-82. doi:10.1016/j.socscimed.2004.11.054
- Read JG, Reynolds MM. Gender differences in immigrant health: the case of Mexican and Middle Eastern immigrants. J Health Soc Behav. 2012;53(1):99-123. doi:10.1177/0022146511431267
- Reynolds MM, Chernenko A, Read JG. Region of origin diversity in immigrant health: Moving beyond the Mexican case. Soc Sci Med. 2016;166:102-109. doi:10.1016/j.socscimed.2016.07.018
- Blumberg SJ, Parker JD, Moyer BC. National Health Interview Survey, COVID-19, and Online Data Collection Platforms: Adaptations, Tradeoffs, and New Directions. Am J Public Health. 2021;111(12):2167-2175. doi:10.2105/AJPH.2021.306516
- Dallo FJ, Borrell LN. Self-reported diabetes and hypertension among Arab Americans in the United States. Ethn Dis. 2006;16(3):699-705.
- National Center for Health Statistics. National Health Interview Survey, 2020. Public-use data file and documentation. Published 2021. Accessed August 10, 2020. https://www.cdc.gov/nchs/nhis/data-questionnaires-documentation.htm
- NHIS – 2021 NHIS. Published February 8, 2022. Accessed June 28, 2022. https://www.cdc.gov/nchs/nhis/2021nhis.htm
- National Center for Health Statistics. Overview of Weighting and Analytic Options for the 2020 National Health Interview Survey. Published 2021. https://ftp.cdc.gov/pub/Health_Statistics/NCHS/Dataset_Documentation/NHIS/2020/weighting-analysis-reference-508.pdf
6.9 COVID-19 Pandemic Changes
Sections 6.1 to 6.8 were written during the initial waves of the COVID-19 pandemic. Since the NHIS is an in-person survey conducted at participants’ households, there were significant disruptions to the regular methodology due to stay-at-home orders and safety concerns for both participants and the NHIS field workers. With the declaration of a national emergency on March 13, 2020, changes were needed to adhere to essential work-based restrictions, collect data more effectively, and create survey content that could be used for evidence-based public health decision-making. This section will provide an overview of the data collection, survey content, and complex sample analytic changes due to disruptions by the COVID-19 pandemic.
6.9.1 Data Collection Changes
On March 19, 2020, data collection methods temporality switched to telephone only.14,15 Commercial address lists were used to locate telephone numbers for the addresses identified in the sampling frame. Telephone number from ~60% of households were obtained. Online searches were conducted to try to locate other numbers. With this change in methodology, the response rate lowered to 42% from April to June 2020 in comparison to 59% obtained from January to March 2020.14 NHIS data users may be surprised that online methodologies were not adopted. Instead of adjusting the household-based sampling frame to an internet modality, the NCHS utilized its Research and Development Survey (RANDS) and the US Census Bureau modified its Household Pulse Survey (HPS) to provide real-time data on COVID-19 for public health and policy decision-making.14
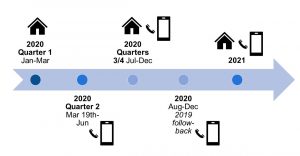
In 2020, there were four data collection methods used by the NHIS. During quarter 1 (January through March 15th), data were collected using the CAPI system at participants’ households. During quarter 2 (March 19th through June), surveys were collected by telephone. During quarters 3 and 4 (July through December), surveys were collected by telephone and in-person. To protect the safety of NHIS field workers and participants, an attempt was made to collect data from each household by telephone prior to conducting in-person interviews. If participants were not able to be reached by telephone, or if any recruitment or survey materials needed to be distributed, data were collected using in-person interviews. Safety precautions such as social distancing, masking, and collecting data outside were used to protect participants and NHIS field workers.14 From August through December 2020, efforts were made to improve response rates. A “follow-back” survey was conducted by telephone with the previous years’ adult participants. This method allowed for increasing the sample size but also allowed for comparisons to be made pre and post the initial waves of the pandemic. From January through April 2021, participants were surveyed first by telephone and only in-person as needed only if they were not available by phone. Beginning May 2021, field workers were allowed to collect data in-person after assessing their own personal health risks and community transmission levels. An overview of the 2020-2021 data collection timeline is provided in Figure 6.1.
Figure 6.1. NHIS data collection changes during COVID-19 pandemic
6.9.2 Survey Content Changes
The NHIS also made changes to the survey content to provide morbidity and health care services use data during the pandemic. In 2020, adults and children answered questions about COVID-19 diagnosis and testing. Participants were asked whether they delayed or skipped medical care or used telemedicine instead of in-person visits. Among adults only, questions were also added to determine changes and delays in cancer care and caregiving.14 Questions also assessed social distancing measures in the workplace and changes in social and emotional support needs in the last 12 months.14 In 2021, addition questions were added on COVID-19 vaccinations.16
6.9.3 Complex Sample Analytic Changes
The changes in the data collection procedures led to new potential non-response biases. Once the data collection shifted to telephone, participants who were ages 65 and older, had a bachelor’s degree level of education or higher, a family income greater than $75,000, owned a home, and resided in that home for 11 years or longer had higher response rates than other groups.15 Changes were made to the NHIS weighting process from previous years. Weights were already calibrated to the US Census population estimates for age, sex, race, ethnicity, education, and geographic areas. From April 2020 onward, weights were adjusted to account for housing tenure.14,16
The 2020 NHIS public-use data files are separated to account for the changes in the complex sample. The four data files include the: 1) sample adult interview; 2) sample adult longitudinal; 3) sample adult partial; and 4) sample child interview. The sample adult interview file includes all adults who provided data during 2020. The sample adult longitudinal file online includes the 2019 follow-back sample. The sample adult partial file does not include the 2019 follow-back participants. The sample child interview file is the only file for children. An overview of the weighting variables used for each of these files is provided in Table 6.5.
Table 6.5. Overview of 2020 NHIS final weight variables for each file type
| Sample Adult Interview | Sample Adult Longitudinal | Sample Adult Partial | Sample Child Interview |
|---|---|---|---|
| WTFA_A | WTFA_L | WTFA_P | WTFA_S |
Details of the 2021 NHIS weighting procedures are not available as of this writing. More information on changes to the NHIS data collection procedures due to the COVID-19 pandemic are available on the website.14,17
