7 Medical Expenditure Panel Survey
7.1 Introduction
Chapter 7 covers the Medical Expenditure Panel Survey (MEPS). The MEPS comprises a series of surveys from families, individuals, employers and medical providers that have been collected by the Agency for Healthcare Research and Quality (AHRQ) since 1996. The purpose of the MEPS is to estimate and monitor national trends in health care use, medical costs and health insurance coverage.1 This chapter includes details on: how data are collected; how data are made publicly available as machine-actionable data files; what variables must be included to address design features of the complex sample; the strengths and limitations of the survey; and practical tips for conducting statistical analysis; and how to answer research questions using a case study. The practical tips provided for analysis of MEPS data are based on the author’s previous experiences analyzing MEPS data from 2001-2017 to answer questions related to associations between predisposing and enabling factors that contribute to morbidity, mortality and health services use. The MEPS case study will explore whether adults who perceive their physician provided quality patient-provider communication (PPC) are more or less likely to receive an annual flu vaccine in comparison those who did not receive quality PPC. The bulk of the chapter will comprise of section 7.6: MEPS Case Study in order to give investigators hands-on practice downloading and cleaning large databases and conducting basic categorical data analysis using PROC SURVEYFREQ and PROC SURVEYLOGISTIC. The syntax provided was created for use with SAS 9.4.
7.2 Data Collection
The MEPS uses a longitudinal panel design collecting data from individuals and families from five rounds of interviews over a two-year period.2 Data can be compiled for cross-sectional analyses or longitudinal, retrospective cohort designs. A subsample of household participants who filled out the previous year’s National Health Interview Survey (NHIS) are selected for each panel. Oversampling of subgroups aligns with the NHIS nationally representative sample design.2 For example, non-Hispanic Blacks and Hispanics were oversampled until 2016. Non-Hispanic Asians were oversampled from 2006-2015. In 2016, the new NHIS design was modified to increase precision of statewide estimates and these changes were reflected in the MEPS beginning in 2017.3 Data for 2018 onward were not available as of this writing. Further details of the MEPS sampling design and data collection methods are reported elsewhere.4
7.3 Data Files
The MEPS is comprised of two main components: 1) household component and 2) medical provider component. Each component includes multiple subsections. The MEPS insurance component also collects health insurance plan offerings from employers in the US on an annual basis.5 Each annual household consolidated and medical condition file represents data from two panels. Each longitudinal file represents data from one panel over a two-year period. An overview of file names for household consolidated, medical condition, and longitudinal files from 2001-2018 by panel and year are provided in Table 7.1.
Table 7.1. Overview of 2001-2018 MEPS file names by year and panel
| Year | Panels | Household | Medical Condition | Longitudinal | Years | Panel |
|---|---|---|---|---|---|---|
|
2001 |
5/6 |
H60 |
H61 |
H65 |
2000-2001 |
5 |
|
2002 |
6/7 |
H70 |
H69 |
H71 |
2001-2002 |
6 |
|
2003 |
7/8 |
H79 |
H78 |
H80 |
2002-2003 |
7 |
|
2004 |
8/9 |
H89 |
H87 |
H86 |
2003-2004 |
8 |
|
2005 |
9/10 |
H97 |
H96 |
H98 |
2004-2005 |
9 |
|
2006 |
10/11 |
H105 |
H104 |
H106 |
2005-2006 |
10 |
|
2007 |
11/12 |
H113 |
H112 |
H114 |
2006-2007 |
11 |
|
2008 |
12/13 |
H121 |
H120 |
H122 |
2007-2008 |
12 |
|
2009 |
13/14 |
H129 |
H128 |
H130 |
2008-2009 |
13 |
|
2010 |
14/15 |
H138 |
H137 |
H139 |
2009-2010 |
14 |
|
2011 |
15/16 |
H147 |
H146 |
H148 |
2010-2011 |
15 |
|
2012 |
16/17 |
H155 |
H154 |
H156 |
2011-2012 |
16 |
|
2013 |
17/18 |
H163 |
H162 |
H164 |
2012-2013 |
17 |
|
2014 |
18/19 |
H171 |
H170 |
H172 |
2013-2014 |
18 |
|
2015 |
19/20 |
H181 |
H180 |
H183 |
2014-2015 |
19 |
|
2016 |
20/21 |
H192 |
H190 |
H193 |
2015-2016 |
20 |
|
2017 |
21/22 |
H201 |
H199 |
H202 |
2016-2017 |
21 |
|
2018 |
22/23 |
H209 |
H207 |
H210 |
2017-2018 |
22 |
7.3.1 Household Component
An adult reference person from each household is identified to answer questions about adults and child members of the family.2 The household component includes questions describing demographics (e.g. sex, age, race/ethnicity, education, marital status, nativity status, English language proficiency), income level, health insurance, access to health care, person-level health conditions (e.g. perceived health status and priority health conditions – such as diabetes, hypertension, cancer) preventive health services, limitations, and disabilities. MEPS also assesses personal characteristics of health care providers, including specialty type, race/ethnicity, and sex, which can be used for studies evaluating patient-provider concordance. Child special health care needs, behavioral problems, and preventive care received at doctors’ visits are also measured. Parents are also asked to answer questions on health care quality from the Consumer Assessment of Healthcare Providers and Systems (CAHPS©). Self-administered questionnaires (SAQ) are also collected on a periodic (2014 Preventive Care SAQ; 2016-2017 Cancer SAQ) and consistent annual (SAQ, Diabetes Care Survey) basis.2
7.3.1.a. Self-Administered Questionnaire (SAQ)
During rounds 2 and 4 of each panel, adult participants are asked to complete and mail back a paper-and-pencil SAQ which includes CAHPS© questions assessing health care quality received in the last 12 months. Sample questions include whether or not participants’ received care right away, were offered help filling out forms, and how they rate their health care (scale 0-10) with 0 representing the worst health care possible and 10 representing the best health care received. Additional questions assess general health (e.g. smoking status), health status, non-specific psychological distress, and depression.2
7.3.1.b. Diabetes Care Survey (DCS)
During rounds 3 and 5, adults who reported that they were ever told by a doctor or other health professional that they ever had diabetes receive an additional paper-and-pencil questionnaire to complete and mail back to AHRQ.2 The DCS asks questions on diabetes care treatment, monitoring, self-efficacy, and ways that individuals learn how to take care of their diabetes. For example, participants are asked whether their diabetes is being treated by diet modification, oral medication, and insulin injections. To evaluate diabetes care monitoring, participants are asked whether they have had their feet checked, eye exam, blood cholesterol checked, received a flu vaccine, and the number of times tested for hemoglobin A1c in the past year. To determine diabetes care self-efficacy, participants are asked to rate their confidence level in taking care of their diabetes from 1=not confident at all to 4=very confident.2
7.3.2 Medical Provider Component
After completion of household interviews, participants are asked to provide permission for their medical providers to be contacted to verify health information. Medical providers are contacted by telephone to confirm diagnostic and procedure codes, billing charges and payments, utilization (number of medical events) and dates of visits. From 2000-2016, International Classification of Diseases, Ninth Revision, Clinical Modification (ICD-9-CM) codes were assigned by professional coders based on household interview responses. From 2017 onward, coding transitioned to include International Classification of Diseases, Tenth Revision, Clinical Modification (ICD-10-CM) codes.6 Information on utilization (number of medical events), charges, and sources of payment are collected.2 Additional details on prescriptions medicines are collected as part of the pharmacy subcomponent, including medicine names, drug details and national drug codes.6
7.3.3 Longitudinal Files
The MEPS is unique to other national health surveys because it collects data from its participants five times over a two-year period, instead of one point in time. This allow users to determine changes over the two-year time period and offers fewer temporal biases that may occur when comparing exposures and outcomes during the same year.7
7.4. Strengths and Limitations
A strength of the MEPS is that the survey collects data from multiple sources (individuals, medical providers, employers) on a large number of health services topics not covered by other surveys, including use of medical services, charges/source of payments, provider satisfaction, patient-provider communication, provider characteristics, and care coordination.2 Other advantages include the ability to conduct longitudinal analysis with each panel and the use of cross-walk files to link to the previous year’s NHIS data. A limitation of the MEPS is that the samples sizes overlap for two years due to the survey panel design. This means that there is a much smaller sample size in comparison to other surveys. For example, the NHIS had 78,132 total respondents in 2017 whereas the MEPS had only 30,716 respondents.2,8 Although the MEPS collects information on a wide variety of physician characteristics, another limitation is the underrepresentation of physician assistants and nurse practitioners as advanced practice providers for workforce research. Limited information is collected on team-based practice and non-physician provider practices.9
7.5. Design Features
Data analysts must use special procedures to account for the complex sample design used by the MEPS. Researchers must include variables to adjust for the primary sampling units, clustering and weighting of each annual data files. MEPS provides a primary sampling unit and cluster variable for each year. Prior to 2002, MEPS included the data collection year in the variable name (VARPSU01, VARSTR01). Beginning in 2002, MEPS removed the data collection year from the variable name, which allows for a more streamlined approach when combining data across years. An overview of the primary sampling unit and cluster variables are provided in Table 7.2.
Table 7.2. Overview of complex sample design variables across MEPS data collection years
| MEPS Survey Years | MEPS Primary Sampling Unit | MEPS Cluster |
|---|---|---|
| 2001 | VARPSU01 | VARSTR01 |
| 2002-2018 | VARPSU | VARSTR |
For studies that combine data from 2001 with 2002 or later, researchers must change the variable name prior to combining the datasets. This can be done by using the RENAME statement. A sample SAS program for renaming variables is provided in Box 7.1.
Box 7.1. Rename variable prior to combining with additional years of MEPS data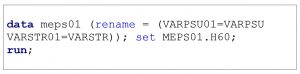
Several annual weights are provided for each file. The annual weights that include the year can be renamed prior to combining with additional years of data. The final person weight (e.g. PERWT17F) is used when analyzing general responses from the household consolidated and medical condition files. For research projects focused on questions gathering data directly from the SAQ (e.g. patient-provider communication quality), the self-administered questionnaire weight (e.g. SAQWT17F) should be used. For research projects focused on questions gathering data directly from individuals with diabetes (e.g. diabetes monitoring, self-efficacy), the final diabetes care supplement weight (e.g. DIABW17F) should be used. An overview of final annual weight variables for each file type for 2017 data are provided in Table 7.3.
Table 7.3. Overview of 2017 MEPS final annual weight variables for each file type
| Weight Type | Person | Medical Condition | Longitudinal |
|---|---|---|---|
| Final Person Weight | PERWT17F | PERWT17F | LONGWT |
| Final Self-Administered Questionnaire Weight | SAQWT17F | — | LSAQWT |
| Final Diabetes Care Supplement Weight | DIABW17F | — | — |
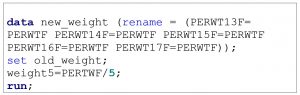
When combining multiple years of MEPS data, investigators must divide the total annual weight by the total number of years in the merge prior to conducting their statistical analysis. For example, if combining data from individuals from 2013-2017, all final person weight variables should be renamed and then divided by 5 in SAS. An example of this coding is provided in Box 7.2.
Box 7.2. SAS program to rename and create new weight variable for five years of MEPS data
7.6. MEPS Case Study
Previous studies have produced mixed results on associations between adults’ perceptions of the qualities of patient-provider communication (PPC) received and their likelihood of receiving preventive services. MEPS measures several PPC qualities, including adults’ perceptions of how often their health care providers “listened carefully to you,” “spent enough time with you,” and “explained things in a way that was easy to understand” in the last 12 months.1 Starting in 2011, MEPS included additional PPC qualities which focus on measuring health literate practices of health care providers. These questions include how often in the last 12 months health care providers “give instructions on what to do about as specific illness or health condition,” “how often these instructions were easy to understand” and whether the health care provider asked you “to describe how you were going to follow” their instructions.2
Kindratt and colleagues previous research has demonstrated that several qualities of PPC increased adults’ likelihood of receiving breast, cervical and colorectal cancer screenings.10–12 For example, using MEPS data, Kindratt and colleagues found that adults who reported their provider always gave specific instructions about what to do for their specific health conditions had higher odds of receiving breast (OR=1.19; 95% CI=1.06-1.33) and colorectal (OR=1.23; 95% CI=1.10-1.37) cancer screenings compared to those whose providers did not give specific instructions.10 When disaggregated by race and ethnicity, non-Hispanic Black and Hispanic adults who reported their providers’ exhibited all PPC qualities were more likely to receive colorectal cancer screenings compared to those who did not exhibit all qualities.12 A study by Villani & Mortensen evaluated whether adults who reported their health care provider always showed respect, involved them in decision-making, and explained all options were more or less likely to receive an influenza vaccine compared to adults whose providers’ did not exhibit these PPC qualities.13 They found no association between each PPC quality and adults’ likelihood of receiving a flu vaccine. More research evaluating other PPC qualities, such as health literate practices by providers (providing clear communication, practicing “teach-back” method), are needed to further explore this association. In this case study, we will determine the association between two PPC qualities and adults’ likelihood of receiving an influenza vaccine using 2015 and 2016 MEPS household consolidated data.
7.6.1 Specific Aims
- Aim 7.1: Compare sociodemographic and health-related characteristics of adults by influenza vaccine uptake
- Aim 7.2: Determine association between adults’ perceptions of PPC qualities and their likelihood of receiving an influenza vaccine before and after controlling for covariates
7.6.2 Methods
Complete the following steps to download, clean, recode and analyze MEPS data to answer the specific aims.
Step 1: Download Household Consolidated datasets and SAS programming files
The associations between PPC qualities and influenza vaccine uptake can be examined using data from the MEPS household consolidated data files.
- Go to the MEPS website for household full year consolidated data files.
- Click on “HC-181” for 2015 Full Year Consolidated Data File. Under “Data” and “File type***,” click on “ZIP” next to “Data File, ASCII format” and save the file to your computer. A zip file will be downloaded which contains the household consolidated file. Open the zip file and save the data file to a permanent location on your computer. I recommend creating a folder on the ‘C Drive’ labeled MEPS and separated by each year (e.g. “15” for “2015’) so that the location is consistent with the examples in this textbook.
- Under “Documentation” and “File Type,” click on “TXT” next to the label “SAS Programming Statements.” Open your SAS program then copy and paste the text into the SAS editor. Save the SAS programming statements in the same folder as the data file.
- Repeat the previous steps for obtaining, downloading and saving 2016 household consolidated data.
Step 2: Run SAS programming statements to create library and input 2015 and 2016 MEPS household consolidated data files
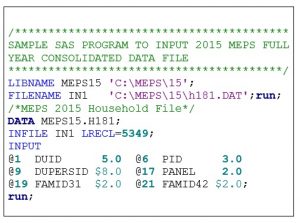
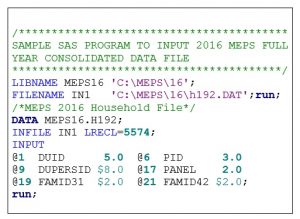
Sample SAS programs to create the libraries and input the 2015 and 2016 MEPS household consolidated data files are provided in Box 7.3 and Box 7.4, respectively. The full SAS programs are available for download in the chapter 7 folder of the Open ICPSR data repository.
2015 MEPS Full Year Consolidated SAS Programming File
- Open the SAS Full Year Consolidated Programming File
- Remove any unnecessary instructions within programming file. Labels and formats can be removed since all variables will be recoded when you complete your analysis.
- Create a LIBNAME statement which houses the data and files associated with the analysis. I recommend creating the LIBNAME statement as the survey name (e.g. “MEPS”) and using the same location that the data files for saved in on the C drive (e.g. “C:\MEPS\15”)
- Create a FILENAME statement which lets SAS know where the data file is stored (e.g. ‘C:\MEPS\15\H181.dat’)
- Highlight all programming statements and click RUN.
Box 7.3. SAS Program to input MEPS HC-181: 2015 Full Year Consolidated Data File
2016 MEPS Full Year Consolidated SAS Programming File
- Open the SAS Full Year Consolidated Programming File
- Remove any unnecessary instructions within programming file. Labels and formats can be removed since all variables will be recoded when you complete your analysis.
- Create a LIBNAME statement which houses the data and files associated with the analysis. I recommend creating the LIBNAME statement as the survey name (e.g. “MEPS”) and using the same location that the data files are saved in on the C drive (e.g. “C:\MEPS\16”)
- Create a FILENAME statement which lets SAS know where the data file is stored (e.g. ‘C:\MEPS\16\H192.dat’)
- Highlight all programming statements and click RUN.
Box 7.4. SAS Program to input MEPS HC-192: 2016 Full Year Consolidated Data File
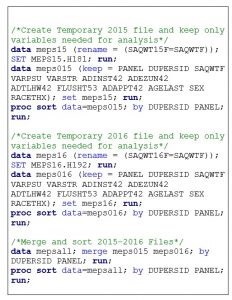
Step 3: Combine 2015 and 2016 Full Year Consolidated Files using MERGE statement
Once the data files have been input into SAS, the annual files must be combined. First, create a temporary file name for each file to indicate the type of data file and the year (e.g. meps15 and meps16). Second, sort each file by the participant id number (variable: DUPERSID) and panel (variable: PANEL) prior to merging. I also recommend using a KEEP statement to keep only the variables that you need for the analysis in your analytical dataset. Removing additional variables will allow the SAS program to run and present results faster. For MEPS, rename any variables that include the year in the name (e.g. PERWT15F= PERWTF, PERWT16F= PERWTF) prior to merging data across years. In this case study, I have kept the following variables (Table 7.4) to denote the survey design features and creation of the independent variable, dependent variable and selected covariates.
Table 7.4. Overview of variables used for MEPS case study
| Variable Name | Variable Description |
|---|---|
| Design Variables | |
| PANEL | Panel number |
| DUPERSID | Person ID (Dwelling unit + person number) |
| SAQWT15F | Final SAQ person weight, 2015 |
| SAQWT16F | Final SAQ person weight, 2016 |
| VARPSU | Primary sampling unit |
| VARSTR | Stratum (clustering) |
| Independent Variables | |
| ADINST42 | SAQ 12 Months: Dr. gave specific instructions (Rounds 4/2) |
| ADEZUN42 | SAQ 12 Months: Dr. given instructions were easy to understand (Rounds 4/2) |
| ADTLHW42 | SAQ 12 Months: Dr. asked to describe how you will follow instructions (Rounds 4/2) |
| Dependent Variable | |
| FLUSHT53 | How long since last flu vaccination (Rounds 5/3) |
| Covariates/Inclusion Criteria | |
| ADAPPT42 | SAQ 12 Months: # visits to medical office for care (Rounds 4/2) |
| AGELAST | Age |
| SEX | Sex |
| RACETHX | Race/Ethnicity |
Third, merge and sort the combined dataset with only the variables from the 2015 and 2016 full consolidated files that are needed to meet your research aims. A sample SAS program for merging and sorting 2015-2016 MEPS full year consolidated files is provided in Box 7.5.
Box 7.5. Sample SAS program to merge and sort 2015-2016 MEPS full year consolidated data files
Step 4: Recode and rename variables
Questionnaire responses often need to be recoded or responses collapsed prior to conducting statistical analysis. For example, the MEPS has response options “-9=Not ascertained,” “-8=Don’t know,” “-7=Refused,” and “-1=Inapplicable” for several questions. The responses are often removed and made “missing” prior to analysis. Furthermore, the numbers that represent certain values may need to be changed for easier interpretation of statistical analysis results. For example, MEPS has response options “1=Yes” and “2=No.” It is common practice to change “no” responses to 0, “0=No.” It is best practice to rename these recoded variables with a new variable name instead of replacing the original variable.
An overview of the variables recoded and renamed for analysis in this case study is provided in Table 7.5.
Table 7.5. Overview of MEPS variables recoded and renamed to meet research aims.
| Question Description | Original Variable | Original Responses | Renamed Variable | Recoded Responses |
|---|---|---|---|---|
| Instructions easy to understand | ADEZUN42 | -9=Not ascertained -1=Inapplicable 1=Never 2=Sometimes 3=Usually 4=Always |
EASY | 0=Not Always (combine never, sometimes, usually responses) 1=Always |
| Asked to describe how you will follow instructions | ADTLHW42 | -9=Not ascertained -1=Inapplicable 1=Never 2=Sometimes 3=Usually 4=Always |
FOLLOW | 0=Not Always (combine never, sometimes, usually responses) 1=Always |
| How long since last flu vaccine | FLUSHT53 | -9=Not ascertained -8=Don’t know -7=Refused -1=Inapplicable 1=Within past year 2=Within 2 years 3=Within 3 years 4=Within 5 years 5=>5 years 6=Never |
FLU_NEW | 0=Not within past year (combine past 2 years, 3 years, 5 years, >5 years, never) 1=Within past year |
| Age | AGELAST | 0-85 years | AGE_NEW | 1=18-44 years 2=45-64 years 3=65 and older |
| Race/Ethnicity | RACETHX | 1=Hispanic 2=Non-Hispanic White 3=Non-Hispanic Black 4=Non-Hispanic Asian 5=Non-Hispanic other/multiple |
RACEETH | 1=Hispanic 2=Non-Hispanic White 3=Non-Hispanic Black 4=Non-Hispanic Other (including Asian/multiple) |
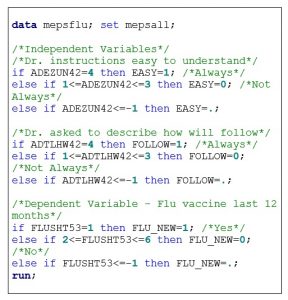
A sample SAS program for recoding and renaming MEPS data for this case study is provided in Box 7.6.
Box 7.6. Sample SAS program to recode and rename MEPS variables
Step 5: Conduct Descriptive Statistical Analysis
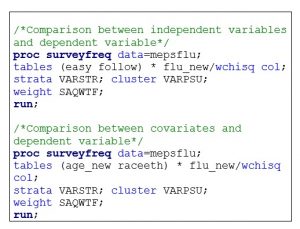
Once all variables are recoded, collapsed, and renamed they can be used for statistical analysis. Statistical analysis should always start with descriptive analysis to describe the data source. Chi square analyses should be conducted to make categorical comparisons between the independent variable, covariates, and dependent variables. It is important to remember that all analysis of MEPS data needs to be conducted with SAS survey procedures due to the complex sample design. Weighting (variable: SAQWTF), primary sampling unit (variable: VARPSU) and cluster (variable: VARSTR) variables must be included in the programming statements.
A sample SAS program for conducting chi-square tests using MEPS data for this case study is provided in Box 7.7.
Box 7.7. Sample SAS program for running descriptive statistics (chi-square)
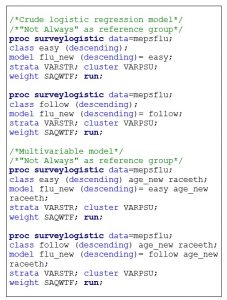
Step 5: Conduct Inferential Statistical Analysis
After calculating descriptive statistics, inferential statistical analysis can be conducted. Crude and multivariable logistic regression models can be calculated to determine associations between each quality of PPC (gave instructions that were easy to understand, asked you to describe how you will follow instructions) and flu vaccine uptake in the last 12 months. Crude logistic regression models are used to determine the association between the independent and dependent variables without adjusting for other factors. Multivariable logistic regression models are used to determine associations between the independent and dependent variables after adjusting for potential covariates (e.g. age, race/ethnicity). Reference categories for the independent variables are needed. For this analysis, the reference group is “not always.” Results compare adults who reported their health care provider “always” exhibited each PPC quality to those whose provider did “not always” exhibit each specific PPC quality. A sample SAS program for conducting logistic regression analysis using MEPS data for this case study is provided in Box 7.8.
Box 7.8. Sample SAS program for running MEPS inferential statistics (logistic regression)
7.7 Summary
This chapter provided an overview of the MEPS and ways to conduct basic statistical analysis using 2015-2016 public-use data files. The MEPS case study explored whether adults whose health care provider’s always demonstrated clear communication (gave instructions that were easy to understand) and the teach-back method (asked them to describe how they will follow instructions) were more likely to receive a flu vaccine. Sample SAS programming statements were provided for downloading and inputting data files, merging data files, recoding and renaming variables, and conducting categorical descriptive and inferential statistical analysis. The dataset and full SAS programming statements for the MEPS case study are available n the Chapter 7 folder, in the Open ICPSR data repository.
7.8 References
- Cohen SB. Design strategies and innovations in the medical expenditure panel survey. Med Care. 2003;41(7 Suppl):III5-III12. doi:10.1097/01.MLR.0000076048.11549.71
- Agency for Healthcare Research and Quality (AHRQ). MEPS HC-201: 2017 Full Year Consolidated Data File. Accessed September 2, 2020. https://meps.ahrq.gov/data_stats/download_data/pufs/h201/h201doc.pdf
- National Center for Health Statistics. Survey Description, National Health Interview Survey, 2018.; 2019.
- Agency for Healthcare Research and Quality (AHRQ). Medical Expenditure Panel Survey Home. Accessed September 2, 2020. https://meps.ahrq.gov/mepsweb/
- Agency for Healthcare Research and Quality (AHRQ). Medical Expenditure Panel Survey Insurance/Employer Component Overview. Accessed September 2, 2020. https://meps.ahrq.gov/mepsweb/survey_comp/Insurance.jsp
- Agency for Healthcare Research and Quality (AHRQ). MEPS HC-199: 2017 Medical Conditions. Accessed September 2, 2020. https://meps.ahrq.gov/data_stats/download_data/pufs/h199/h199doc.pdf
- MEPS HC-202: Panel 21 Longitudinal Data File. Accessed September 2, 2020. https://meps.ahrq.gov/data_stats/download_data/pufs/h202/h202doc.shtml
- NHIS – 2017 Data Release. Published May 10, 2019. Accessed September 2, 2020. https://www.cdc.gov/nchs/nhis/nhis_2017_data_release.htm
- Morgan PA, Strand J, Østbye T, Albanese MA. Missing in action: care by physician assistants and nurse practitioners in national health surveys. Health Serv Res. 2007;42(5):2022-2037. doi:10.1111/j.1475-6773.2007.00700.x
- Kindratt TB. The Influence of Face-to-face and E-mail Patient-provider Communication on Breast, Cervical, and Colorectal Cancer Screenings. Texas Medical Center Dissertations (via ProQuest). Published online January 1, 2018:1-119.
- Kindratt TB, Atem F, Dallo FJ, Allicock M, Balasubramanian BA. The Influence of Patient–Provider Communication on Cancer Screening. Journal of Patient Experience. Published online May 11, 2020:2374373520924993. doi:10.1177/2374373520924993
- Kindratt TB, Dallo FJ, Allicock M, Atem F, Balasubramanian BA. The influence of patient-provider communication on cancer screenings differs among racial and ethnic groups. Prev Med Rep. 2020;18:101086. doi:10.1016/j.pmedr.2020.101086
- Villani J, Mortensen K. Patient-provider communication and timely receipt of preventive services. Prev Med. 2013;57(5):658-663. doi:10.1016/j.ypmed.2013.08.034
- Zuvekas SH, Kashihara D. The Impacts of the COVID-19 Pandemic on the Medical Expenditure Panel Survey. Am J Public Health. 2021;111(12):2157-2166. doi:10.2105/AJPH.2021.306534
7.9 COVID-19 Pandemic Changes
Sections 7.1 to 7.8 were written during the initial waves of the COVID-19 pandemic. Since the MEPS conducts in-person surveys at participants’ households, there were significant disruptions to the regular methodology due to stay-at-home orders and safety concerns for both participants and the data collectors.14 With the declaration of a national emergency on March 13, 2020, changes were needed to adhere to essential work-based restrictions, collect data more effectively, and enhance survey content that could be used for evidence-based public health decision-making. All data collection procedures were halted on March 17, 2020, and in-person data collection was switched to telephone through Fall 2020.14 New content was collected on telehealth visits, COVID-19 specific impacts on health care utilization, and COVID-19 vaccination uptake. Full details of the changes are reported elsewhere.14
