9 Behavioral Risk Factor Surveillance System
9.1 Introduction
Chapter 9 covers the Behavioral Risk Factor Surveillance System (BRFSS). The BRFSS has been conducted by the Centers for Disease Control and Prevention (CDC) since 1984 to collect data on health behaviors, physical activity, diet, hypertension and preventive safety measures (e.g. seat-belt use) among US adults.1 This chapter includes details on: how data are collected; how data are made publicly available as machine-actionable data files; what variables must be included to address design features of the complex sample; the strengths and limitations of the survey; and practical tips for conducting statistical analysis; and how to answer research questions using a case study. The practical tips provided for analysis of BRFSS data are based on the primary author’s previous experiences analyzing 2014 and 2019 BRFSS data to answer questions related to associations between predisposing and enabling factors that contribute to morbidity, mortality and health services use. The BRFSS case study will explore how differences in caregiving experiences among urban and rural adults in Texas are moderated by race and ethnicity. The bulk of this chapter will comprise of section 9.6: Case Study in order to give investigators hands-on practice downloading and cleaning large databases and conducting basic categorical data analysis using PROC SURVEYFREQ and PROC SURVEYLOGISTIC. The syntax provided was created for use with SAS 9.4.
9.2 Data Collection
Since beginning in 1984, the BRFSS was expanded in 1988 to include optional modules, including chronic disease, health care access, and preventive services uptake. Some optional modules include data collection among children.1 In 1993, the BRFSS was further expanded to become an annual national surveillance system. The BRFSS uses a random-digit-dialing cross-sectional study design to collect data using a computer-assisted telephone interview (CATI) system. The BRFSS is one of the largest health surveys collected worldwide with over 400,000 responses collected each year.2 Prior to 2008, data were only collected from landline telephones. In 2008, the methodology was revised to conduct interviews using cell phones. Response rates are calculated for landline, cell phone, and combined responses for each state. National response rates are calculated as a median of response rates from each state. In 2019, the overall national combined response rate was 49.4% (range from (37.3%-73.1%).3 Response rates were lowest in New York (39.5% landline, 33.5% cell phone, 37.3% overall) and highest in South Dakota (78.0% landline, 33.5% cell phone, 73.1% overall). For Texas, the landline response rate was 50.6%, the cell phone response rate was 37.6%, and the combined response rate was 46.3%.3 Further details of the BRFSS sampling design and data collection methods are reported on the BRFSS website.4
9.3 Data Files
The CDC provides a complete BRFSS public-use data file available annually, which can be combined with other years to increase sample sizes for the analysis of specific subgroups. The annual questionnaire includes three parts: 1) core component; 2) optional BRFSS modules; and 3) state-added questions.5 In 2019, BRFSS grouped data into four datasets that combine landline and cellular responses. The main 2019 BRFSS Questionnaire data file can be used for research questions in the core section or common modules asked by the states. Separate BRFSS versions may be needed if states collected multiple versions of the questionnaires.6
9.3.1 Core Component
The core component includes a standard set of questions used by all states. There is an annual core set of questions are asked every year and rotating core set of questions administered in odd- and even-numbered years. The core questions are selected from other established national surveys, including the National Health Interview Survey (NHIS) and National Health and Nutrition Examination Survey (NHANES) to allow for comparisons across survey methods.5 Question topics include demographics, health-related perceptions, health conditions and health behaviors. Examples include questions examining health care access, health status, fruit and vegetable consumption, alcohol, and tobacco use.5 Based on an agreement between state representatives and the CDC, states are required to administer the core component each year without modification.
9.3.2 Optional Modules
Additional modules on specific topics are created each year. States vote to approve and adopt questions proposed by the CDC for inclusion in the optional modules. Then, states have the option to elect whether or not to use these questions with the core component on their annual survey.5 Examples include questions on diabetes, skin cancer risk, shingles, cancer survivorship and the caregiving module used for the case study outlined in this chapter. Additional details on the optional modules are available on the BRFSS website.
9.3.3. State-Added Questions
States can also develop or obtain additional questions to be added to their BRFSS questionnaires for state programming purposes. In 2020, the Texas BRFSS added nine sections with state-added questions focused on 1) health access; 2) e-cigarette use; 3) reasons for not getting a shingles vaccine; 4) cancer survivorship; 5) food security; 6) oral health; 7) tobacco; 8) marijuana vaping; and 9) suicide attempts.6 State-added questions are not available in the public use data files and must be obtained directly from the state BRFSS coordinators. More details on state-added questions for each state are available on each state-specific BRFSS website.
9.4. Strengths and Limitations
A strength of the BRFSS is a large sample size in comparison to other national datasets (e.g. NHIS or NHANES) due to the telephone data collection design. Another strengths is the ability for prevalence estimates for cancer screening and other health behaviors to be directly linked Healthy People 2020 and Healthy People 2030 objectives.5,7 A limitation of the BRFSS is that all data are self-reported. The interviews are not conducted in person. There is an underrepresentation of rural counties in the sample design. The optional core modules are not administered by all US states and territories, which make it difficult to make comparisons between geographic contexts for those specific topics.5
9.5 Design Features
Data analysts must use special procedures to account for the complex sample design used by the BRFSS. Analytic procedures must include variables to adjust for the clustering, stratification, and weighting of each data file. The clustering (_PSU) and stratification (_STSTR) are the same regardless of the data file used. An overview of the BRFSS clustering, stratification, and weighting variables for 2019 are provided in Table 9.1.
Table 9.1. Overview of BRFSS complex sample design variables
| Data Description (Dataset) | Clustering | Stratification | Weight |
|---|---|---|---|
| 2019 BRFSS Questionnaire Data (LLCP2019) | _PSU | _STSTR | _LLCPWT |
| 2019 Combined Landline and Cell Phone Version 1 (LLCP18V1) | _PSU | _STSTR | LCPWTV1 |
| 2019 Combined Landline and Cell Phone Version 2 (LLCP18V2) | _PSU | _STSTR | LCPWTV2 |
| 2019 Combined Landline and Cell Phone Version 3 (LLCP18V3) | _PSU | _STSTR | LCPWTV3 |
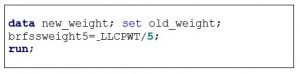
When combining multiple years of NHIS data, investigators must divide the total annual weight by the total number of years (or multiply by 1/total years) in the merge prior to conducting their statistical analysis. For example, if combining the full questionnaire data from 2015-2019, _LLCPWT should be divided by 5 or multiplied by 1/5. An example of how to do this in SAS 9.4 is provided in Box 9.1.
Box 9.1. SAS program to create new weight variable for five BRFSS data collection periods
9.6 BRFSS Case Study: Caregiving Experiences by Metro and Non-Metro Geographic Context and Race/Ethnicity
In 2020, the National Alliance for Caregiving (NAC) and American Association of Retired Persons (AARP) estimated that 21% of adults in the US are informal caregivers, which has increased by 9.5 million since 2015.9 Over 11 million unpaid individuals, family or friends, are caregivers for persons living with Alzheimer’s disease and related dementias (ADRD). The prevalence of ADRD is highest among non-Hispanic Whites; however, the prevalence is increasing among racial and ethnically diverse older adults. Few studies have evaluated differences in ADRD caregiving by geographic context. Studies which have compared ADRD caregiving in metro and non-metro areas have highlighted unmet resource needs and support the lack of dementia-specific10 and respite services.11 In a recent study using data from National Study of Caregiving (NSOC), Kindratt and colleagues found that non-metro ADRD caregivers were less racially/ethnically diverse (82.7% White), and more were spouses/partners (20.2%).12 Among racial/ethnic minority ADRD caregivers, non-metro context was associated with having more chronic conditions (p<.01), providing less care (p<.01), and not co-residing with care recipients (p<.001). Among White ADRD caregivers, non-metro context was associated with not reporting caregiving was more than they could handle (p<.05) and finding financial assistance for caregiving (p<.05). Non-metro minority ADRD caregivers had 3.09 times higher odds (95% CI=1.02-9.36) of reporting anxiety in comparison to metro minority ADRD caregivers. The BRFSS case study will extend this previous research by using BRFSS data from Texas to examine differences in ADRD caregiving experiences. Caregiving experiences that will be evaluated include managing personal care (e.g. medications, feeding, dressing, bathing) and the household (e.g. cleaning, managing money, preparing meals).
9.6.1 Specific Aims
- Aim 9.1. Determine whether ADRD caregiving experiences differ across metro and non-metro geographic contexts among adults in Texas
- Aim 9.2. Determine whether the relationship between geographic context and ADRD caregiving experiences is moderated by the caregiver’s race/ethnicity among metro and non-metro adults in Texas
9.6.2 Methods
Complete the following steps to download, clean, recode and analyze 2019 BRFSS data to determine how associations between metro and non-metro geographic context and ADRD caregiver experiences are moderated by race and ethnicity. The full SAS programs are available for download in the chapter 9 folder in the Open ICPSR data repository.
Step 1: Download BRFSS 2019 data and SAS programming files
- Go to the 2019 BRFSS data website
- Click on “2019 BRFSS Data (ASCII)” under data files. This file contains the combined landline and cell phone data
- A zip file with a “.dat” data file will be downloaded to the “Downloads” folder on your computer
- Unzip the file and save the data file to your computer. I recommend creating a folder on the “C Drive” labeled BRFSS and separated by each year. This will be consistent with the location statements used in the textbook examples
- Under SAS resources, there are three syntax files that are useful for creating the dataset, formatting and labeling the variables in the data file
- Click on “SASOUT19_LLCP.SAS” for the programming statements used to convert the “.dat” data file into a SAS data file and save to your computer. SAS statements from this file will be run first during Step 2.
- Click on and save “Formats19 [SAS7BCAT Direct Download – 493 KB]” for programming statements used to generate the 2019 format library. Statements are available for 32-bit and 64-bit SAS. SAS statements from this file should be run second during Step 2.
- Click on and save “Formas19.sas CDC” for format assignment statements. SAS statements from this file will be run third during Step 2.
Step 2: Run SAS programming statements to input data, create library, formats and labels for 2019 BRFSS data
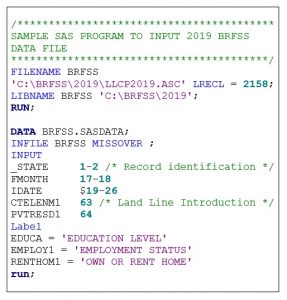
Sample SAS programming statements to create the libraries and input the 2019 BRFSS data files are provided in Box 9.2. To create these programming statements, complete the following steps:
- Open “SASOUT19_LLCP.SAS” Programming File
- Create a LIBNAME statement which houses the data and files associated with the analysis. I recommend creating the LIBNAME statement as the survey name (e.g. “BRFSS”) and using the same location that the data files for saved in on the C drive (e.g. “C:\BRFSS\2019”)
- Create a FILENAME statement which lets SAS know where the data file is stored (e.g. ‘C:\BRFSS\2019\LLCP2019.ASC’)
- Modify or remove any instructions (/*green text*/) that you do not need in programming file
- Add filename to first DATA procedure (e.g. ‘data brfss.sasdata’)
- Add libname to the INFILE procedure (e.g. ‘brfss’)
- Highlight all programming statements and click RUN
Box 9.2. SAS Program to input 2019 BRFSS data file
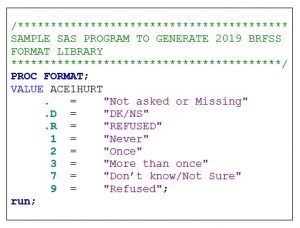
Sample SAS programming statements to generate the 2019 format library are provided in Box 9.3. To create these programming statements, complete the following steps:
- Open the “Formats19 [SAS7BCAT Direct Download – 493 KB]” Programming File
- Highlight all programming statements and click RUN
Box 6.3. SAS Program to generate BRFSS 2019 format library
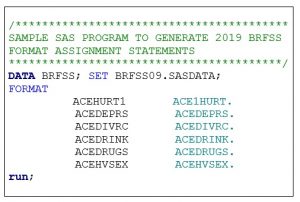
Sample SAS programming statements to generate the 2019 BRFSS format assignment statements are provided in Box 9.4. To create these programming statements, complete the following steps:
- Open the “Formas19.sas CDC” Programming File
- Add “data” procedure statement at the top of the file
- Add “run” statement at the bottom of the file
- Highlight all programming statements and click RUN
Box 9.4. SAS Program to generate 2019 BRFSS format assignment statements
Step 3: Limit the dataset to respondents from Texas
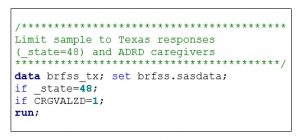
Due to the large sample size and state-based probability sampling frame, analysts can be confident that their power will be sufficient for producing statewide estimates. In this case study, our sample is limited to respondents from Texas. The sample is also limited to ADRD caregivers. To produce statistical estimates for the state of Texas only, our data must be limited to response option “48” for variable “_state.” Sample SAS programming statements for limiting the dataset by state are provided in Box 9.5.
Box 9.5. SAS Program to limit 2019 BRFSS data to only Texas respondents and ADRD caregivers
Step 4: Select variables for analysis
Once formats been assigned to the dataset, you can remove any variables that are not needed for your analysis. This will reduce the size of the dataset and make processing time quicker when running SAS programming statements. In this case study, I have kept the following variables (Table 9.2) to denote the survey design features and creation of the independent variable, dependent variable, moderator, and selected covariates.
Table 9.2 Overview of variables used for BRFSS case study
| Variable Name | Variable Description |
|---|---|
| Design Variables | |
| _PSU | Primary Sampling Unit |
| _STSTR | Sample Design Stratification |
| _LLCPWT | Weight: Land-line and cell |
| Inclusion Criteria | |
| _STATE |
State code |
| CAREGIV1 | Provided regular care: family/friend |
| CRGVALZD | Care recipient has Alzheimer’s disease, dementia, or other cognitive impairment |
| Independent Variables | |
| _METSTAT |
Metropolitan status |
| Dependent Variables | |
| CRGVHRS1 | Hours provide care |
| CRGVPER1 | Managed personal care |
| CRGVHOU1 | Managed household tasks |
| Moderator | |
| IMPRACE |
Imputed race/ethnicity value |
| Covariates | |
| CRGVREL3 | Relationship to care recipient |
| _AGE_G | Imputed age in six groups |
| SEXVAR | Sex of respondent |
| EMPLOY1 | Employment status |
Step 5: Recode and rename variables
Questionnaire responses often need to be recoded or responses collapsed prior to conducting statistical analysis. For example, the BRFSS has response options “7=Don’t Know” and “9=Refused” for several questions. The responses are often removed and made “missing” prior to analysis. Furthermore, the numbers that represent certain values may need to be changed for easier interpretation of statistical analysis results. For example, BRFSS has response options “1=Yes” and “2=No.” It is common practice to change “no” responses to 0, “0=No.” It is best practice to rename these recoded variables with a new variable name instead of replacing the original variable.
An overview of the variables recoded and renamed for analysis in this case study is provided in Table 9.3.
Table 9.3. Overview of BRFSS variables recoded and renamed to meet research aims
| Question Description | Original Variable | Original Responses | Renamed Variable | Recoded Responses |
|---|---|---|---|---|
| Care recipient has ADRD | CRGVALZD | 1=Yes 2=No 7=Don’t know 9=Refused |
CR_ADRD | 0=No 1=Yes |
| Hours provided care in average week | CRGVHRS1 | 1=Up to 8 hours 2=9-19 hours 3=20-39 hours 4=40 hours or more 7=Don’t know 9=Refused |
CG_HOURS | 1=0-19 hours 2=20-39 hours 3=40 hours or more |
| Managed personal care (medications, feeding, dressing, bathing) | CRGVPER1 | 1=Yes; 2=No 7=Don’t know 9=Refused |
CG_PCA | 0=No 1=Yes |
| Managed household (cleaning, managing money, preparing meals) | CRGVHOU1 | 1=Yes; 2=No 7=Don’t know 9=Refused |
CG_HOUSE | 0=No 1=Yes |
Table 9.3 (continued). Overview of BRFSS variables recoded and renamed to meet research aims
| Question Description | Original Variable | Original Responses | Renamed Variable | Recoded Responses |
|---|---|---|---|---|
| Relation of care recipient to caregiver | CRGVREL3 | 1=Mother 2=Father 3=Mother-in-law 4=Father-in-law 5=Child 6=Husband 7=Wife 8=Live in partner 9=Brother or brother-in-law 10=Sister or sister-in-law 11=Grandmother 12=Grandfather 13=Grandchild 14=Other relative 15=Non-relative |
CG_RELATION | 0=Other 1=Spouse or partner |
| Caregiver Sex | SEXVAR | 1=Male 2=Female |
CG_SEX (rename only) |
1=Male 2=Female |
| Employment | EMPLOY1 | 1=Employed for wages 2=Self-employed 3=Out of work 1+ year 4=Out of work <1 year 5=Homemaker 6=Student 7=Retired 8=Unable to work 9=Refused |
CG_WORK | 1=Employed 2=Retired 3=Not working |
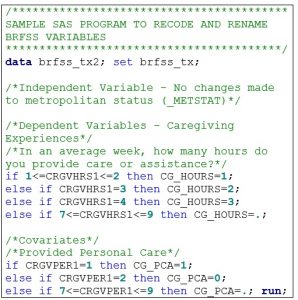
A sample SAS program for recoding and renaming 2019 BRFSS data for this case study is provided in Box 9.6.
Box 9.6. Sample SAS program for recoding and renaming BRFSS variables
Step 6: Conduct descriptive statistical analysis
Once all variables are recoded, collapsed, and renamed they can be used for statistical analysis. Statistical analysis should always start with descriptive analysis to describe the data source. Chi square analyses should be conducted to make categorical comparisons between the independent variable, covariates, and dependent variables. It is important to remember that all analysis of BRFSS data needs to be conducted with SAS Survey procedures due to the complex sample design. Weighting (variable: _LLCPWT), primary sampling unit (variable: _PSU) and cluster (variable: _STSTR) variables must be included in the programming statements.
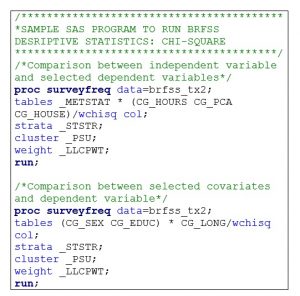
A sample SAS program for conducting chi-square tests using 2019 BRFSS data for this case study is provided in Box 9.7.
Box 9.7. Sample SAS program for running descriptive statistics (chi-square)
Step 7: Conduct inferential statistical analysis
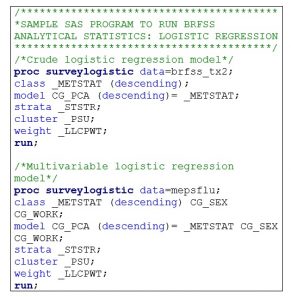
After calculating descriptive statistics, inferential statistical analysis can be conducted. Crude and multivariable logistic regression models can be calculated to determine associations between metropolitan or non-metropolitan residential context and caregiver experiences. Crude logistic regression models are used to determine the association between the independent and dependent variables without adjusting for other factors. Multivariable logistic regression models are used to determine associations between the independent and dependent variables after adjusting for potential covariates (e.g. sex, employment status). A reference category for the independent variables are needed. For this analysis, the reference group is “Metropolitan” residence. Results compare caregiving experiences among caregivers who live in metropolitan (urban) and non-metropolitan (rural) geographic contexts.
A sample SAS program for conducting logistic regression analysis using 2019 BRFSS data for this case study is provided in Box 9.8.
Box 9.8. Sample SAS program for running BRFSS inferential statistics (logistic regression)
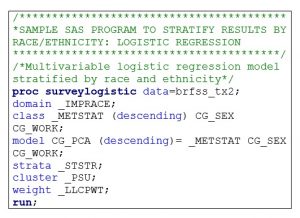
In order to determine whether race/ethnicity is a moderator in the relation between geographic context and ADRD caregiver experiences, a “DOMAIN” statement in SAS must be used to present stratified results. Any example of where to include this statement is provided in Box 9.9. The _IMPRACE variable may need to be recoded to “White/Non-Hispanic” and “Other/Minority” due to small sample sizes of non-metro ADRD minority caregivers separated by specific races and ethnicities.
Box 9.9. Sample SAS program for running BRFSS inferential statistics (logistic regression) using DOMAIN statement to stratify results
9.7 Summary
This chapter provided an overview of the BRFSS and ways to conduct basic statistical analysis for one state using 2019 BRFSS public-use data files. The BRFSS case study explored whether geographic context was associated with caregiving experiences. Sample SAS programming statements were provided for downloading and inputting data files, merging data files, recoding and renaming variables, and conducting categorical descriptive and inferential statistical analysis. The dataset and full SAS programming statements for the BRFSS case study are available in the chapter 9 folder in the Open ICPSR data repository.
9.8 References
- Centers for Disease Control and Prevention. About the Behavioral Risk Factor Surveillance System (BRFSS). Published February 9, 2019. Accessed December 10, 2020. https://www.cdc.gov/brfss/about/about_brfss.htm
- CDC – About BRFSS. Published February 9, 2019. Accessed December 10, 2020. https://www.cdc.gov/brfss/about/index.htm
- Centers for Disease Control and Prevention. Behavioral Risk Factor Surveillance System: 2019 Summary Data Quality Report.; 2020. Accessed June 19, 2022. https://www.cdc.gov/brfss/annual_data/2019/pdf/2019-sdqr-508.pdf
- CDC – BRFSS. Published August 31, 2020. Accessed June 19, 2021. https://www.cdc.gov/brfss/index.html
- Centers for Disease Control and Prevention (CDC). Behavioral Risk Factor Surveillance System Overview: BRFSS 2019. Accessed June 17, 2021. https://www.cdc.gov/brfss/annual_data/2019/pdf/overview-2019-508.pdf
- Centers for Disease Control and Prevention. Behavioral Risk Factor Surveillance System (BRFSS) Complex Sample Weights and Preparing 2019 BRFSS Module Data for Analysis. https://www.cdc.gov/brfss/annual_data/2019/pdf/Complex-Smple-Weights-Prep-Module-Data-Analysis-2019-508.pdf
- Texas Department of State Health Services. Texas Behavioral Risk Factor Surveillance System Questionnaire 2020.; 2020. https://www.dshs.texas.gov/chs/brfss/attachments/2020_BRFSS_Survey.pdf
- Data Sources – Healthy People 2030 | health.gov. Accessed June 21, 2021. https://health.gov/healthypeople/objectives-and-data/data-sources-and-methods/data-sources
- Jr SM. Caregiving in the US 2020 | The National Alliance for Caregiving. Published May 11, 2020. Accessed June 25, 2021. https://www.caregiving.org/caregiving-in-the-us-2020/
- Gibson A, Holmes SD, Fields NL, Richardson VE. Providing Care for Persons with Dementia in Rural Communities: Informal Caregivers’ Perceptions of Supports and Services. J Gerontol Soc Work. 2019;62(6):630-648. doi:10.1080/01634372.2019.1636332
- Kosloski K, Schaefer JP, Allwardt D, Montgomery RJV, Karner TX. The role of cultural factors on clients’ attitudes toward caregiving, perceptions of service delivery, and service utilization. Home Health Care Serv Q. 2002;21(3-4):65-88. doi:10.1300/J027v21n03_04
- Kindratt T, Sylvers D, Yoshikawa A, Anuarbe ML, Webster N, Bouldin E. ADRD Caregiving Experiences and Health by Race, Ethnicity and Care Recipient Geographic Context. Innov Aging. 2021;5(Suppl 1):990. doi:10.1093/geroni/igab046.3557
