5 Atterberg Limit Test
Introduction
The Atterberg limit refers to the liquid limit and plastic limit of soil. These two limits are used internationally for soil identification, classification, and strength correlations. When clay minerals are present in fine-grained soil, the soil can be remolded in the presence of some moisture without crumbling. This cohesiveness is caused by the adsorbed water surrounding the clay particles. At a very low moisture content, soil behaves more like a solid; at a very high moisture content, the soil and water may flow like a liquid. Hence on an arbitrary basis, depending on the moisture content, the behavior of soil can be divided into the four basic states shown in Figure 5-1: solid, semisolid, plastic, and liquid.
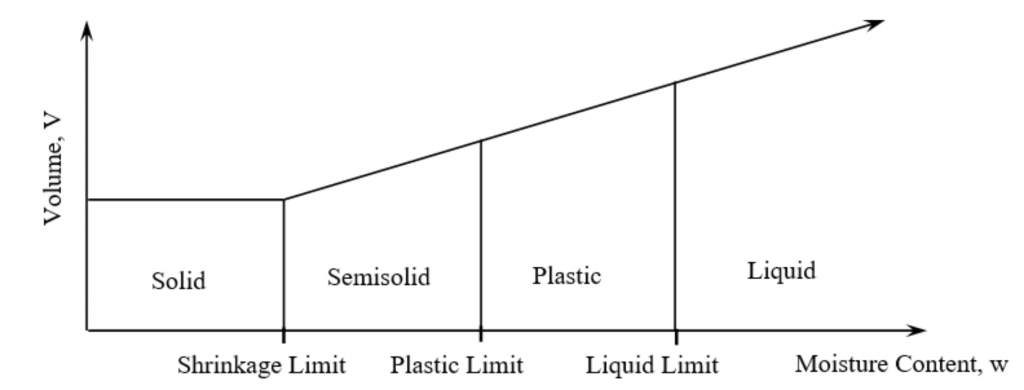
The percent of moisture content at which the transition from solid to semi-solid state takes place is defined as the shrinkage limit (SL). The moisture content at the point of transition from semi-solid to plastic state is the plastic limit (PL), and from plastic to liquid state is the liquid limit (LL). These parameters are also known as Atterberg limits. The liquid and plastic limits of a soil and its water content can be used to express its relative consistency or liquidity index. The plasticity index and the percentage finer than 2- μm particle size can be used to determine its activity number.
The liquid limit of a soil containing substantial amounts of organic matter decreases dramatically when the soil is oven-dried before testing. A comparison of the liquid limit of a sample before and after oven-drying can, therefore, be used as a qualitative measure of the organic matter content of a soil.
Practical Application
- This test method is used as an integral part of several engineering classification systems (USCS, AASHTO, etc.) to characterize the fine-grained fractions of soils and to specify the fine-grained fraction of construction materials.
- The liquid limit, plastic limit, and plasticity index of soils are also used extensively, either individually or with other soil properties to correlate with engineering behavior such as compressibility, hydraulic conductivity (permeability), shrink-swell, and shear strength.
- This method is sometimes used to evaluate the weathering characteristics of clay-shale materials. When subjected to repeated wetting and drying cycles, the liquid limits of these materials tend to increase. The amount of increase is considered to be a measure of the shale’s susceptibility to weathering.
Objective
The objective of this experiment is:
- To determine the liquid limit (LL), plastic limit (PL), and the plasticity index (PI) of fine-grained cohesive soils.
Equipment
- Balance
- Casagrande’s liquid limit device
- Grooving tool
- Mixing dishes
- Spatula
- Oven
- Texas Department of Transportation’s (TxDOT’s) recommended plastic limit rolling device
Standard Reference
- ASTM D4318: Standard Test Methods for Liquid Limit, Plastic Limit, and Plasticity Index of Soils
- TEX-105-E: Determining plastic limit of soils
Method
Liquid Limit Test
- Determine the mass of each of the three moisture cans (W1).
- Calibrate the drop of the cup, using the end of the grooving tool not meant for cutting, so that there is consistency in the height of the drop.
- Put about 250 g of air-dried soil through a # 40 sieve into an evaporating dish and with a plastic squeeze bottle, add enough water to form a uniform paste.
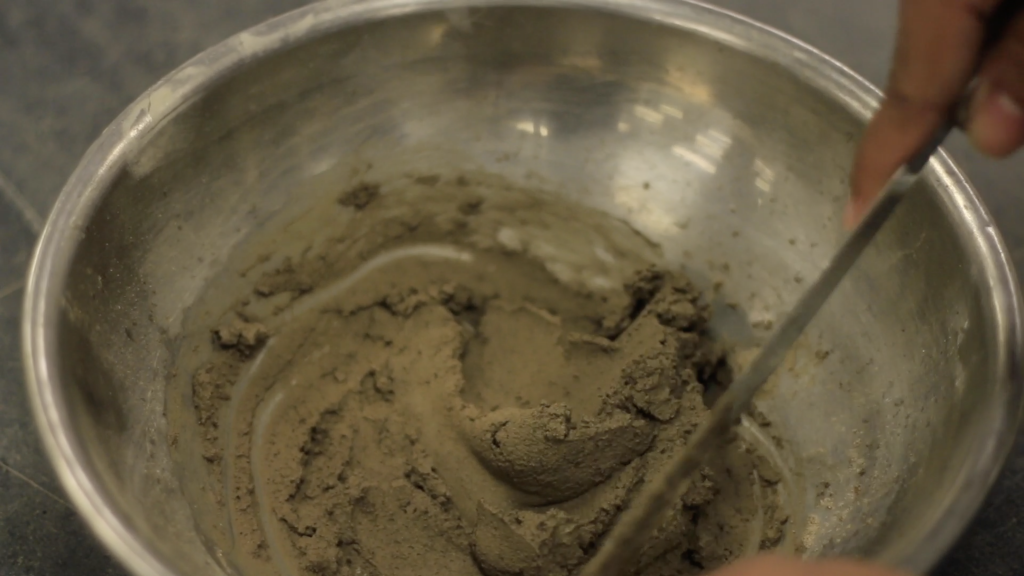
Figure 5.2: Preparation of soil slurry - Place the soil in the Casagrande’s cup and use a spatula to smooth the surface so that the maximum depth is about 8mm.
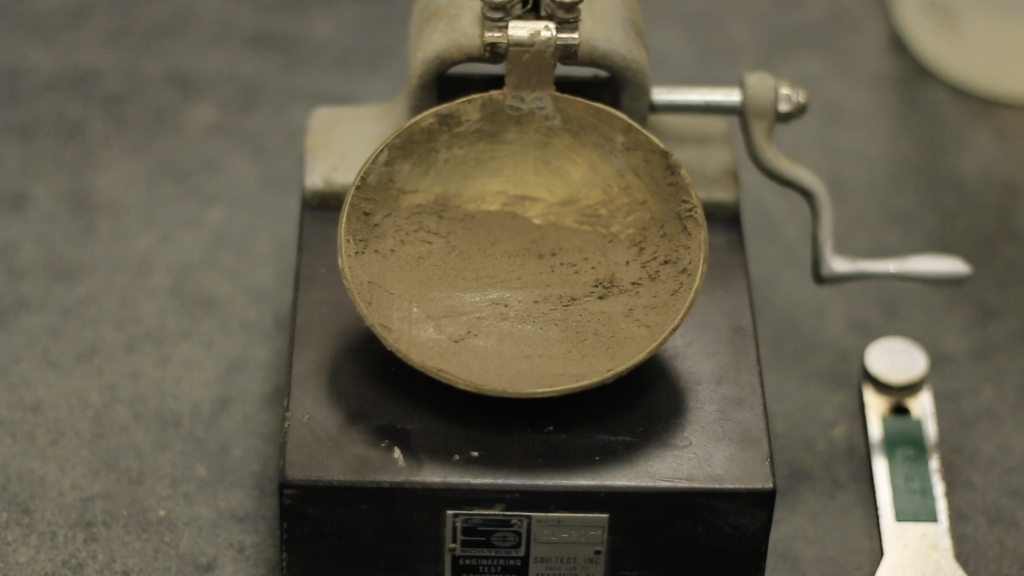
Figure 5.3: Placing the soil paste on the Casagrande apparatus - Using the grooving tool, cut a groove at the center line of the soil cup.
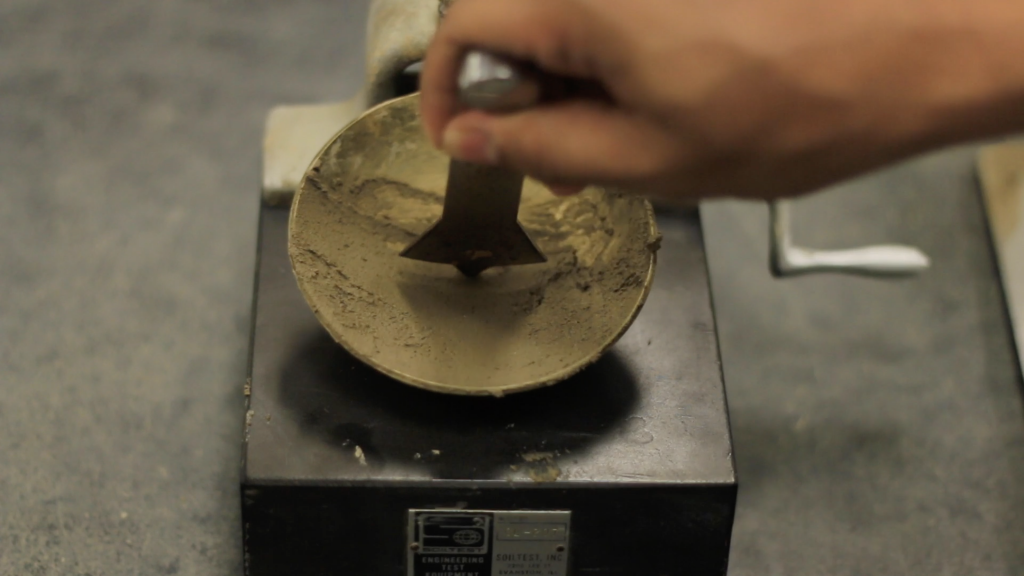
Figure 5.4: Cutting a groove at the middle of the soil paste with a standard grooving tool - Crank the device at a rate of 2 revolutions per second until there is a clear visible closure of 1/2” or 12.7 mm in the soil pat placed in the cup. Count the number of blows (N) that caused the closure. (Make the paste so that N begins with a value higher than 35.)
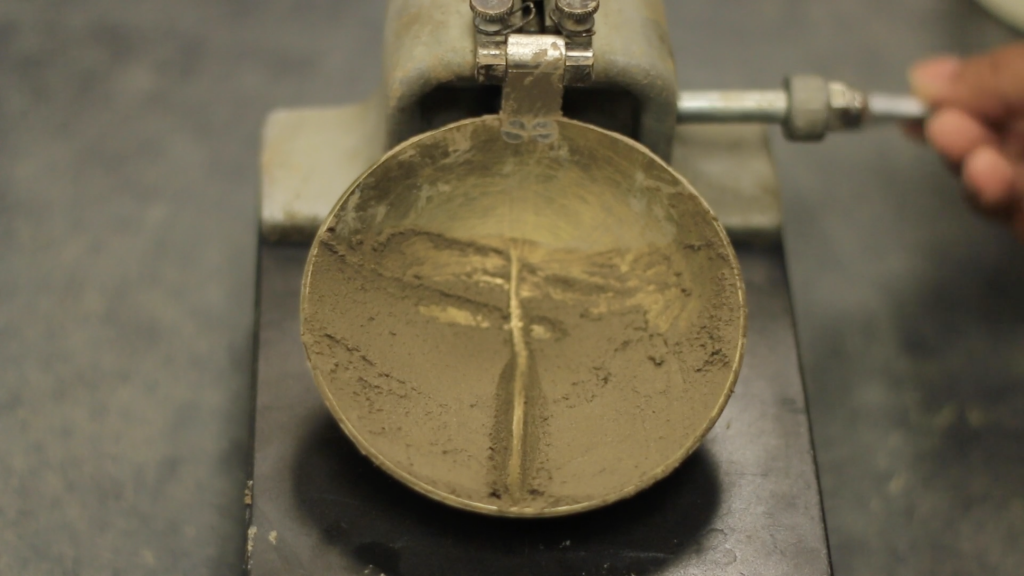
Figure 5.5: The groove at the middle of the soil sample before the application of the blows 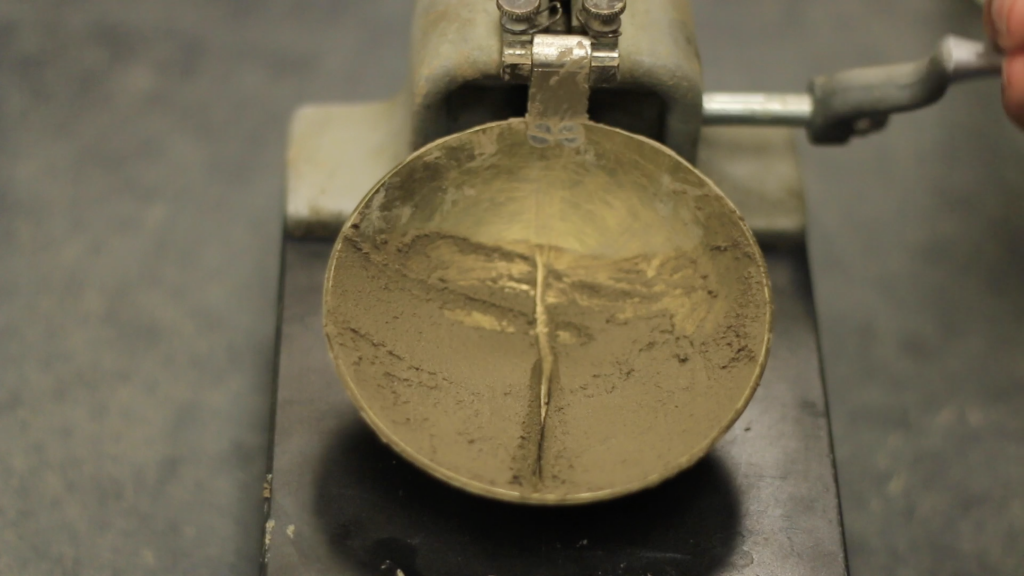
Figure 5.6: The groove at the middle of the soil sample after the application of the blows - If N= 15 to 40, collect the sample from the closed part of the cup using a spatula and determine the water content weighing the can + moist soil (W2). If the soil is too dry, N will be higher and will reduce as water is added.
- Do not add soil to the sample to make it dry. Instead, expose the mix to a fan or dry it by continuously mixing it with the spatula.
- Perform a minimum of three trials with values of N-15 to 40, cleaning the cap after each trial.
- Determine the corresponding w% after 24 hours (W3) and plot the N vs w%, which is called the “flow curve”.
Plastic Limit Test
- Mix approximately 20 g of dry soil with water from the plastic squeeze bottle.
- Determine the weight of the empty moisture can, (W1).
- Prepare several small, ellipsoidal-shaped masses of soil and place them in the plastic limit device. Place two fresh sheets of filter paper on either face of the plates.
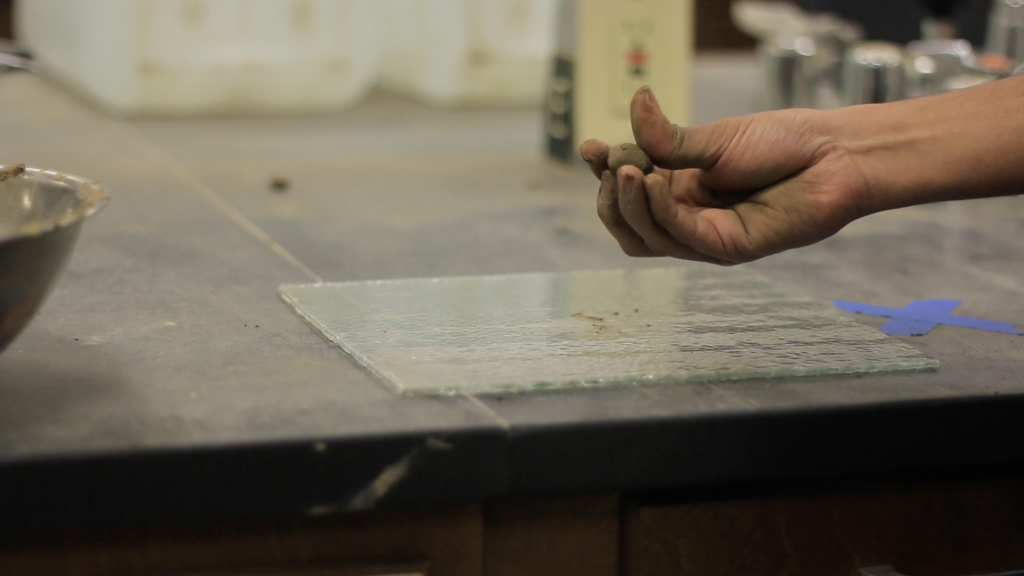
Figure 5.7: Sample preparation for the plastic limit test - Roll the upper half of the device which has a calibrated opening of 3.18 mm with the lower half plate.
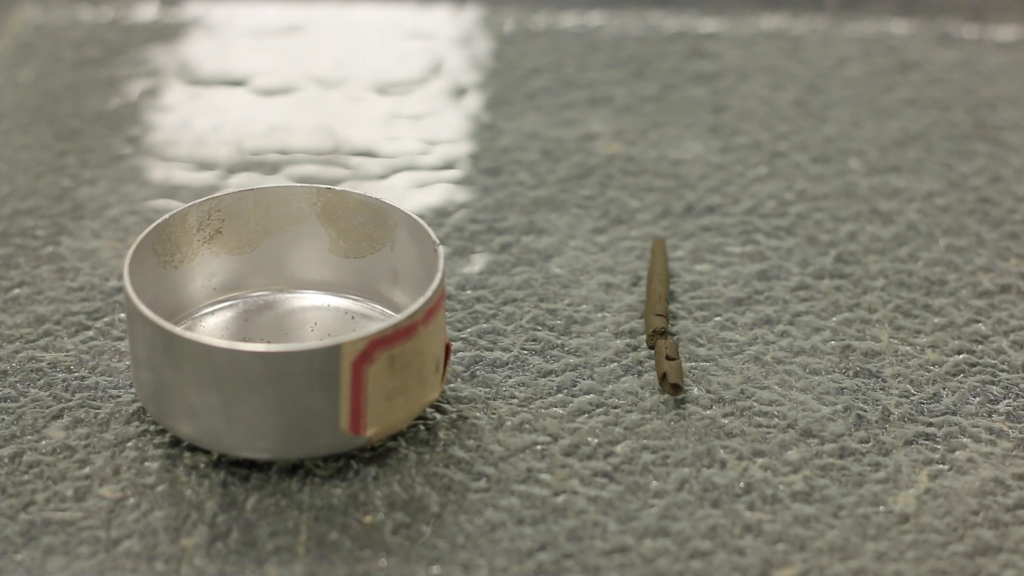
Figure 5.8: A sample thread of 3mm in diameter - If the soil crumbles forming a thread approximately the size of the opening between the plates (around 3 mm diameter), collect the crumbled sample, and weigh it in the moisture can (W2) to determine the water content. Otherwise, repeat the test with the same soil, but dry it by rolling it between your palms.
- Determine the weight of the dry soil + moisture can, (W3).
- The water content obtained is the plastic limit.
Shrinkage Limit Test
- A reduction in the amount of moisture past the plastic limit does not decrease the volume of the soil.
- The sample changes from semi-solid to solid state at the shrinkage limit (boundary water content). Beyond this point the sample begins to dry up.
- The figure below depicts the phenomena of volume change.
- Plot point A, using the values of LL and PI determined experimentally, and extend it to meet O.
- The intercept of the line AO on the X- axis gives the shrinkage limit.
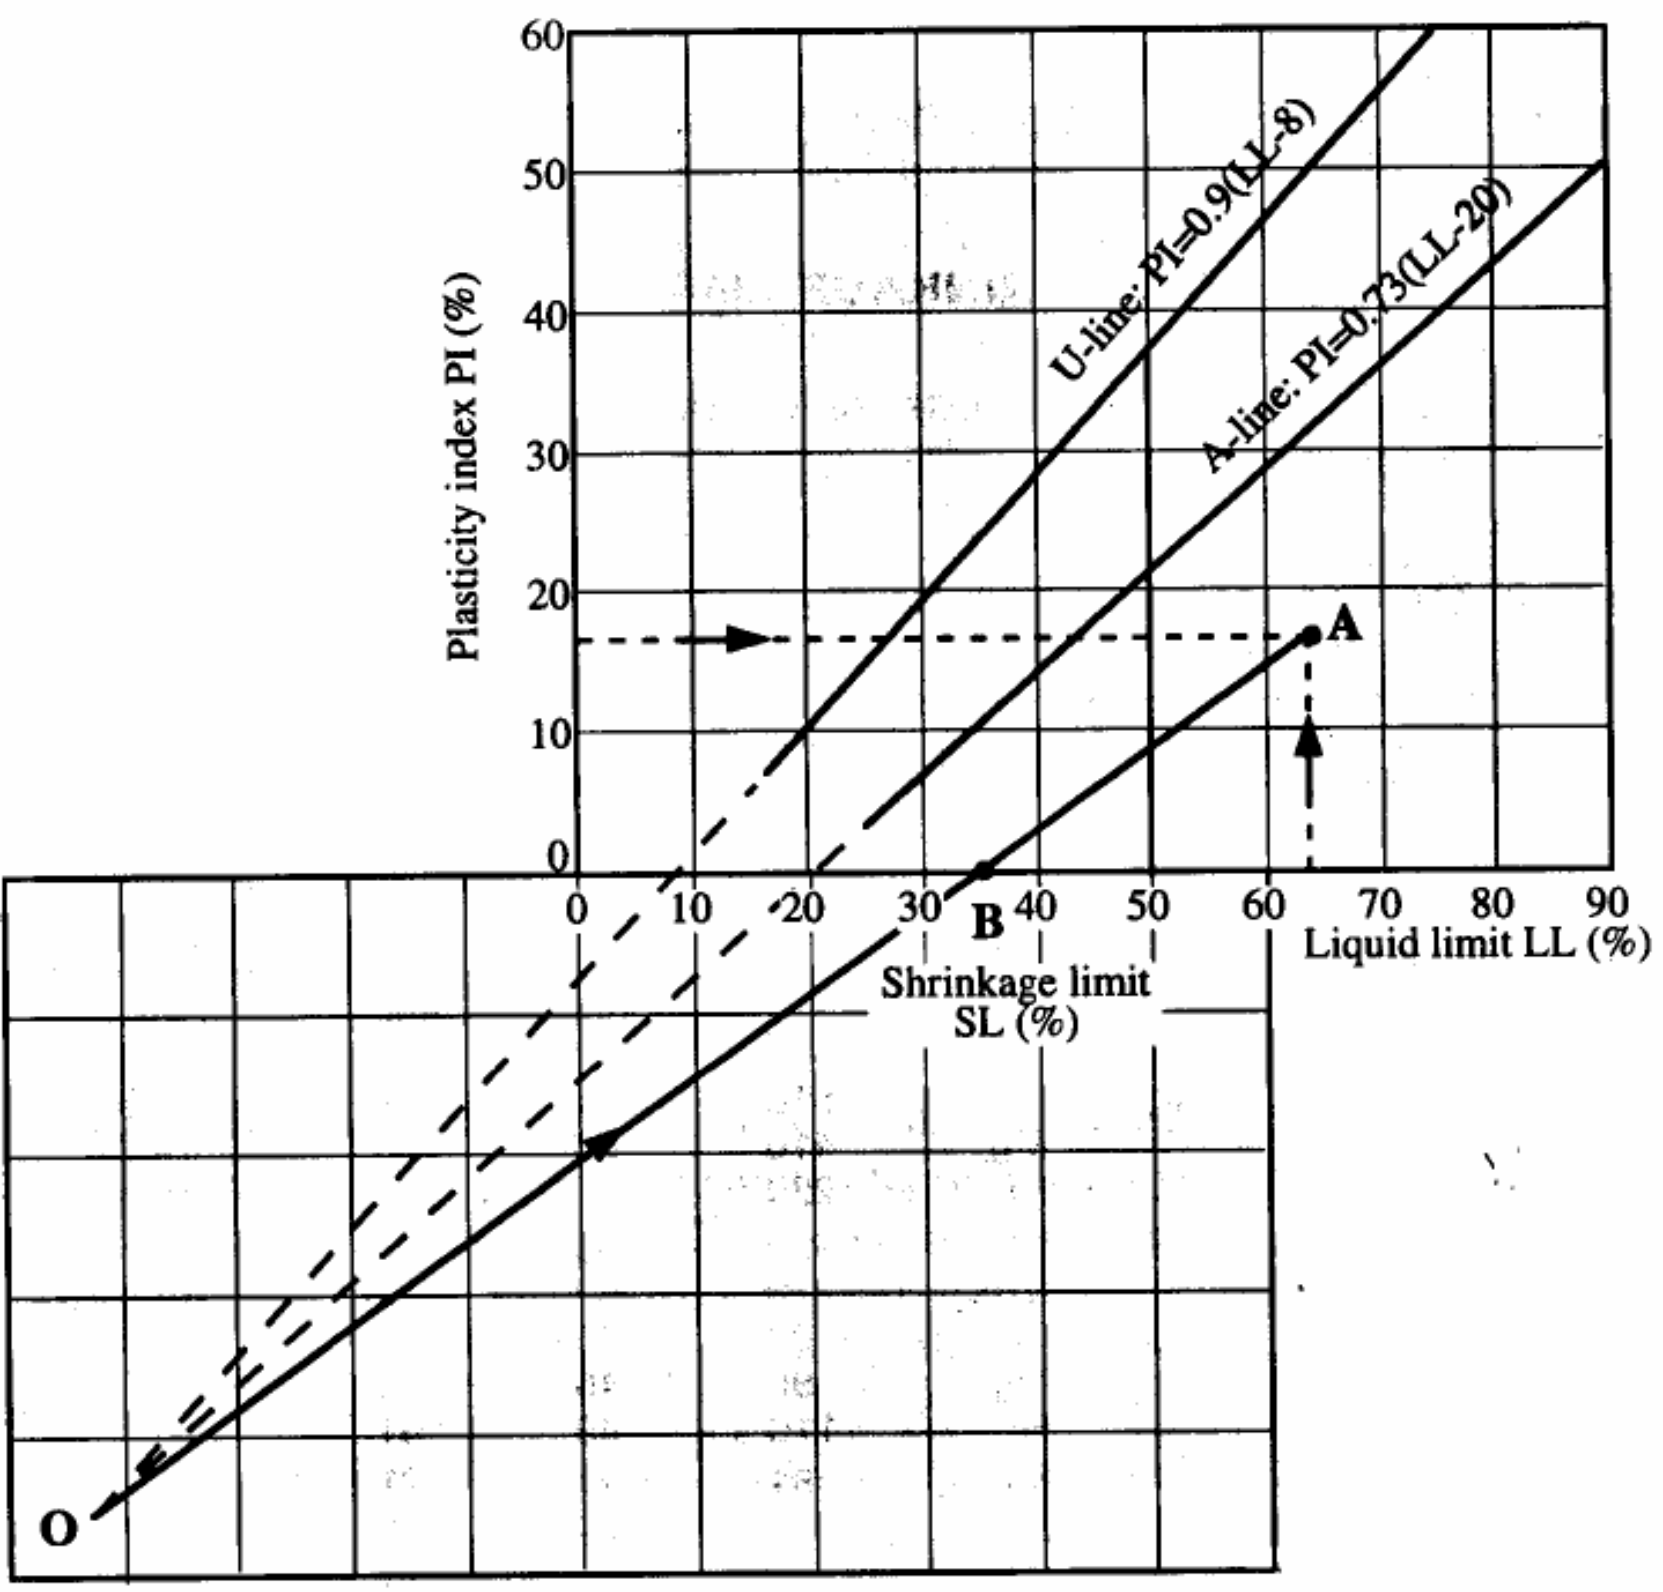
Figure 5.9: Determination of shrinkage limit from liquid limit and plasticity index
Video Materials
Lecture Video
A PowerPoint presentation is created to understand the background and method of this experiment.
Demonstration Video
A short video is executed to demonstrate the experiment procedure and sample calculation.
Results and Discussions
Liquid Limit Test
Sample Data Sheet

Sample Calculation
For Trial No. 01,
Number of blow, N= 15 (recorded during test)
Wt. of container = 7.7 gm
Wt. of container + wet soil = 27.6 gm
Wt. of container + dry soil = 19.2 gm
Wt. of water, Ww= 27.6-19.2 = 8.4 gm
Wt. of dry soil, Ws =19.2- 7.7 = 11.5 gm
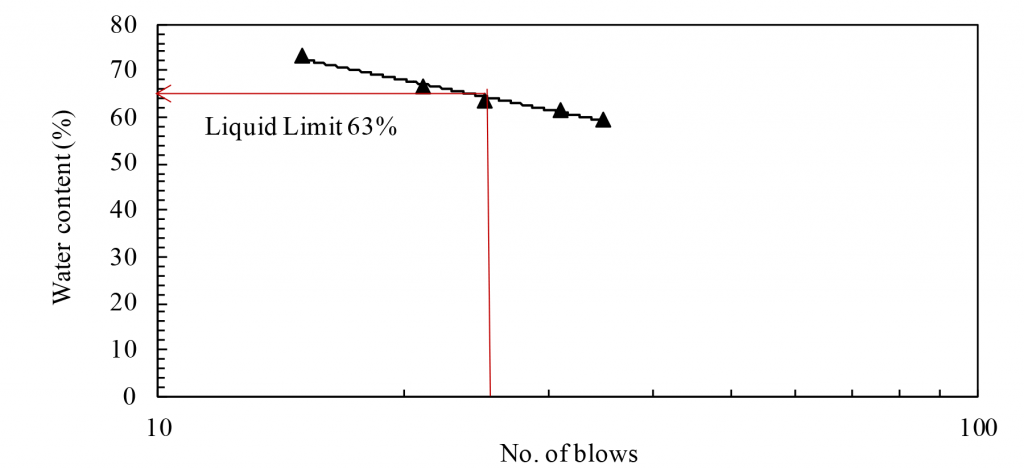
Water content, w = 73.0%
The flow curve, an example of which is shown in the Figure 5.10 below, can be obtained by plotting the water content with the corresponding number of blows on semi-log graph paper. The liquid limit of the soil sample can be obtained from this figure.
Blank Data Sheet

Plastic Limit Test
Sample Data Sheet

Sample Calculation
For Trial No. 01,
Wt. of container = 7.7 gm
Wt. of container + wet soil = 23.2 gm
Wt. of container + dry soil = 20.9 gm
Wt. of water, Ww = 23.2-20.9 = 2.3 gm
Wt. of dry soil, Ws =20.9- 7.7 = 13.2 gm
Water content, w = 17.42%
Plastic Limit is the average of moisture content of all trials.
Plasticity Index (PI)=Liquid Limit (LL)–Plastic limit (PL)
Blank Data Sheet

Determination of Shrinkage Limit
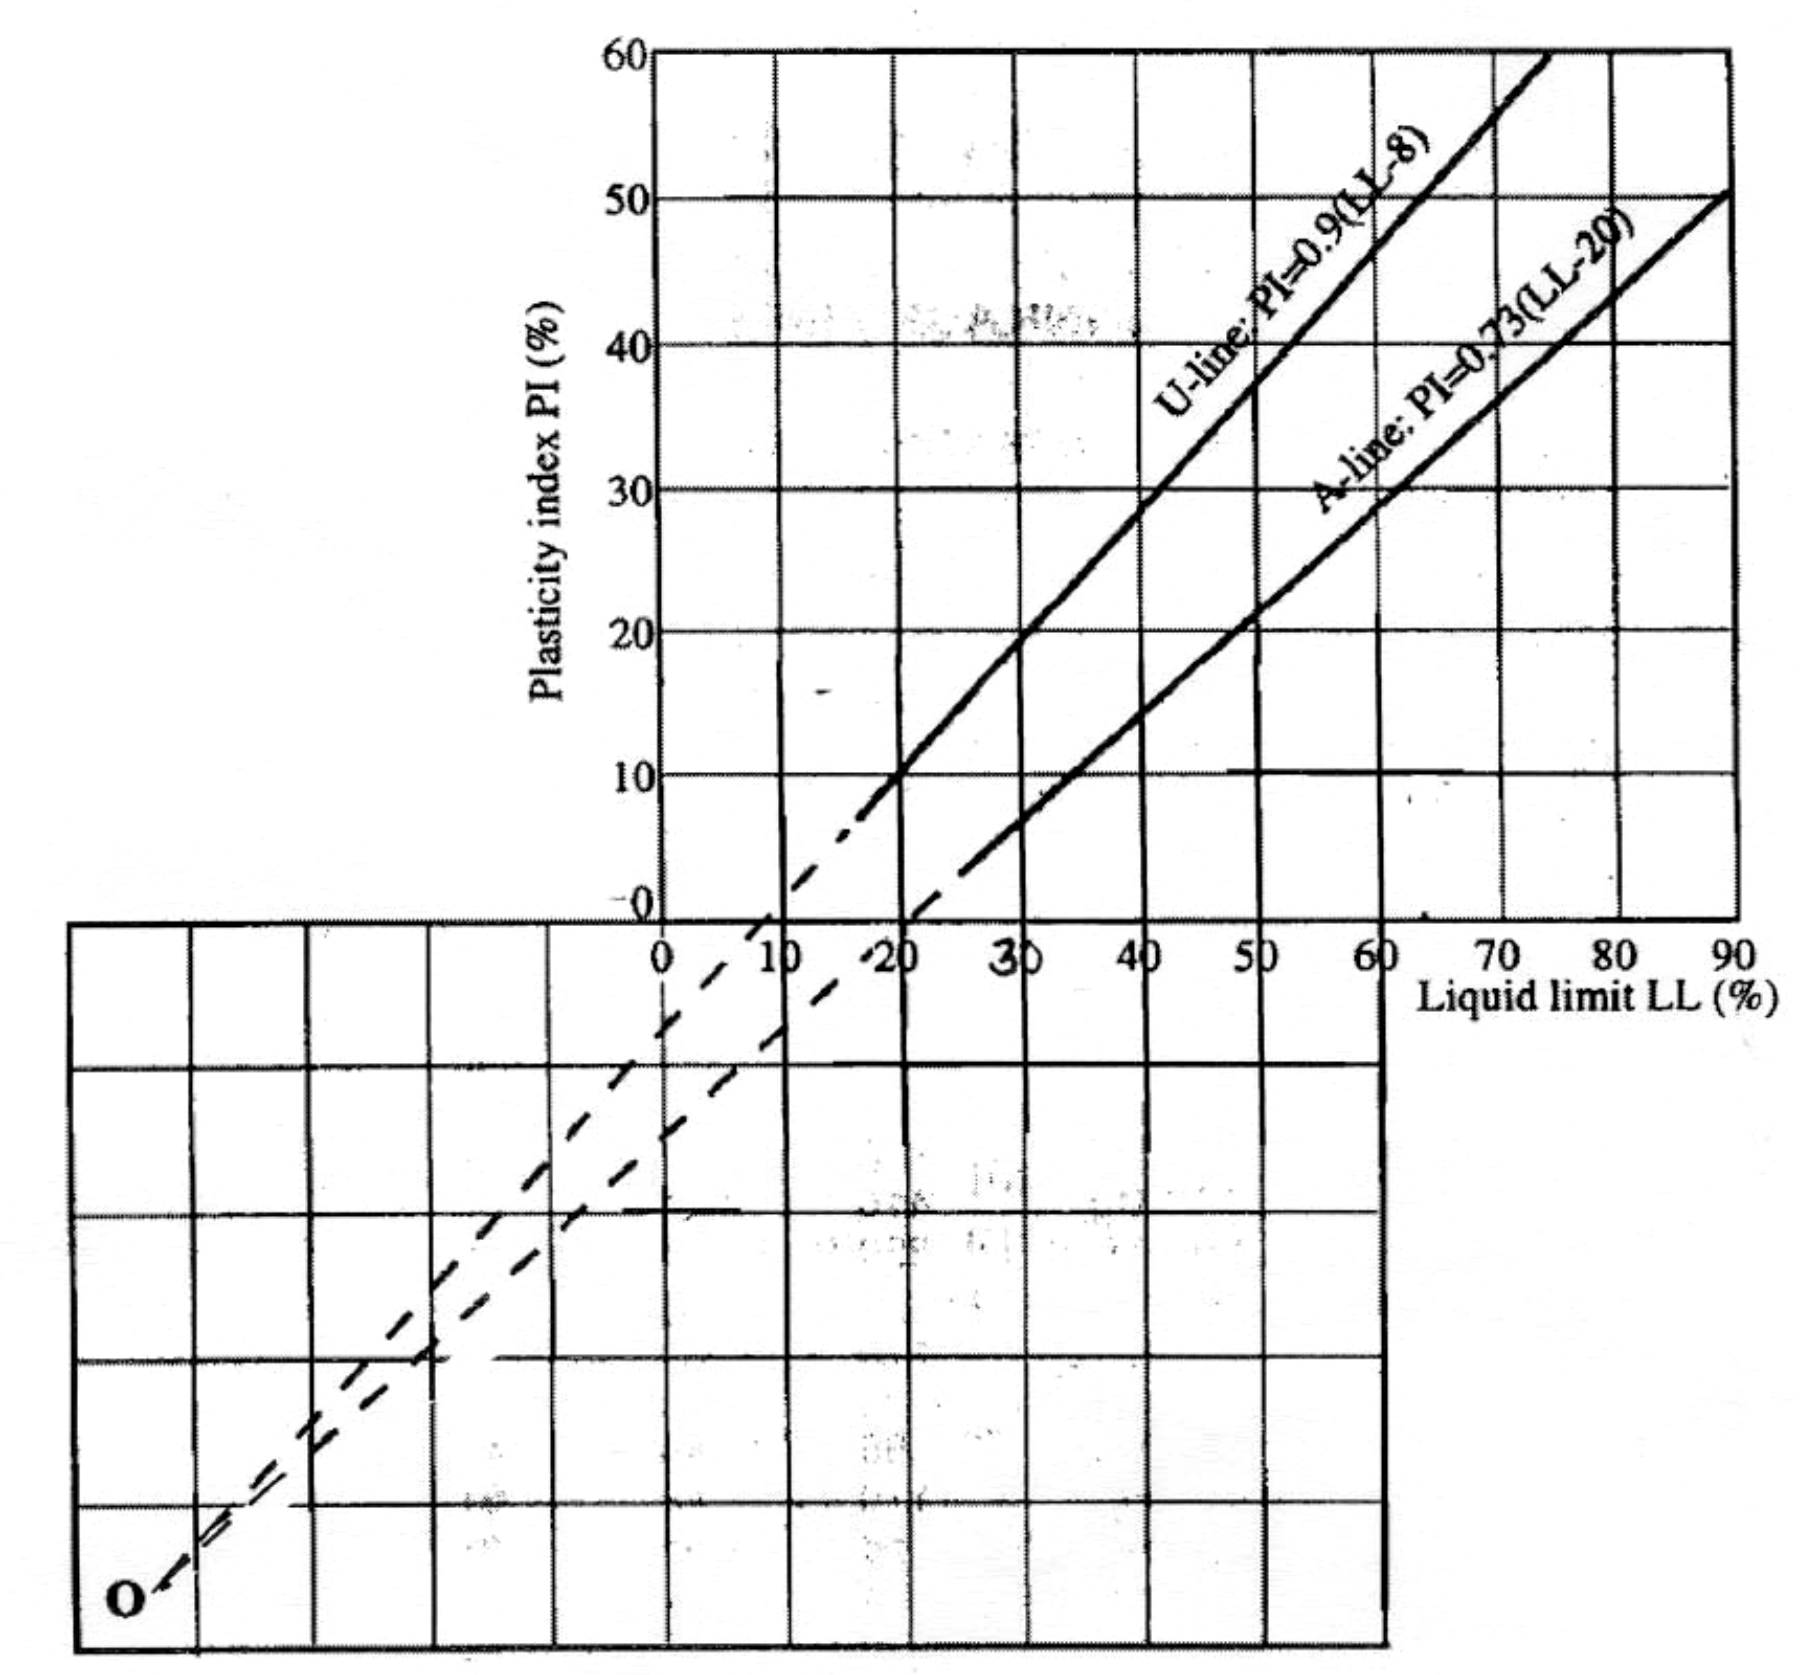
*Use this chart for your results to determine the shrinkage limit.
Report
Use the template provided to prepare your lab report for this experiment. Your report should include the following:
- Objective of the test
- Applications of the test
- Apparatus used
- Test procedures (optional)
- Analysis of test results – Complete the table provided and show one sample calculation.
- Calculate the value for liquid limit, flow index, plastic limit, plasticity index and shrinkage limit.
- Summary and conclusions – Comment on the Atterberg limit values of the given soil sample.
