6 Compaction Test
Introduction
This laboratory test is performed to determine the relationship between the moisture content and the dry density of soil for a specified compaction energy. Compaction energy is the amount of mechanical energy that is applied to the soil mass. Several methods can be used to compact soil in the field, including tamping, kneading, vibration, and static load compaction. This laboratory will employ the tamping or impact compaction method, known as the Proctor test, using the type of equipment and methodology developed by R. R. Proctor in 1933.
Two types of compaction tests are routinely performed: (1) the standard Proctor test, and (2) the modified Proctor test. Each of these tests can be performed by using the three different methods, outlined in Table 6.1. In the standard Proctor test, the soil is compacted by a 5.5 lb. hammer falling from a distance of one foot onto a mold that is filled with three equal layers of soil. Each layer is subjected to 25 drops of the hammer. The modified Proctor test is similar to the standard Proctor test, but the mold is filled with five equal layers of soil instead of three and it employs a 10 lb. hammer that falls from a distance of 18 inches. Two types of compaction molds are used for the testing. The smaller type is 4 inches in diameter and has a volume of about 1/30 ft3 (944 cm3), and the larger type is 6 inches in diameter and has a volume of about 1/13.333 ft3 (2123 cm3). If the larger mold is used each soil layer must receive 56 blows instead of 25 (See Table 6.1).
Table 6.1: Alternative Proctor Test Methods
| Standard Proctor
ASTM 698 |
Modified Proctor
ASTM 1557 |
|||||
| Method A | Method B | Method C | Method A | Method B | Method C | |
| Material | ≤ 20% Retained on No. 4 Sieve | >20% Retained on No. 4
≤ 20% Retained on 3/8″ Sieve |
>20% Retained on No. 3/8″
<30% Retained on 3/4″ Sieve |
≤ 20% Retained on No. 4 Sieve | > 20% Retained on No. 4
≤ 20% Retained on 3/8″ Sieve |
> 20% Retained on No. 3/8″
<30% Retained on 3/4″ Sieve |
| For test sample, use soil passing through | Sieve No. 4 | 3/8″ Sieve | 3/4″ Sieve | Sieve No. 4 | 3/8″ Sieve | 3/4″ Sieve |
| Mold | 4″ Dia | 4″ Dia | 6″ Dia | 4″ Dia | 4″ Dia | 6″ Dia |
| No. of Layers | 3 | 3 | 3 | 5 | 5 | 5 |
| No. of Blows/Layers | 25 | 25 | 56 | 25 | 25 | 56 |
Note: Volume of 4″ diameter mold = 944 cm3 and volume of 6” diameter mold = 2123 cm3; verify these values prior to testing.
Practical Application
- Soil placed as engineering fill (embankments, foundation pads, road bases) is compacted to a dense state to obtain satisfactory engineering properties such as, shear strength, compressibility, or permeability.
- Foundation soils are often compacted to improve their engineering properties.
- Laboratory compaction tests provide the basis for determining the percent of compaction and water content needed to achieve the required engineering properties, and for controlling construction to assure that the required compaction and water contents are achieved.
Objective
The objective of this experiment is:
- To evaluate the maximum dry unit weight, γd(max) and optimum moisture content, wopt, of compaction.
Equipment
- Molds, manual rammer
- Extruder, Balance
- Drying oven
- Mixing pan
- Trowel
- #4 Sieve
- Moisture cans
- Graduated cylinder
- Straight edge
Standard Reference
- ASTM D698: Standard Test Methods for Laboratory Compaction Characteristics of Soil Using Standard Effort
Method
- Put air-dried soil into a large mixing pan (10 lbs. of soil for a 4-inch mold, and 15 lbs. for a 6-inch mold). Pulverize the soil and run it through a \# 4 sieve.
- Use the balance to determine the weight of the soil samples and compaction molds and bases (without the collar), and record the weights.
- Compute the amount of water to add, using the following methods:

- Assume the water content for the first test to be 8 percent.
- Compute the amount of water to be added by using the following equation:
NOTE: The equation for determining the amount of water to add gives the measurement in milliliters, but the soil mass is given in grams. This is not a problem since one gram of water is equal to approximately one milliliter. - Measure the water and add it to the soil. Using a trowel, mix it thoroughly into the soil, until the soil becomes a uniform color.
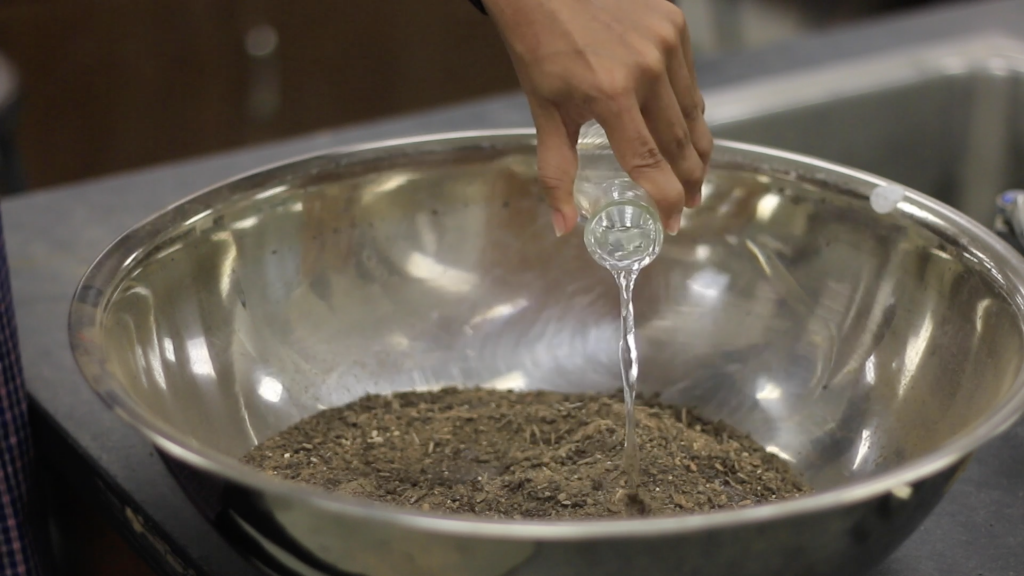
Figure 6.1: Adding water to soil sample 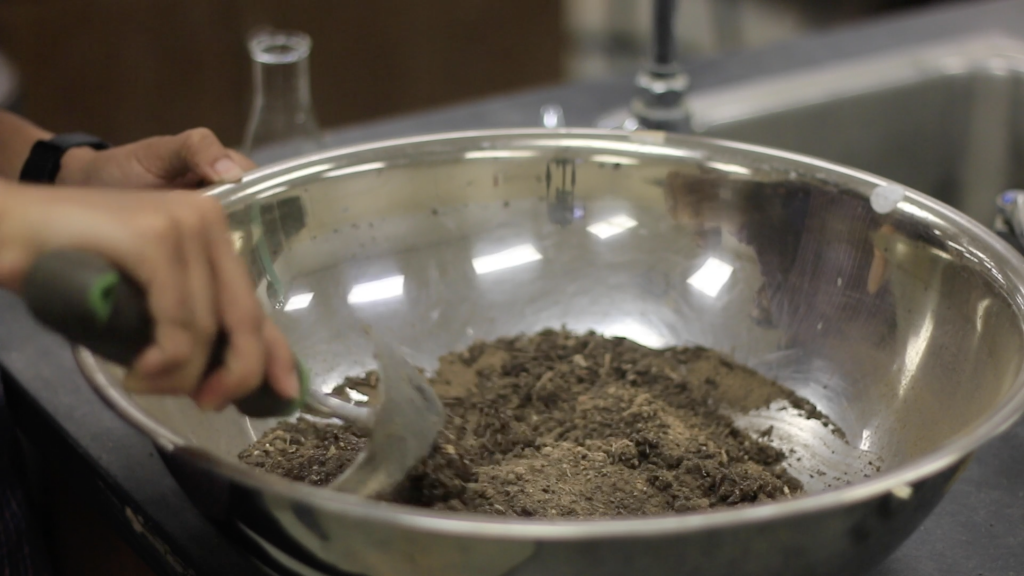
Figure 6.2: Mixing soil with a trowel - Attach the compaction mold to the base, place some soil in the mold and compact the soil into the number of equal layers specified by the type of compaction method employed. The number of drops of the rammer per layer depends on the type of mold used, as shown in Table 6.1. Apply the drops evenly onto the surface of the specimen at a uniform rate of no more than 1.5 seconds per drop. Try to prevent the rammer from rebounding from the top of the guide sleeve.
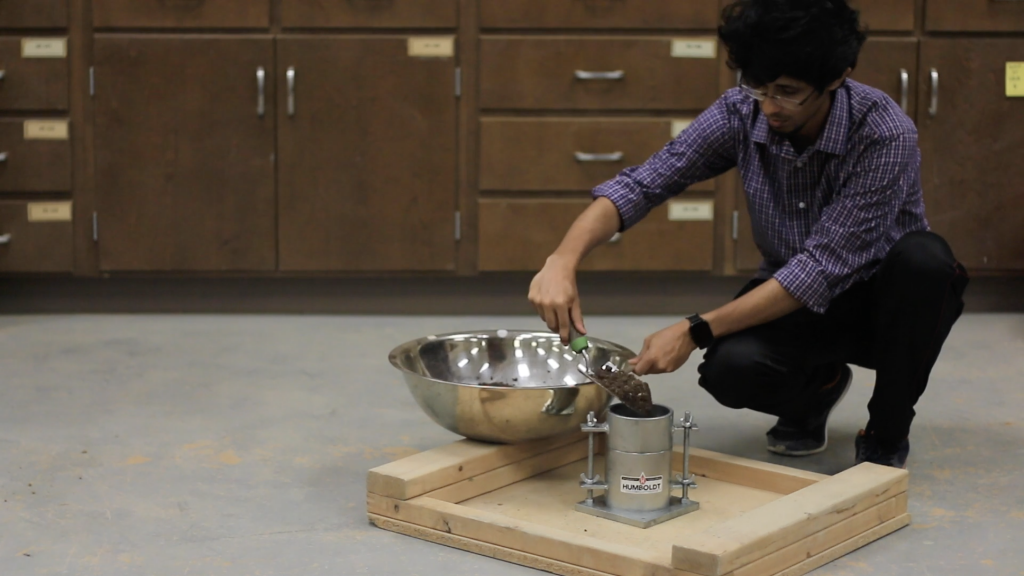
Figure 6.3: Placing the soil sample into standard proctor mold 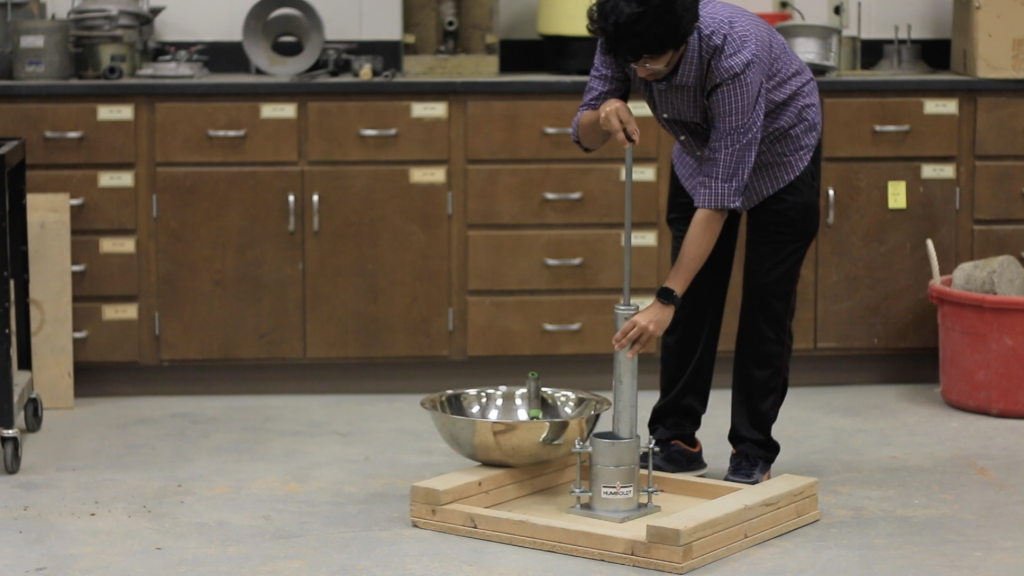
Figure 6.4: Hammering the soil sample - Completely fill the cylinder with the soil, ensuring that the last compacted layer extends slightly above the collar joint. Repeat the test point if the soil is below the collar joint after the completion of the drops. (Note: For the last layer, watch carefully, and add more soil after about 10 drops if it appears that the soil will be compacted below the collar joint.)
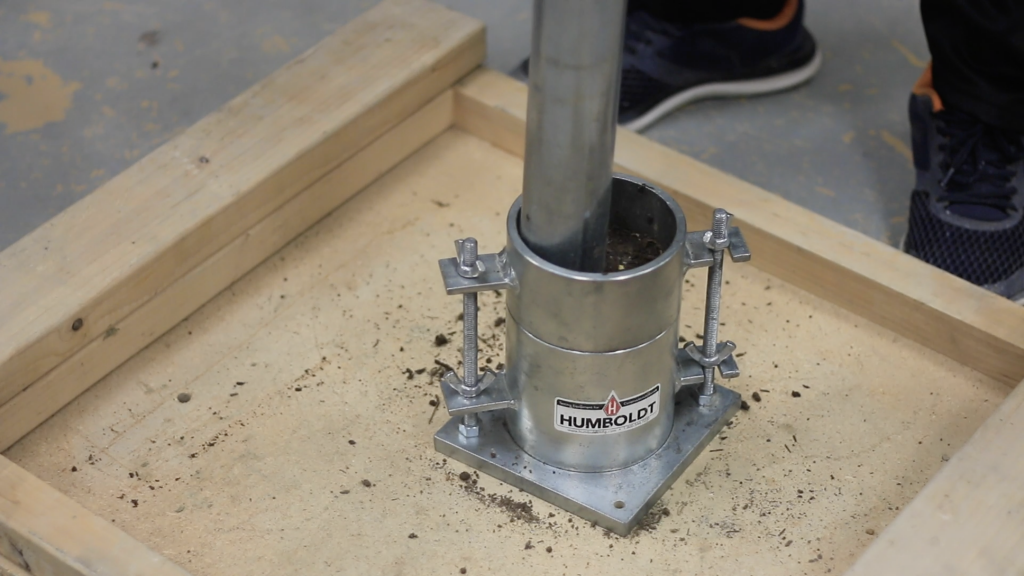
Figure 6.5: Compacting the soil sample at the third layer 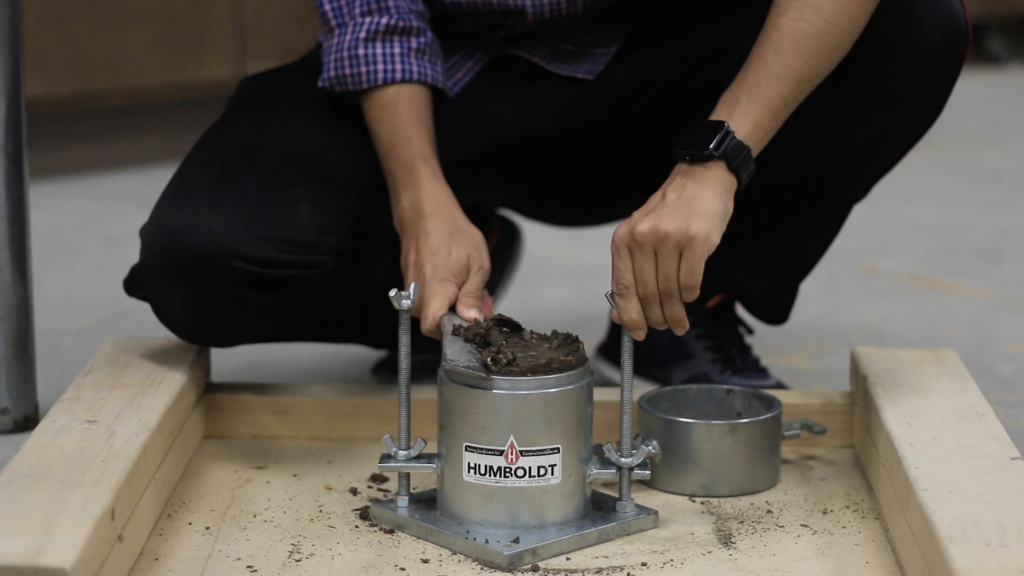
Figure 6.6: Trimming extra soil above the mold with a trowel - Carefully remove the collar and use the trowel to trim off the compacted soil so that it is completely even with the top of the mold. Replace small bits of soil that fall out during the trimming process.
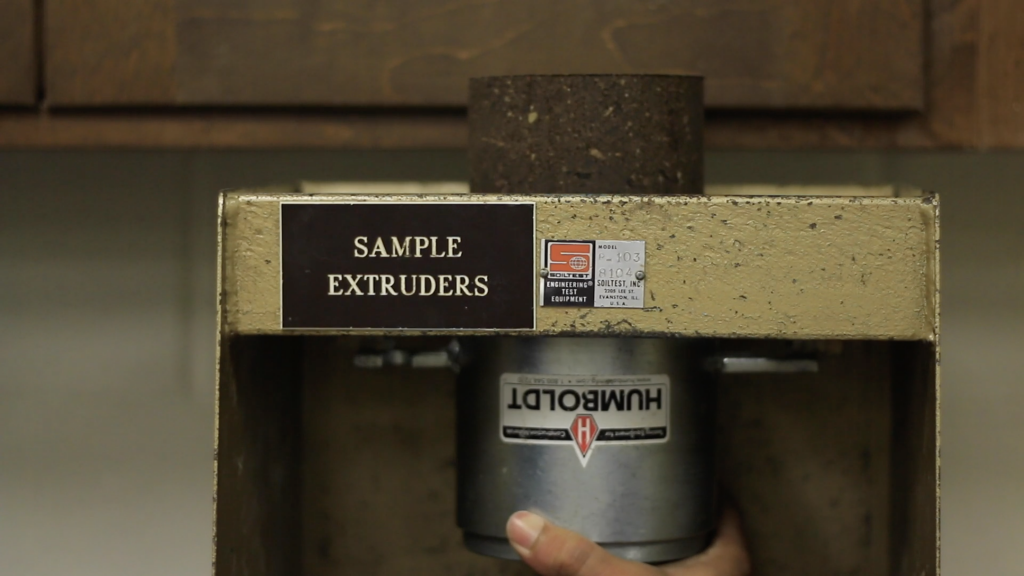
Figure 6.7: Removal of the compacted sample with an extruder 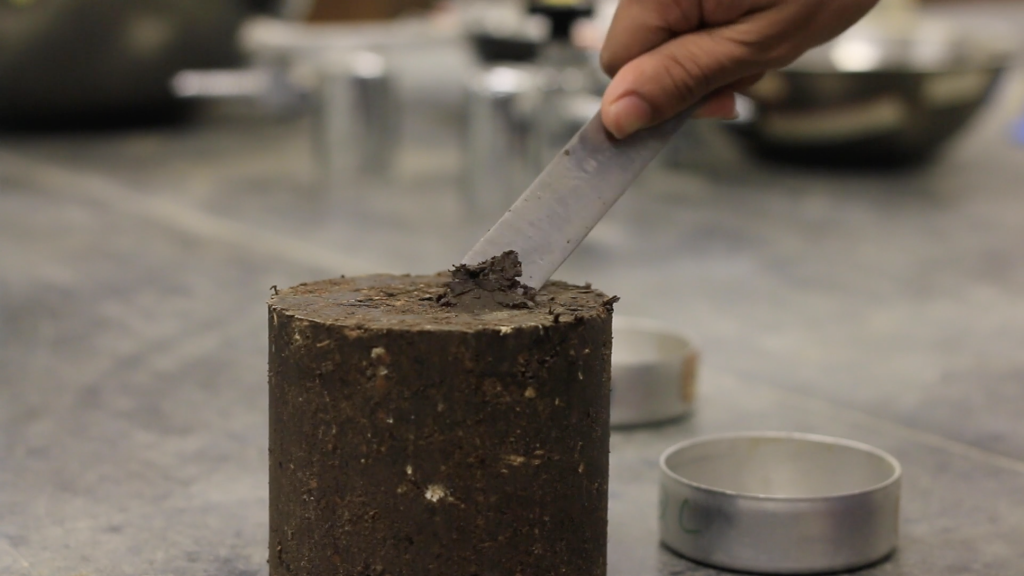
Figure 6.8: Taking specimen for moisture content determination - Weigh the compacted soil while it is in the mold and connected to the base, and record the weight. Determine the wet mass of the soil by subtracting the weight of the mold and base.
- Remove the soil from the mold, using a mechanical extruder, and take soil moisture content samples from the top and bottom of the specimen. Fill the moisture cans with soil and determine the water content.
- Place the soil specimen in the large tray and break up the soil until it appears that it will pass through the #4 sieve. Add 2 percent more water, based on the original sample mass, and re-mix as in step 4. Repeat steps 5 through 9 until, based on wet mass, a peak value is reached, followed by two slightly less compacted soil masses.
Data Analysis
- Calculate the moisture content of each compacted soil specimen by using the average of the two water contents.
- Compute the wet density in grams per $cm^3$ of the compacted soil sample by dividing the wet mass by the volume of the mold that was used.
- Compute the dry density using the wet density and the water content determined in step 1, employing the following formula:

where, w = moisture content in percent divided by 100, and ρ = wet density in grams per cm3.
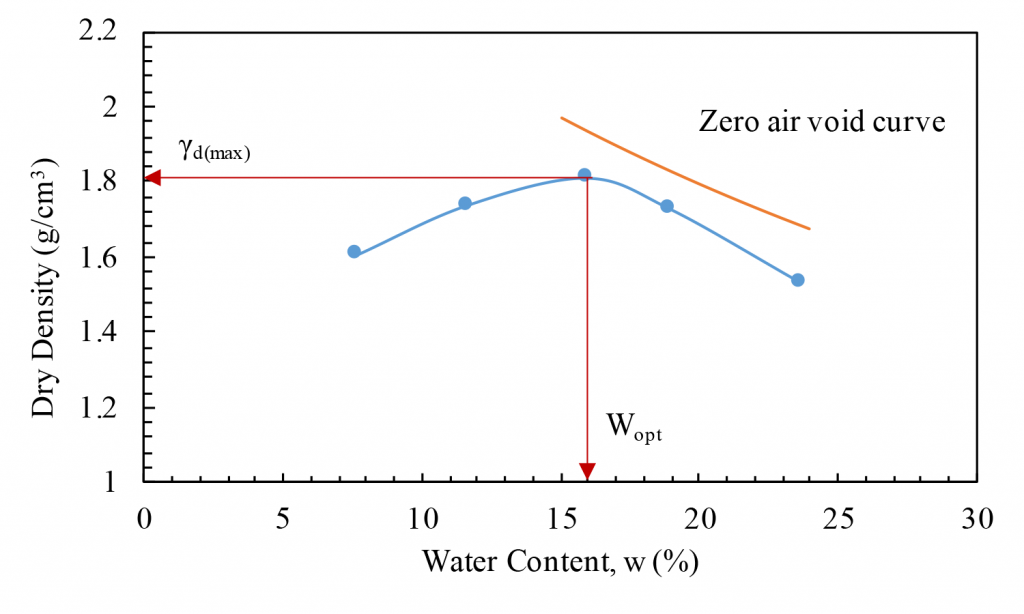
- Plot the dry density values on the y-axis and the moisture contents on the x-axis. Draw a smooth curve connecting the plotted points.
- On the same graph draw a curve of complete saturation or “zero air voids curve”. The values of dry density and corresponding moisture contents for plotting the curve can be computed from the following equation:
where,
ρd = dry density of soil grams per cm3
Gs = specific gravity of the soil being tested (assume 2.70 if not given)
ρw = density of water in grams per cm3 (approximately 1 g/cm3)
wsat = moisture content in percent for complete saturation
Example Calculations:
Gs = 2.7 (given)
ρw = 1.0 g/cm3

- Identify and report the optimum moisture content and the maximum dry density. Make sure that you have recorded the method of compaction used on the data sheet (e.g., standard Proctor, Method A.)
Video Materials
Lecture Video
A PowerPoint presentation is created to understand the background and method of this experiment.
Demonstration Video
A short video is executed to demonstrate the experiment procedure and sample calculation.
Results and Discussions
Sample Data Sheet
Soil type: Low plastic clay (CL)
Specific gravity of soil, Gs = 2.8
Water Content Determination

Density Determination
Volume of the mold = 944 cm3

From Figure 6.9 Maximum dry unit weight, γd(max) = 1.81 g/cm3
Optimum moisture content, wopt = 15.9 %
Blank Data Sheet
Soil type: Low plastic clay (CL)
Specific Gravity of soil, Gs = 2.8
Water Content Determination

Density Determination
Volume of the mold = 944 cm3

Report
- Objective of the test
- Applications of the test
- Apparatus used
- Test procedures (optional)
- Analysis of test results – Complete the table provided and show one sample calculation. Determine the optimum moisture content and the maximum dry density of the given soil sample.
- Summary and conclusions – Comment on the optimum moisture content and maximum dry density of the given soil sample
