9 Direct Shear Test
Introduction
Shear strength is defined as the maximum resistance that a material can withstand when subjected to shearing, and the direct shear test is an experimental procedure that is used to determine the shear strength of soil materials. It is one of the simplest, most common, quickest, and inexpensive tests implemented to derive the strength of a soil. It can be carried out on undisturbed or remolded samples and is often used when a quick and rough estimate is needed. It cannot, however, provide the actual scenario of the shear strength of a soil sample because the failure plane is forced to occur at the predetermined joint in the shear box, which may not be the weakest plate. Consequently, triaxial tests, rather than direct shear tests, are often performed for important projects where the accurate estimation of shear strength parameters is important.
Practical Application
Estimation of shear strength is needed for engineering situations such as assessing the stability of slopes or cuts, finding the bearing capacity of foundations, and determining the earth pressure exerted by a soil on a retaining wall.
Objective
The objective of this experiment is
- To estimate the angle of friction and cohesion of soils
Equipment
- Direct shear device
- Load and deformation dial gauges
- Calipers
- Balance
Standard Reference
ASTM D3080: Standard Test Method for Direct Shear Test of Soils Under Consolidated Drained Conditions.
Method
- Weigh the initial mass of soil in the pan.
- Measure the diameter and height of the shear box. Compute 15% of the diameter in millimeters.
- Carefully assemble the shear box and place it in the direct shear device, then place a porous stone and a filter paper in the shear box.
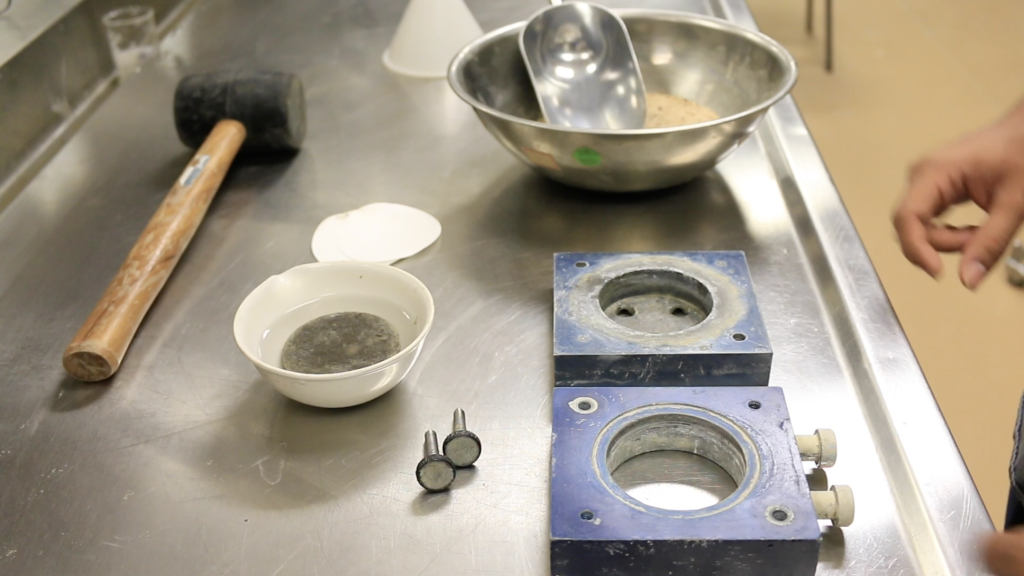
Figure 9.1: Shear box apparatus - Place the sand into the shear box and level off the top. Place a filter paper, a porous stone, and a top plate (with ball) on top of the sand.
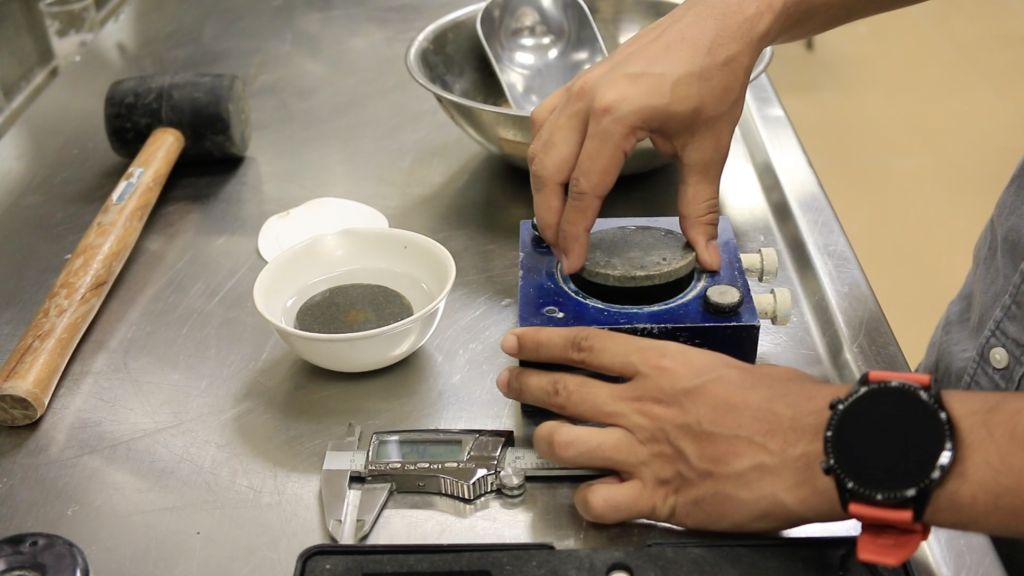
Figure 9.2: Shear box assembly in the direct shear device 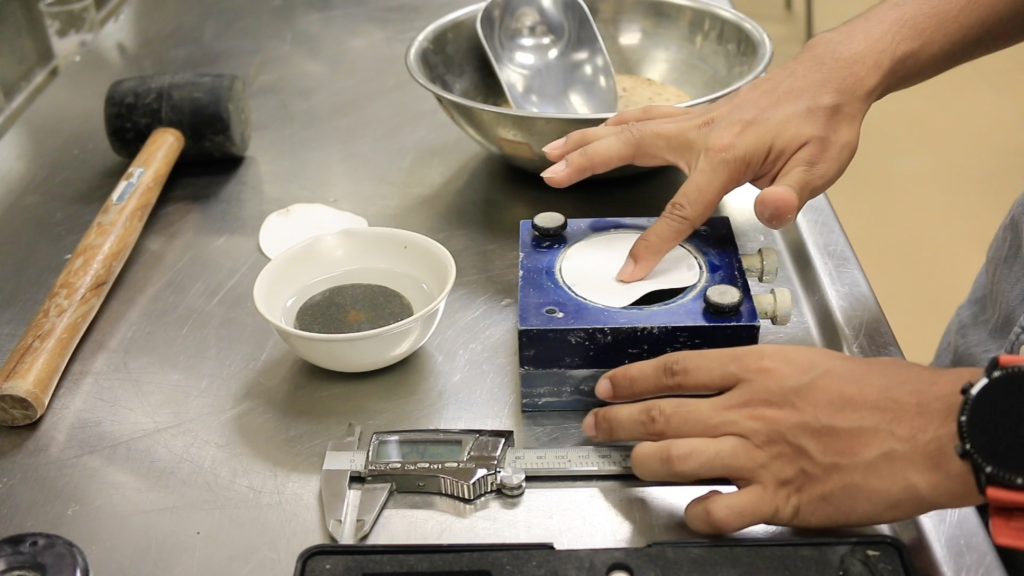
Figure 9.3: Placing filter paper - Remove the large alignment screws from the shear box. Using the gap screws, open the gap between the shear box halves to approximately 0.025 in., and then back out the gap screws.
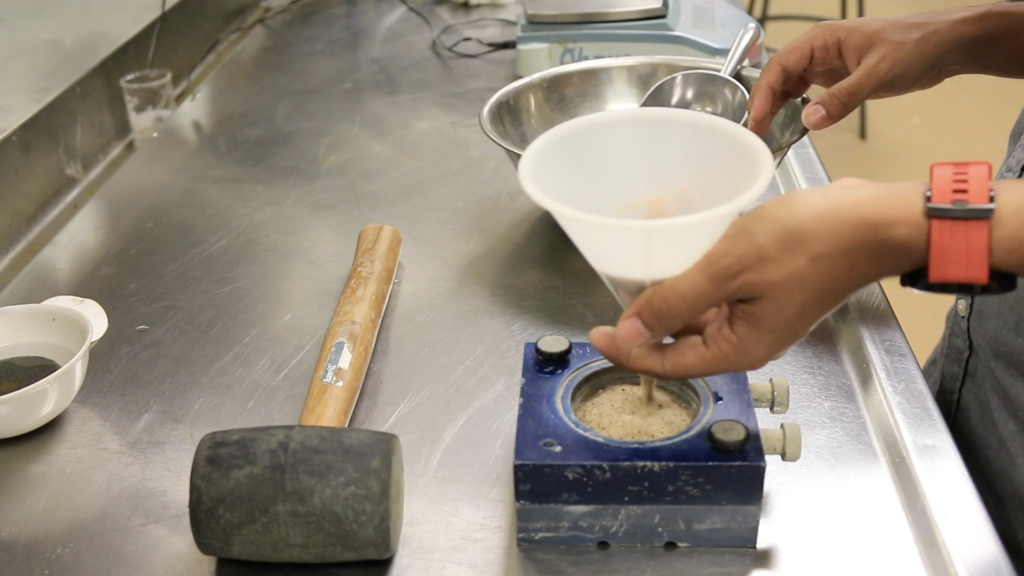
Figure 9.4: Pouring sand - Weigh the pan of soil again and compute the mass of soil used.
- Complete the assembly of the direct shear device and initialize the three gauges (horizontal displacement gage, vertical displacement gage and shear load gage) to zero.
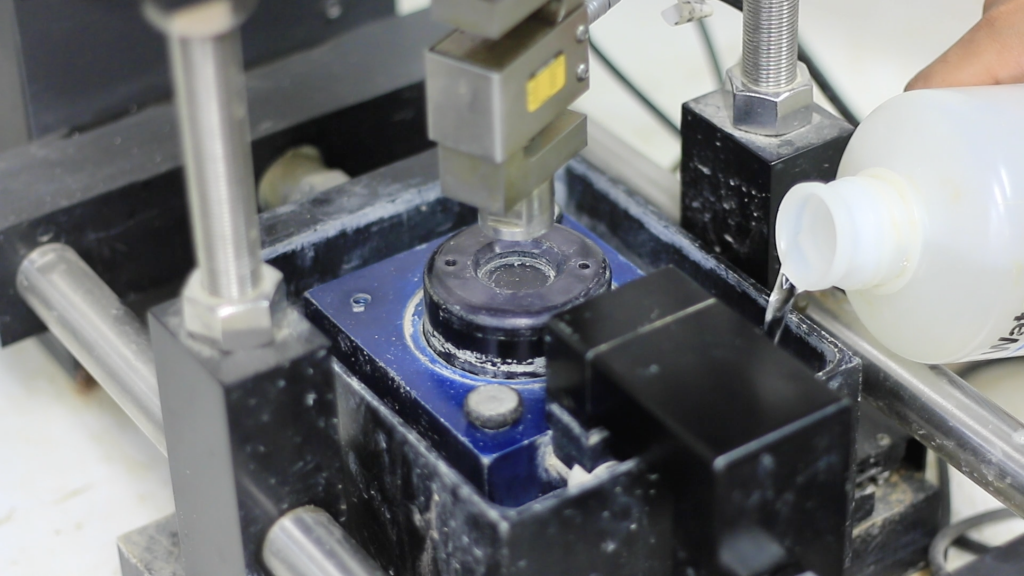
Figure 9.5: Direct shear device - Set the vertical load (or pressure) to a predetermined value, and then close the bleeder valve and apply the load to the soil specimen by raising the toggle switch.
- Start the motor at the selected speed so that the rate of shearing is at a selected constant rate, and take the horizontal displacement gauge, vertical displacement gage, and shear load gage readings. Record the readings on the data sheet. (Note: Record the vertical displacement gage readings, if needed.)
- Continue taking readings until the horizontal shear load peaks and then falls, or the horizontal displacement reaches 15% of the diameter.
Video Materials
Lecture Video
A PowerPoint presentation is created to understand the background and method of this experiment.
Demonstration Video
A short video is executed to demonstrate the experiment procedure and sample calculation.
Results and Discussions
Sample Data Sheet
Height of sample (H0) =1 in
Diameter of sample (d0) = 2.5 in
Area of sample (A0) = 4.9087 in2
Volume, (V0) = 80.4398 cm3
Specific gravity, Gs = 2.67
Calibration factor for proving dial: 0.30239 lb/0.0001 inch +0.20636
Table 9.1: Data sheet for normal stress 14.3 psi

Table 9.2: Data sheet for normal stress 28.9 psi

Table 9.3: Data sheet for normal stress 43.5 psi

-
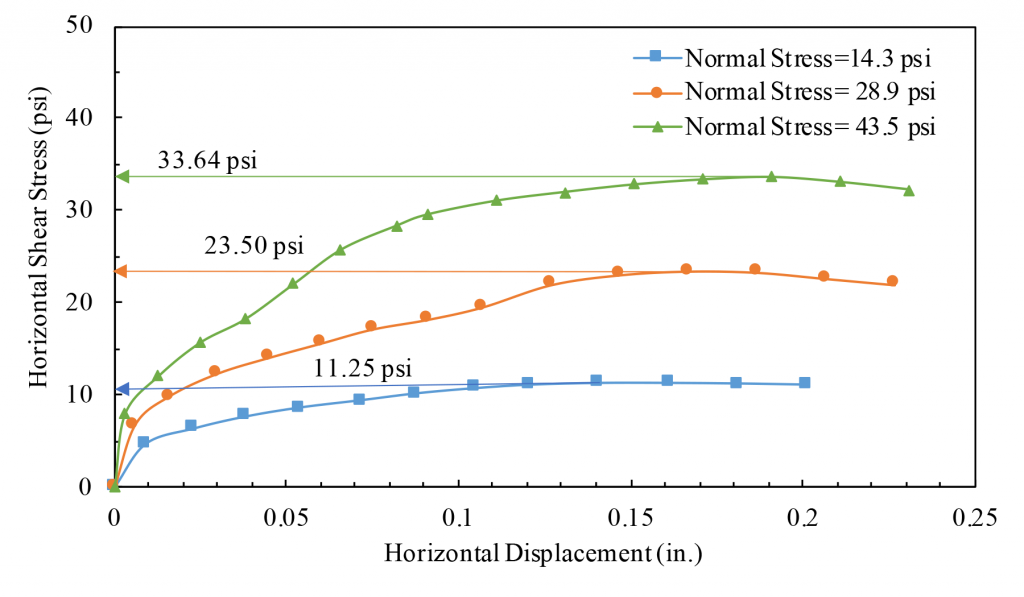
Figure 9.6: Variation of shear stress with displacement for different normal stress conditions 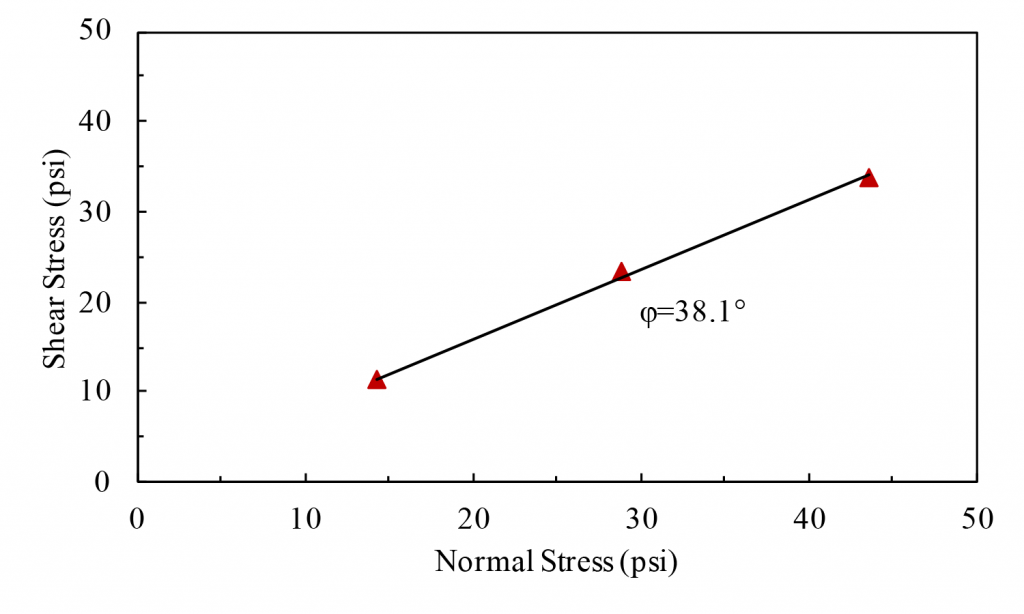
Figure 9.7: Shear stress vs normal stress plot
Report
Use the template provided to prepare your lab report for this experiment. Your report should include the following:
- Objective of the test
- Applications of the test
- Apparatus used
- Test procedures (optional)
- Analysis of test results – Complete the table provided and show one sample calculation. Determine the cohesion and angle of internal friction of the given soil sample.
- Summary and conclusions – Comment on the shear strength parameter of the tested soil.
