8 Permeability Test
Introduction
Soil permeability (hydraulic conductivity) is the rate at which water flows through soil materials. It is an essential characteristic across a broad spectrum of engineering and earth-science disciplines. The coefficient of permeability (k) is a constant of proportionality relating to the ease with which fluid passes through a porous medium.
Two general types of permeability test methods are routinely performed in the laboratory: (1) the constant head test method, and (2) the falling head test method. The constant head test method is used for cohesionless and more permeable soils (k>10-4 cm/s) and the falling head test is mainly used for cohesive or less permeable soils (k<10-4 cm/s). The constant head permeability method is espoused in this manual for determining the permeability of sandy soil.
Practical Application
- Data related to the permeability of soil is necessary for calculating the amount of seepage through earthen dams or under sheet pile walls, the seepage rate from waste storage facilities (landfills, ponds, etc.), and the settlement of clayey soil deposits.
- Geotechnical and civil engineers, hydrogeologists, and soil and environmental scientists use this information for projects such as structural foundations, embankments, earthen dams, flood management, effluent infiltration, and more.
Objective
The objective of this experiment is
- To determine the permeability of sandy soil
Equipment
- Permeameter
- Tamper, balance
- Scoop
- 1000 mL
- Graduated cylinders
- Watch (or stopwatch)
- Thermometer
- Filter paper
Standard Reference
- ASTM D2434: Standard Test Method for Permeability of Granular Soils (Constant Head).
Method
- Measure the initial mass of the pan along with the dry soil (M1). Remove the cap and upper chamber of the permeameter by unscrewing the knurled cap nuts and lifting them off the tie rods. Measure the inside diameter of the upper and lower chambers. Calculate the average inside diameter of the permeameter (D).
- Place one porous stone on the inner support ring in the base of the chamber then place a filter paper on top of the porous stone.
- Mix the soil with enough distilled water to prevent the particle sizes from segregating while they are being placed into the permeameter. Add enough water that the mixture can flow freely. Using a scoop in a circular motion to form a uniform layer, pour the prepared soil into the lower chamber, filling it to a depth of 1.5 cm.
- Use the tamping device to compact the layer of soil, applying approximately ten rams of the tamper per layer, and provide uniform coverage of the soil surface. Repeat the compaction procedure until the soil is within 2 cm. of the top of the lower chamber section.
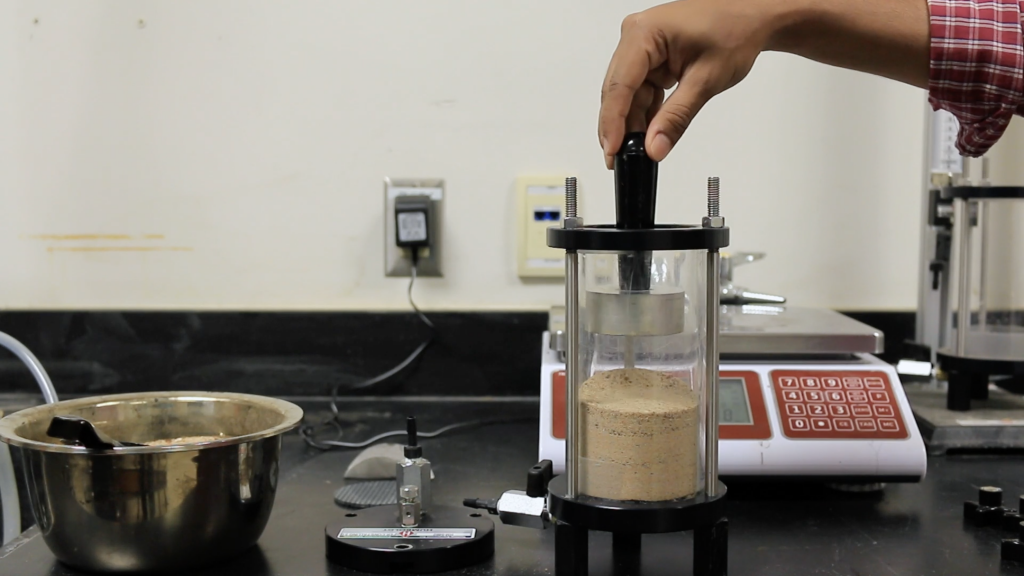
Figure 8.1: Compacting the soil sample in the permeability mold - Replace the upper chamber section, being sure to place the rubber gasket between the chamber sections. Be careful not to disturb the soil that has already been compacted. Continue the placement operation until the level of the soil is about 2 cm. below the rim of the upper chamber. Level the top surface of the soil, place a filter paper on it, and then put the upper porous stone on top.
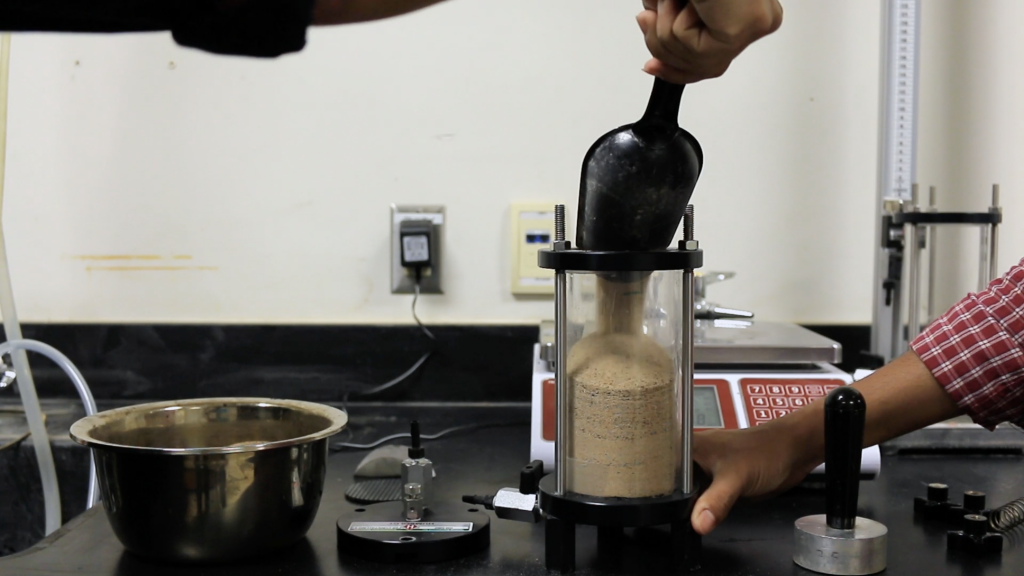
Figure 8.2: Filling the permeability mold in three layers - Place the compression spring on the porous stone and replace the chamber cap and its sealing gasket. Secure the cap firmly with the cap nuts.
- Measure the sample length at four locations around the circumference of the permeameter, compute the average length, and record it as the sample length.
- Keep the pan with the remaining soil in the drying oven.
- Adjust the level of the funnel to allow the constant water level in it to remain a few inches above the top of the soil.
- Connect the flexible tube from the tail of the funnel to the bottom outlet of the permeameter and keep the valves on top of the permeameter open. Run tubing from the top outlet to the sink to collect any water that is emitted. Open the bottom valve and allow the water to flow into the permeameter.
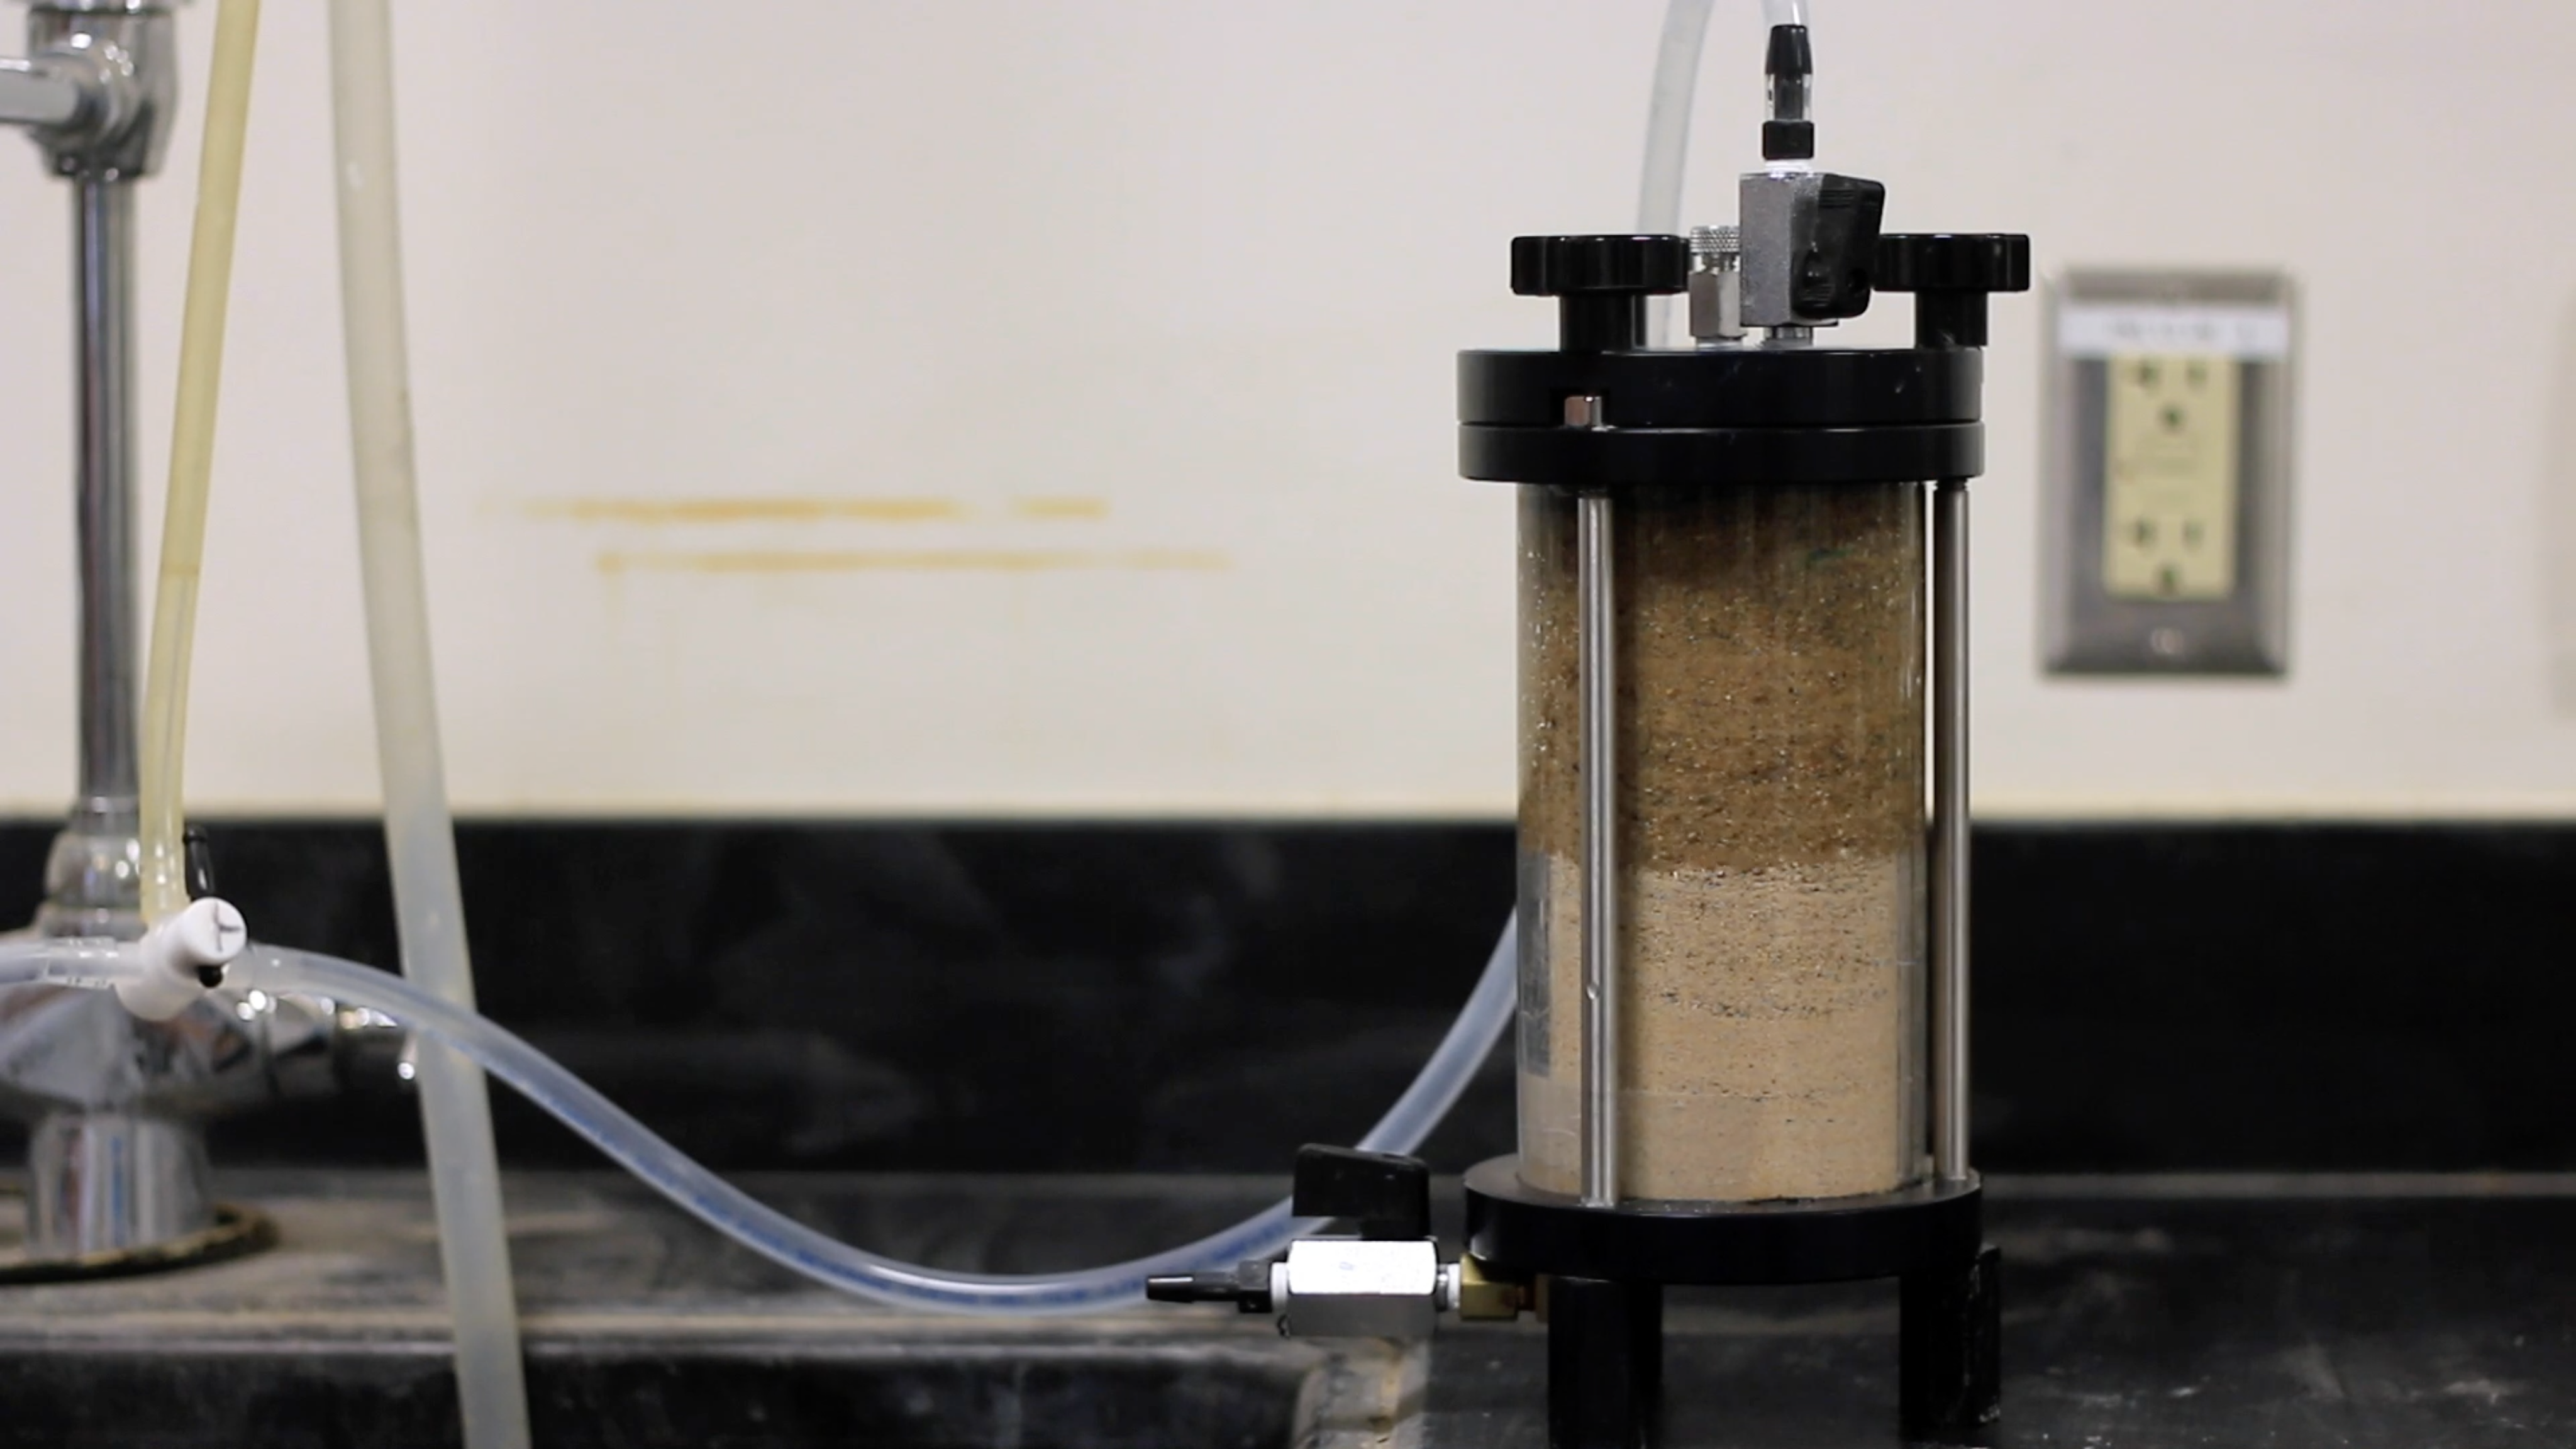
Figure 8.3: Soil sample is being saturated - As soon as the water begins to flow out of the top control (de-airing) valve, close the control valve, letting water flow out of the outlet for some time. Close the bottom outlet valve and disconnect the tubing at the bottom. Connect the funnel tubing to the top side port.
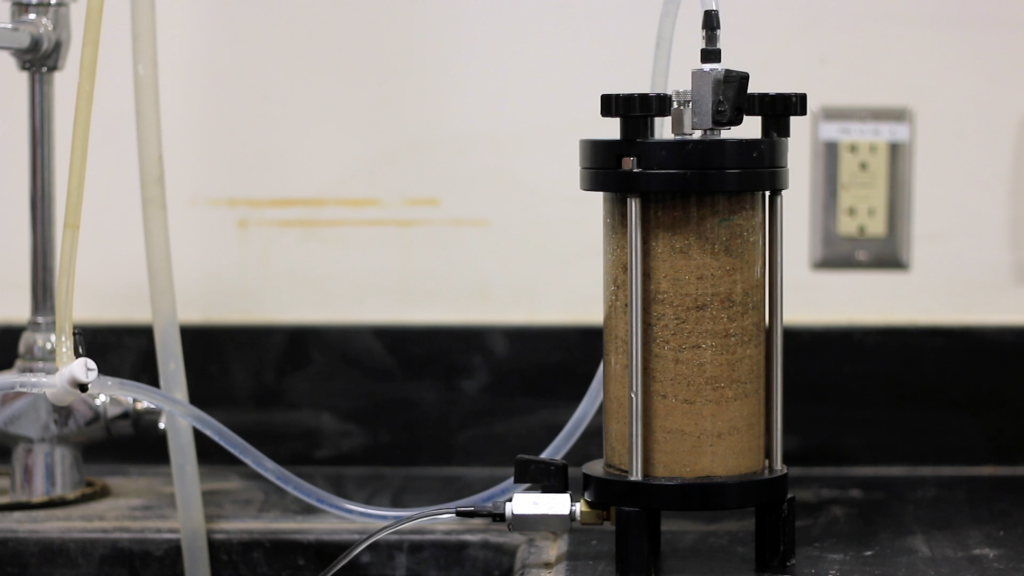
Figure 8.4: Saturated soil sample - Open the bottom outlet valve and raise the funnel to a convenient height to get a reasonably steady flow of water. Allow adequate time for the flow pattern to stabilize.
- Measure the time it takes to fill a volume of 750 – 1000 mL using the graduated cylinder, and then measure the temperature of the water. Repeat this process three times and compute the average time, average volume, and average temperature. Record the values as t, Q, and T, respectively.
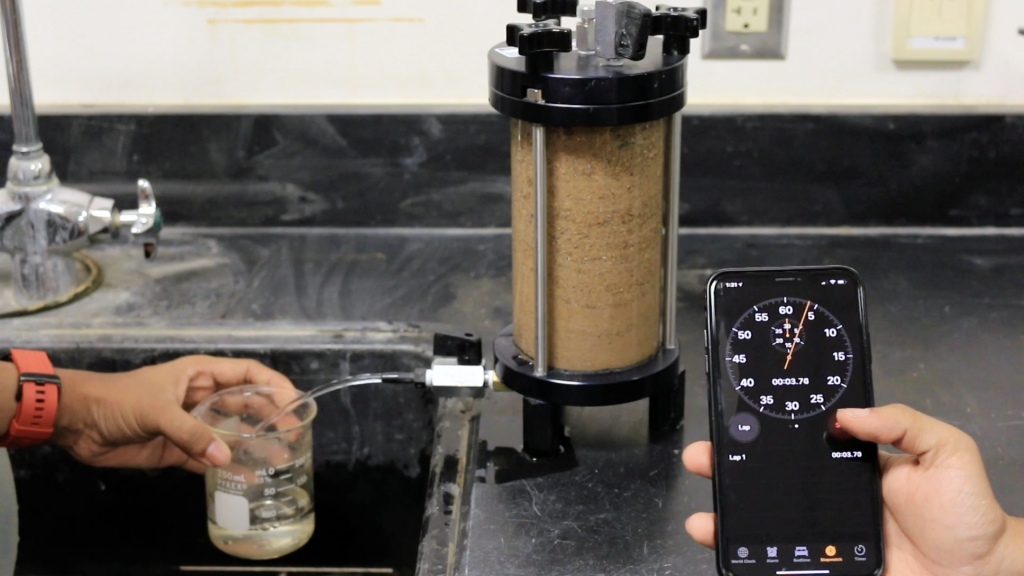
Figure 8.5: Measuring the volume of the water with time - Measure the vertical distance between the funnel head level and the chamber outflow level, and record the distance as H.
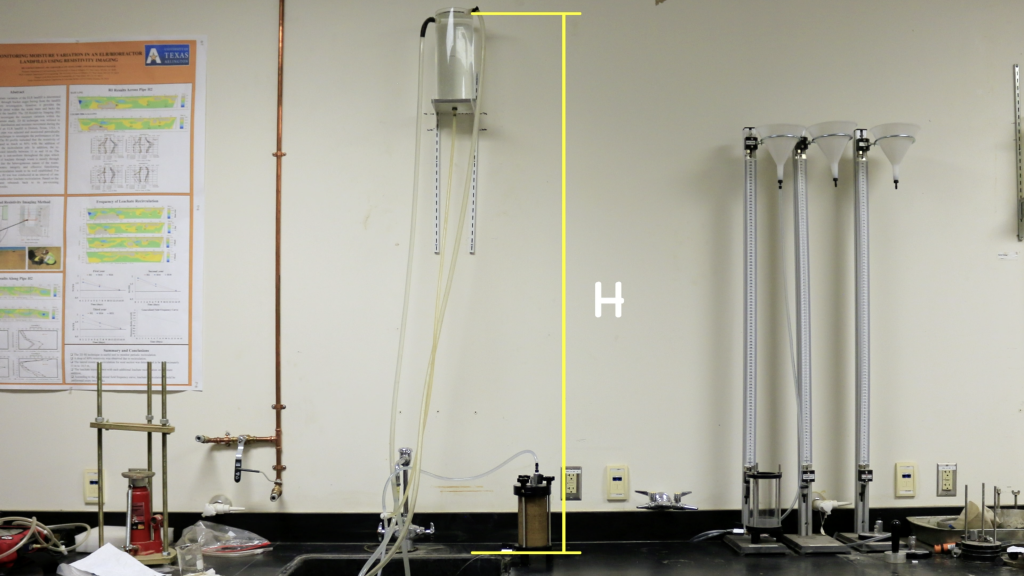
Figure 8.6: Head difference between the top of the water source and exit point of the permeability apparatus - Remove the pan from the drying oven and measure the final mass of the pan along with the dry soil (M2).
Video Materials
Lecture Video
A PowerPoint presentation is created to understand the background and method of this experiment.
Demonstration Video
A short video is executed to demonstrate the experiment procedure and sample calculation.
Results and Discussions
Sample calculation
Calculate the permeability, using the following equation:

Where,
KT = coefficient of permeability at temperature T, cm/sec.
L = length of the specimen in centimeters
t = time for discharge in seconds
Q = volume of discharge in cm3 (assume 1 mL = 1 cm3)
A = cross-sectional area of permeameter
h = hydraulic head difference across length L, in cm of water;
The viscosity of the water changes with the temperature. As the temperature increases, the viscosity decreases and the permeability increases. The coefficient of permeability is standardized at 20°C, and the permeability at any temperature, T, is related to K20 by the following ratio:
K20=KT ×ηT/η20
Where,
ηT and η20 are the viscosities at the temperature T of the test and at 20° C, respectively.
Compute the volume of soil used from, V = LA.
Compute the mass of dry soil used in the permeameter (M) = initial mass – final mass:
M = M1-M2
Compute the dry density (γd) of soil
γd= M/V
Table 8.1: Properties of Distilled water (η= absolute)

Sample Data Sheet
Initial dry mass of Soil + Pan (M1) = 1675.0 g
Length of Soil Specimen, L = 17 cm
Diameter of the Soil Specimen (Permeameter), D = 6.4 cm
Final Dry Mass of Soil + Pan (M2) = 865.6 g
Dry Mass of Soil Specimen (M)= 809.4 g
Volume of Soil Specimen (V) = 846.9 cm3
Dry Density of Soil (γd) = 1.48 g/cm3
![\begin{tabular}{|c|c|c|c|c|c|c|} \hline Trial Number & \begin{tabular}[c]{@{}c@{}}Constant Head, h\\ \\ (cm)\end{tabular} & \begin{tabular}[c]{@{}c@{}}Elapsed Time, t\\ \\ (seconds)\end{tabular} & \begin{tabular}[c]{@{}c@{}}Outflow Volume, Q\\ \\ ($cm^3$)\end{tabular} & \begin{tabular}[c]{@{}c@{}}Water Temp., T\\ \\ (C)\end{tabular} & \begin{tabular}[c]{@{}c@{}}$K_T$\\ \\ cm/sec\end{tabular} & \begin{tabular}[c]{@{}c@{}}$K_{20}$ \\ \\ cm/sec\end{tabular} \\ \hline 1 & 30 & 84 & 750 & 22 & 0.157 & 0.149 \\ \hline 2 & 50 & 55 & 750 & 22 & 0.144 & 0.137 \\ \hline 3 & 60 & 48 & 750 & 22 & 0.137 & 0.130 \\ \hline 4 & 70 & 38 & 750 & 22 & 0.149 & 0.142 \\ \hline \end{tabular}](https://uta.pressbooks.pub/app/uploads/quicklatex/quicklatex.com-df3d60f4addae807a28ad5c63ab7a590_l3.png "Rendered by QuickLaTeX.com")
Average K20 = 0.139 cm/sec
Blank Data Sheet
Initial dry mass of Soil + Pan (M1) =
Length of Soil Specimen, L =
Diameter of the Soil Specimen (Permeameter), D =
Final Dry Mass of Soil + Pan (M2) =
Dry Mass of Soil Specimen (M)=
Volume of Soil Specimen (V) =
Dry Density of Soil (γd) =
![\begin{tabular}{|c|c|c|c|c|c|c|} \hline Trial Number & Constant Head, h & Elapsed Time, t & Outflow Volume, Q & Water Temp., T & \begin{tabular}[c]{@{}c@{}}$K_T$\\ \\ cm/sec\end{tabular} & \begin{tabular}[c]{@{}c@{}}$K_{20}$ \\ \\ cm/sec\end{tabular} \\ \hline & & & & & & \\ \hline & & & & & & \\ \hline & & & & & & \\ \hline & & & & & & \\ \hline \end{tabular}](https://uta.pressbooks.pub/app/uploads/quicklatex/quicklatex.com-f8d8317e7b4e7e6b9dcd06b6c6c8264e_l3.png "Rendered by QuickLaTeX.com")
Average K20 =
Report
Use the template provided to prepare your lab report for this experiment. Your report should include the following:
- Objective of the test
- Applications of the test
- Apparatus used
- Test procedures (optional)
- Analysis of test results – Complete the table provided and show one sample calculation. Determine the permeability of the given soil sample at 20°C.
- Summary and conclusions – Comment on the permeability of the soil sample based on the range of k for different types of soil.
