12 Consolidation Test
Introduction
Soil consolidation refers to the process by which the volume of a partially or fully saturated soil decreases due to an applied stress. When a load is applied to a low permeability soil, it is initially carried by the water that exists in the porous saturated soil and result in a rapid increase of pore water pressure. This excess pore water pressure is dissipated as water drains away from the soil’s voids and the pressure is transferred to the soil skeleton, which is gradually compressed, resulting in settlements. The consolidation procedure lasts until the excess pore water pressure is dissipated.
Practical Application
The consolidation properties determined from the consolidation test are used to estimate the magnitude and rate of both primary and secondary consolidation settlement of a structure or an earth fill.
Estimates of this type are of key importance in the design of engineered structures and the evaluation of their performance.
Objective
The objective of this experiment is
- To determine the consolidation parameters of soil for estimating the magnitude of settlement.
Equipment
- Consolidation device (including ring, porous stones, water reservoir, and load plate)
- Dial gauge (0.0001 inch = 1.0 on dial)
- Sample trimming device
- Glass plate,
- Metal straight edge
- Clock
- Moisture can
- Filter paper
Standard Reference
- ASTM D2435: Standard Test Methods for One-Dimensional Consolidation Properties of Soils Using Incremental Loading
Method
- Weigh the empty consolidation ring with the glass plate.
- Measure the height (h) of the ring and its inside diameter (d).
- Extrude the soil sample from the sampler, generally thin-walled Shelby tube. Determine the initial moisture content and the specific gravity of the soil.
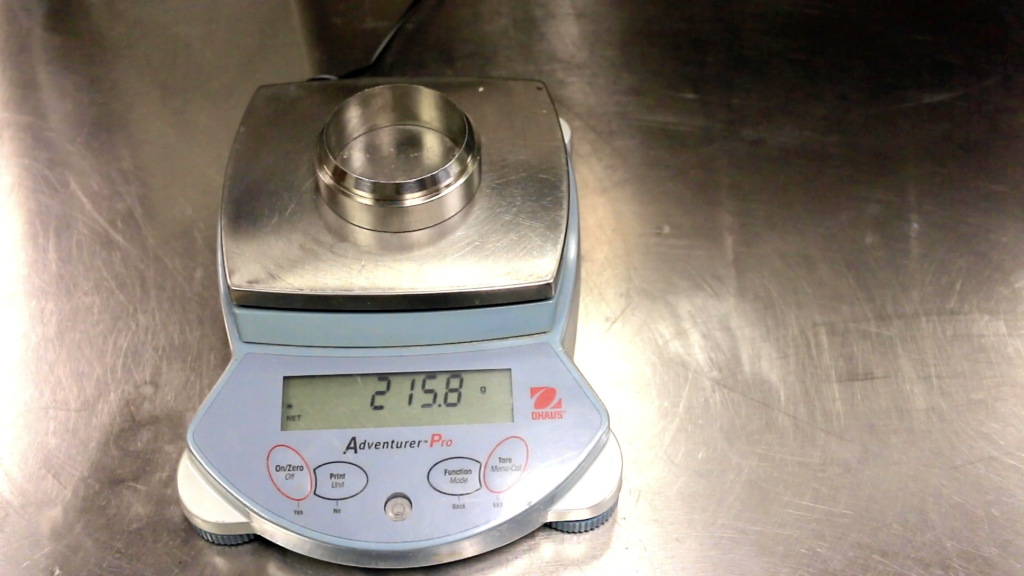
Figure 12.1: Weight of the ring - Cut an approximate a three-inch long sample. Place the sample on the consolidation ring and cut the sides of the sample to be approximately the same as the outside diameter of the ring. Rotate the ring and pare off the excess soil with the cutting tool so that the sample is reduced to the same inside diameter of the ring. It is important to keep the cutting tool in the correct horizontal position during this process.
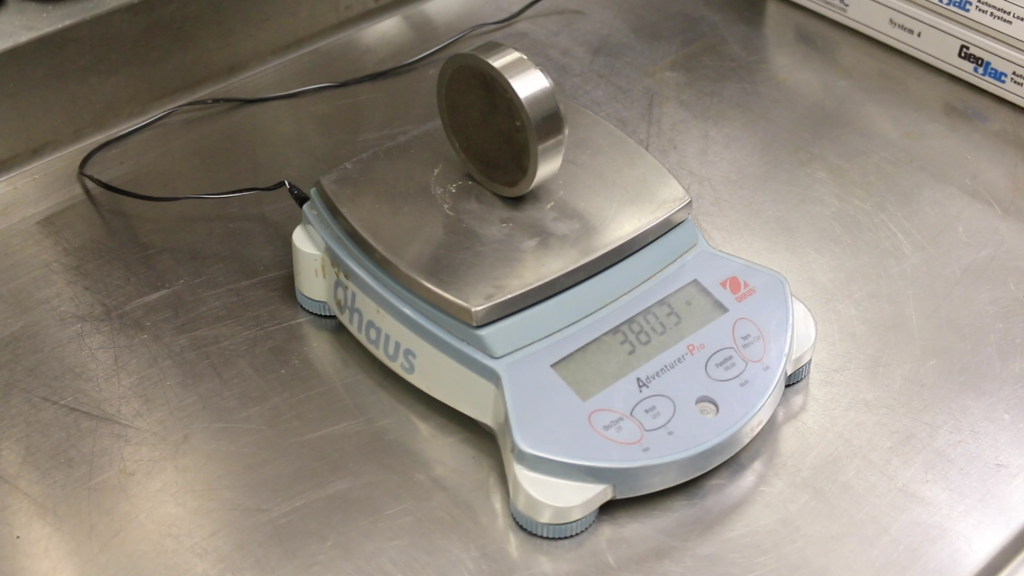
Figure 12.2: Weight of the ring + sample - As the trimming progresses, press the sample gently into the ring and continue until the sample protrudes a short distance through the bottom of the ring. Be careful throughout the trimming process to ensure that there is no void space between the sample and the ring.
- Turn the ring over carefully and remove the portion of the soil protruding above the ring. Using the metal straight edge, cut the soil surface flush with the surface of the ring. Remove the final portion with extreme care.
- Place the previously weighed Saran-wrap-covered glass plate on the freshly cut surface, turn the ring over again, and carefully cut the other end in a similar manner.
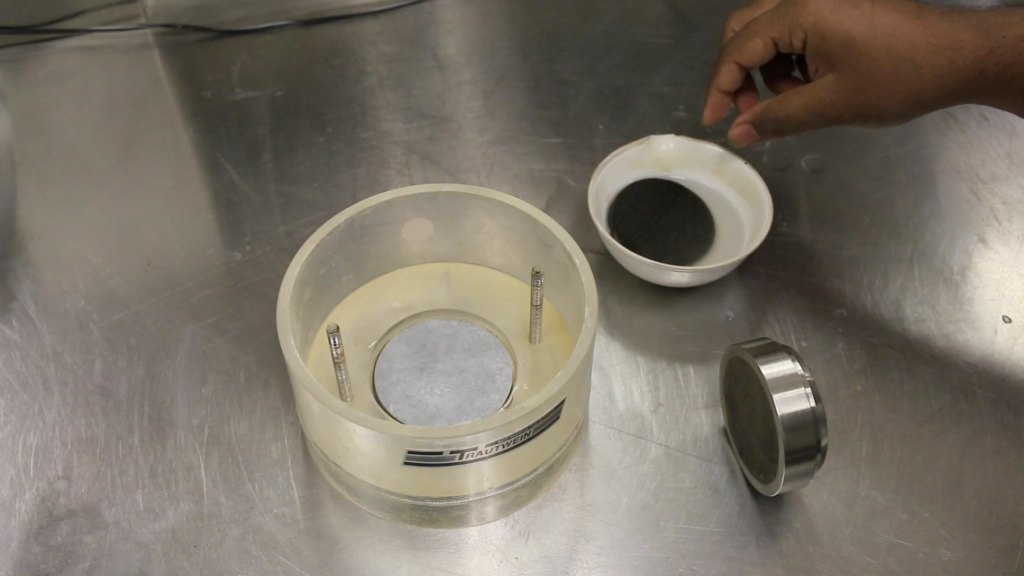
Figure 12.3: Specimen assembly - Weigh the specimen plus ring plus glass plate.
- Carefully remove the ring with the specimen from the Saran-wrapped glass plate and peel the Saran wrap from the specimen surface. Center the porous stones that have been soaking, on the top and bottom surfaces of the test specimen. Place the filter papers between the porous stones and the soil specimen, pressing very lightly to ensure that the stones adhere to the sample. Lower the assembly carefully into the base of the water reservoir. Fill the water reservoir with water until the specimen is completely covered and saturated.
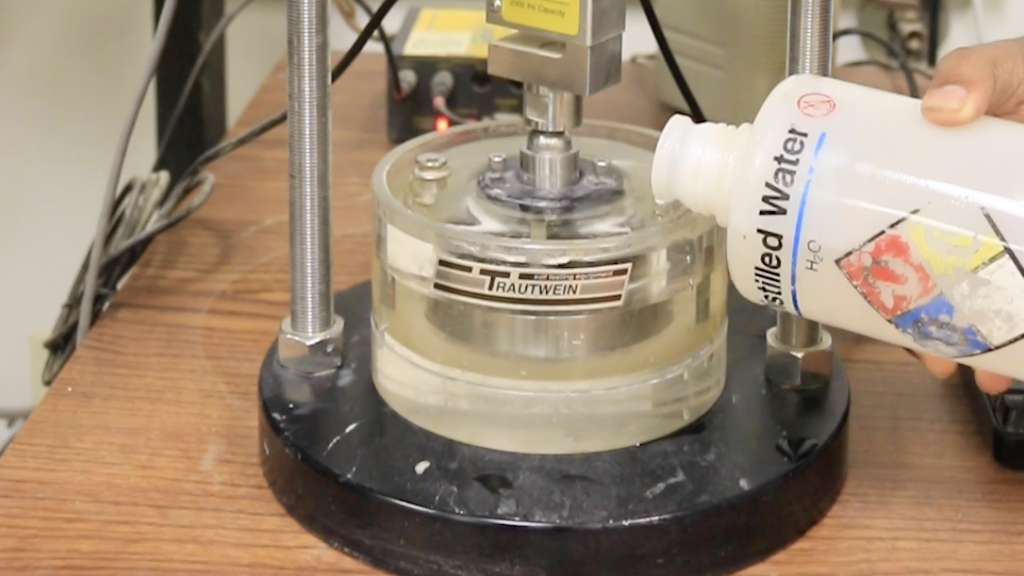
Figure 12.4: Pouring distilled water - Being careful to prevent movement of the ring and porous stones, place the load plate in the center of the upper porous stone and adjust the loading device.
- Adjust the dial gauge to a zero reading.
- Set the pressure gauge dial (based on calibration curve) to result in an applied pressure of 0.5 tsf.
- Record the consolidation dial readings at the elapsed times given on the data sheet.
- The process needs to be repeated for different pre-selected pressures, which generally include loading pressures of 1.0, 2.0, 4.0, 8.0, and 16.0 tsf and unloading pressures of 8.0, 4.0, 2.0, 1.0 and 0.5 tsf.
- At the last elapsed time reading, record the final consolidation dial reading and time, release the load, and quickly disassemble the consolidation device and remove the specimen. Quickly but carefully blot the surfaces dry with paper toweling. (The specimen will tend to absorb water after the load is released.)
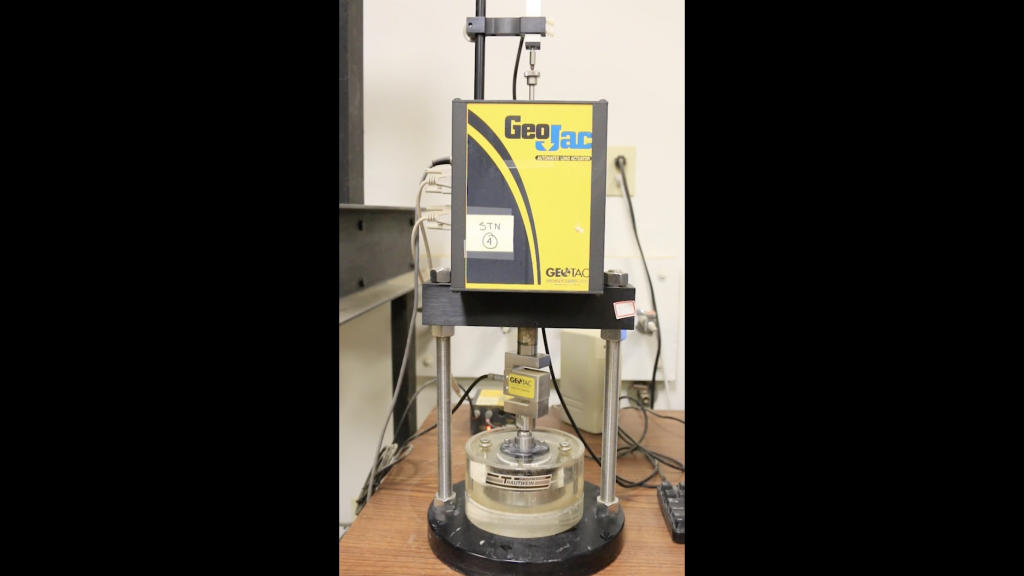
Figure 12.5: Consolidation device - Place the specimen and ring on the glass plate and, weigh them together.
- Weigh a large empty moisture can and lid.
- Carefully remove the specimen from the consolidation ring, being sure not to lose too much soil, and place the specimen in the previously weighed moisture can. Place the moisture can containing the specimen in the oven and let it dry for 12 to 18 hours.
- Weigh the dry specimen in the moisture can.
Analysis
- Calculate the initial water content and the specific gravity of the soil.
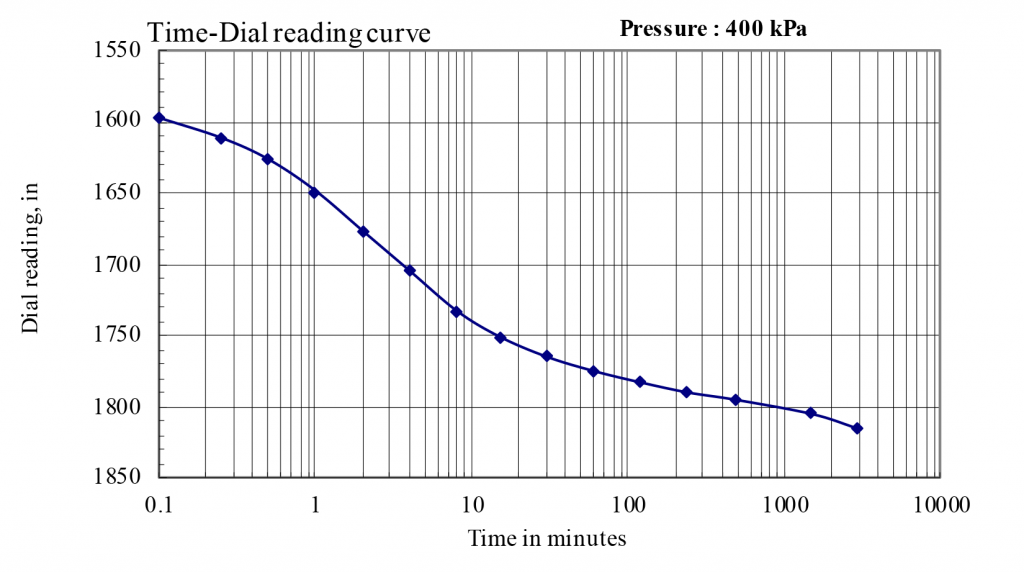
- For each pressure increment, construct a semi log plot of the consolidation dial readings versus the log time (in minutes). Determine D0, D50, D100, and the coefficient of consolidation (cv) using Casagrande’s logarithm of time fitting method. See example data. Also calculate the coefficient of secondary compression based on these plots.
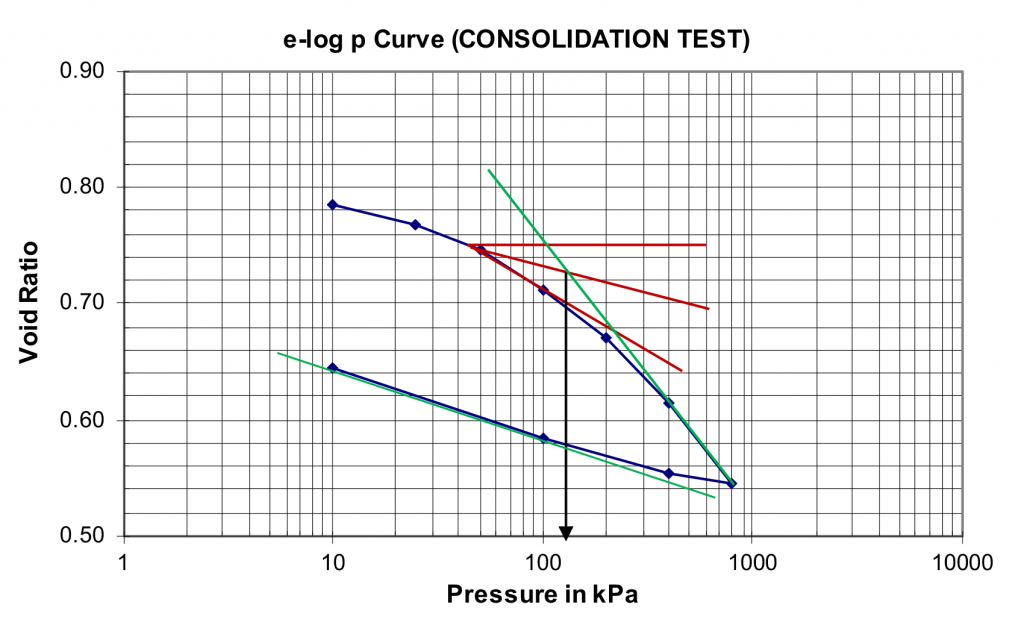
- Calculate the void ratio at the end of primary consolidation for each pressure increment (see example data). Plot the log pressure versus the void ratio. Based on this plot, calculate the compression index, recompression index, and preconsolidation pressure (maximum past pressure).
- Summarize and discuss the results.
Video Materials
Lecture Video
A PowerPoint presentation is created to understand the background and method of this experiment.
Demonstration Video
A short video is executed to demonstrate the experiment procedure and sample calculation.
Results and Discussions
Sample Calculations
Weight of the ring = 156.8 g
Inside diameter of the ring = 2.5 in (6.35 cm)
Height of specimen, Hi = 1 in (2.54 cm)
Area of specimen, A = 31.67 cm2
Mass of specimen + ring = 312.1 g
Initial moisture content of specimen, wi (%) = 28.9%
Specific gravity of solids, Gs = 2.67
Final moisture content of specimen (after test), wf= 27.3%
Weight of solids (before test) =155.3 g
Water content (before test) = 28.9%
Weight of dry specimen = 120.5 g
Specific gravity of soil, Gs= 2.72
Height of solids, Hs = Ms/(A × Gs× ρw) =120.5/(31.67×2.72×1)= 1.40 cm (0.55 in)
Change in height of specimen after test, H =0.24 cm
(H for all pressures – see t vs Dial Reading plots)
Height of specimen after test, Hf = Hi – H = 2.54-0.24 = 2.3 cm
Void ratio before test, e0 = (Hi-Hs)/Hs = (2.54-1.4)/1.4 = 0.816
Void ratio after test, ef = (Hf-Hs)/Hs = (2.3-1.4)/1.4 = 0.645
The sample calculation depicts only one time-settlement graph (for 400 kPa), but it needs to be drawn for each pressure increments. From these graphs, t50 can be determined which is useful for determining the coefficient of consolidation (cv) values.
Soil Used
Soil : Light Grey Clay
BH No: 05
Depth: 7 ft
Specimen Conditions
Specific gravity, Gs =2.72
Vol. of solids = 2.7035 in3
Ht. of Solid (2H0) = 0.5507 in
Ht. of Void (Hv) = 0.4493 in
Initial void ratio (e0) =0.8157
Tare weight = 8.50 lbs.
Deformation Dial Constant = 0.0001 inch/div.
Equipment used
Height of ring= 1 in.
Dia. Of ring = 2.5 in.
Area of sample= 4.9087 in2
Wt. of ring= 156.8 gm
Wt. of ring+soil (before test)= 312.10 gm
Wt. of soil (before test)= 155.3 gm
Water Content (before test)= 28.9%
Wt. of dry specimen= 120.50 gm
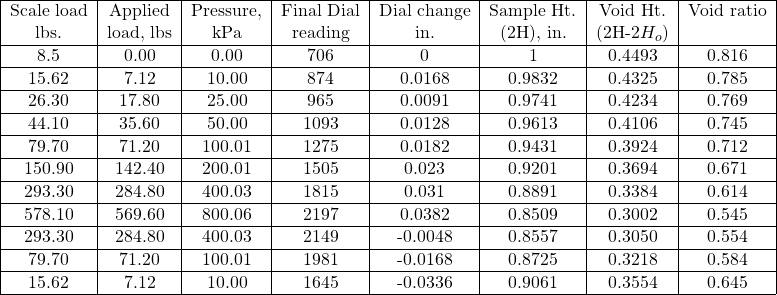
Results
Compression Index (Cc) = 0.23
Re-compression Index (Cr) = 0.06
Preconsolidation Pressure (Pc) or Maximum Past Pressure (vmax) = 115 kPa
Coefficient of Consolidation (Cv)= 4.2 to 7.25 m2/year (depends on the pressure)
Report
Use the template provided to prepare your lab report for this experiment. Your report should include the following
- Objective of the test
- Applications of the test
- Apparatus used
- Test procedures (optional)
- Analysis of test results – Complete the table provided and show one sample calculation. Draw the e-logP curve and determine Cc, Cr and the preconsolidation pressure.
- Summary and conclusions – Comment on the results. Discuss how the obtained value will be helpful for determining the consolidation settlement in the field.

