Experiment #2: Bernoulli’s Theorem Demonstration
1. Introduction
Energy presents in the form of pressure, velocity, and elevation in fluids with no energy exchange due to viscous dissipation, heat transfer, or shaft work (pump or some other device). The relationship among these three forms of energy was first stated by Daniel Bernoulli (1700-1782), based upon the conservation of energy principle. Bernoulli’s theorem pertaining to a flow streamline is based on three assumptions: steady flow, incompressible fluid, and no losses from the fluid friction. The validity of Bernoulli’s equation will be examined in this experiment.
2. Practical Application
Bernoulli’s theorem provides a mathematical means to understanding the mechanics of fluids. It has many real-world applications, ranging from understanding the aerodynamics of an airplane; calculating wind load on buildings; designing water supply and sewer networks; measuring flow using devices such as weirs, Parshall flumes, and venturimeters; and estimating seepage through soil, etc. Although the expression for Bernoulli’s theorem is simple, the principle involved in the equation plays vital roles in the technological advancements designed to improve the quality of human life.
3. Objective
The objective of this experiment is to investigate the validity of the Bernoulli equation when it is applied to a steady flow of water through a tapered duct.
4. Method
In this experiment, the validity of Bernoulli’s equation will be verified with the use of a tapered duct (venturi system) connected with manometers to measure the pressure head and total head at known points along the flow.
5. Equipment
The following equipment is required to complete the demonstration of the Bernoulli equation experiment:
- F1-10 hydraulics bench,
- F1-15 Bernoulli’s apparatus test equipment, and
- A stopwatch for timing the flow measurement.
6. Equipment Description
The Bernoulli test apparatus consists of a tapered duct (venturi), a series of manometers tapped into the venturi to measure the pressure head, and a hypodermic probe that can be traversed along the center of the test section to measure the total head. The test section is a circular duct of varying diameter with a 14° inclined angle on one side and a 21° inclined angle on other side. Series of side hole pressure tappings are provided to connect manometers to the test section (Figure 2.1).
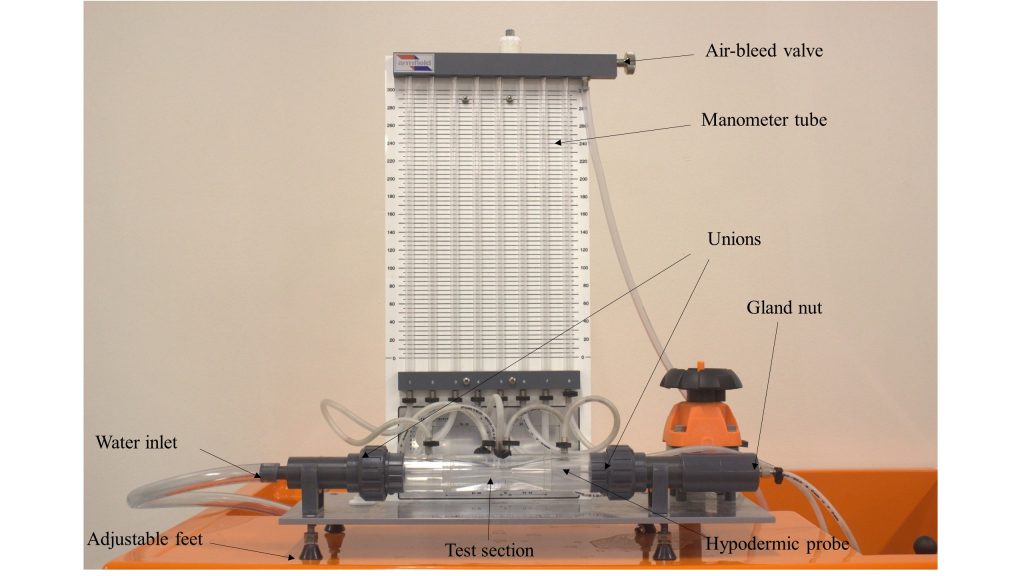
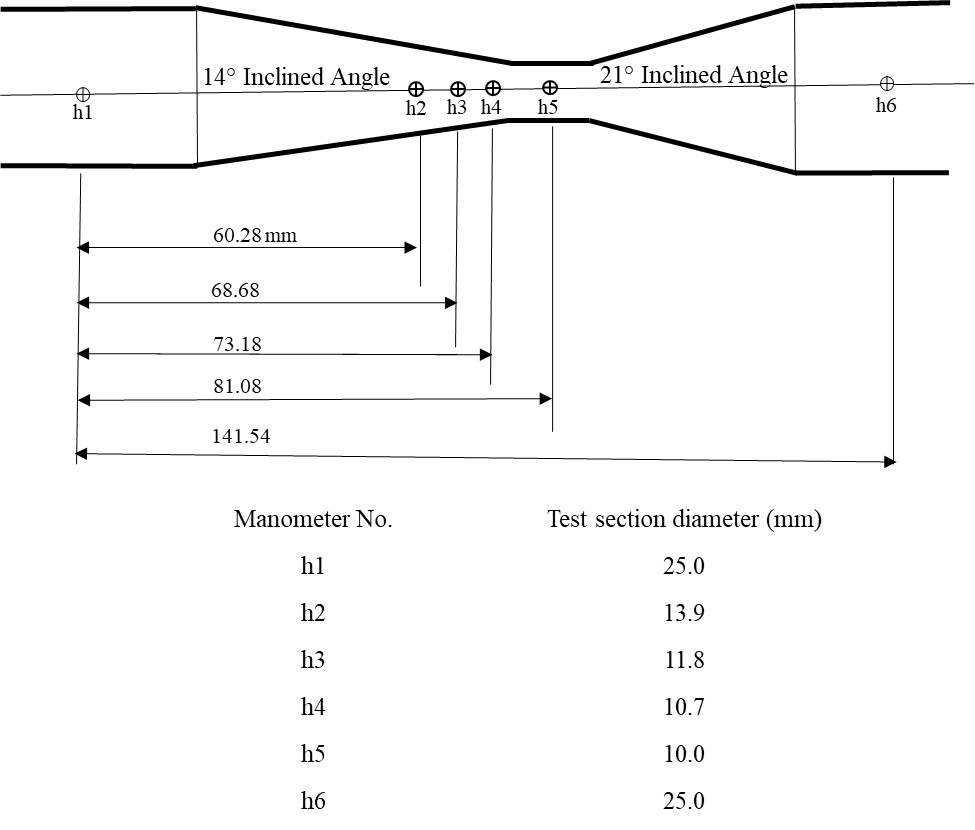
Manometers allow the simultaneous measurement of the pressure heads at all of the six sections along the duct. The dimensions of the test section, the tapping positions, and the test section diameters are shown in Figure 2.2. The test section incorporates two unions, one at either end, to facilitate reversal for convergent or divergent testing. A probe is provided to measure the total pressure head along the test section by positioning it at any section of the duct. This probe may be moved after slackening the gland nut, which should be re-tightened by hand. To prevent damage, the probe should be fully inserted during transport/storage. The pressure tappings are connected to manometers that are mounted on a baseboard. The flow through the test section can be adjusted by the apparatus control valve or the bench control valve [2].
7. Theory
Bernoulli’s theorem assumes that the flow is frictionless, steady, and incompressible. These assumptions are also based on the laws of conservation of mass and energy. Thus, the input mass and energy for a given control volume are equal to the output mass and energy:


These two laws and the definition of work and pressure are the basis for Bernoulli’s theorem and can be expressed as follows for any two points located on the same streamline in the flow:

where:
P: pressure,
g: acceleration due to gravity,
v: fluid velocity, and
z: vertical elevation of the fluid.
In this experiment, since the duct is horizontal, the difference in height can be disregarded, i.e., z1=z2
The hydrostatic pressure (P) along the flow is measured by manometers tapped into the duct. The pressure head (h), thus, is calculated as:

Therefore, Bernoulli’s equation for the test section can be written as:

in which  is called the velocity head (hd).
The total head (ht) may be measured by the traversing hypodermic probe. This probe is inserted into the duct with its end-hole facing the flow so that the flow becomes stagnant locally at this end; thus:

The conservation of energy or the Bernoulli’s equation can be expressed as:

The flow velocity is measured by collecting a volume of the fluid (V) over a time period (t). The flow rate is calculated as:

The velocity of flow at any section of the duct with a cross-sectional area of is determined as:

For an incompressible fluid, conservation of mass through the test section should be also satisfied (Equation 1a), i.e.:

8. Experimental Procedure
- Place the apparatus on the hydraulics bench, and ensure that the outflow tube is positioned above the volumetric tank to facilitate timed volume collections.
- Level the apparatus base by adjusting its feet. (A sprit level is attached to the base for this purpose.) For accurate height measurement from the manometers, the apparatus must be horizontal.
- Install the test section with the 14° tapered section converging in the flow direction. If the test section needs to be reversed, the total head probe must be retracted before releasing the mounting couplings.
- Connect the apparatus inlet to the bench flow supply, close the bench valve and the apparatus flow control valve, and start the pump. Gradually open the bench valve to fill the test section with water.
- The following steps should be taken to purge air from the pressure tapping points and manometers:
- Close both the bench valve and the apparatus flow control valve.
- Remove the cap from the air valve, connect a small tube from the air valve to the volumetric tank, and open the air bleed screw.
- Open the bench valve and allow flow through the manometers to purge all air from them, then tighten the air bleed screw and partly open the bench valve and the apparatus flow control valve.
- Open the air bleed screw slightly to allow air to enter the top of the manometers (you may need to adjust both valves to achieve this), and re-tighten the screw when the manometer levels reach a convenient height. The maximum flow will be determined by having a maximum (h1) and minimum (h5) manometer readings on the baseboard.
If needed, the manometer levels can be adjusted by using an air pump to pressurize them. This can be accomplished by attaching the hand pump tube to the air bleed valve, opening the screw, and pumping air into the manometers. Close the screw, after pumping, to retain the pressure in the system.
- Take readings of manometers h1 to h6 when the water level in the manometers is steady. The total pressure probe should be retracted from the test section during this reading.
- Measure the total head by traversing the total pressure probe along the test section from h1 to h6.
- Measure the flow rate by a timed volume collection. To do that, close the ball valve and use a stopwatch to measure the time it takes to accumulate a known volume of fluid in the tank, which is read from the sight glass. You should collect fluid for at least one minute to minimize timing errors. You may repeat the flow measurement twice to check for repeatability. Be sure that the total pressure probe is retracted from the test section during this measurement.
- Reduce the flow rate to give the head difference of about 50 mm between manometers 1 and 5 (h1-h5). This is the minimum flow experiment. Measure the pressure head, total head, and flow.
- Repeat the process for one more flow rate, with the (h1-h5) difference approximately halfway between those obtained for the minimum and maximum flows. This is the average flow experiment.
- Reverse the test section (with the 21° tapered section converging in the flow direction) in order to observe the effects of a more rapidly converging section. Ensure that the total pressure probe is fully withdrawn from the test section, but not pulled out of its guide in the downstream coupling. Unscrew the two couplings, remove the test section and reverse it, then re-assemble it by tightening the couplings.
- Perform three sets of flow, and conduct pressure and flow measurements as above.
9. Results and Calculations
Please visit this link for accessing excel workbook for this experiment.
9.1. Results
Enter the test results into the Raw Data Tables.
Raw Data Table
| Position 1: Tapering 14° to 21° | ||||
| Test Section | Volume (Litre) | Time (sec) | Pressure Head (mm) | Total Head (mm) |
| h1 | ||||
| h2 | ||||
| h3 | ||||
| h4 | ||||
| h5 | ||||
| h6 | ||||
| h1 | ||||
| h2 | ||||
| h3 | ||||
| h4 | ||||
| h5 | ||||
| h6 | ||||
| h1 | ||||
| h2 | ||||
| h3 | ||||
| h4 | ||||
| h5 | ||||
| h6 | ||||
Raw Data Table
| Position 2: Tapering 21° to 14° | ||||
| Test Section | Volume (Litre) | Time (sec) | Pressure Head (mm) | Total Head (mm) |
| h1 | ||||
| h2 | ||||
| h3 | ||||
| h4 | ||||
| h5 | ||||
| h6 | ||||
| h1 | ||||
| h2 | ||||
| h3 | ||||
| h4 | ||||
| h5 | ||||
| h6 | ||||
| h1 | ||||
| h2 | ||||
| h3 | ||||
| h4 | ||||
| h5 | ||||
| h6 | ||||
9.2 Calculations
For each set of measurements, calculate the flow rate; flow velocity, velocity head, and total head, (pressure head+ velocity head). Record your calculations in the Result Table.
Result Table
| Position 1: Tapering 14° to 21° | |||||||||
| Test No. | Test Section | Distance into duct (m) | Flow Area (m²) | Flow Rate (m³/s) | Velocity (m/s) | Pressure Head (m) | Velocity Head (m) | Calculated Total Head (m) | Measured Total Head (m) |
| 1 | h1 | 0 | 0.00049 | ||||||
| h2 | 0.06028 | 0.00015 | |||||||
| h3 | 0.06868 | 0.00011 | |||||||
| h4 | 0.07318 | 0.00009 | |||||||
| h5 | 0.08108 | 0.000079 | |||||||
| h6 | 0.14154 | 0.00049 | |||||||
| 2 | h1 | 0 | 0.00049 | ||||||
| h2 | 0.06028 | 0.00015 | |||||||
| h3 | 0.06868 | 0.00011 | |||||||
| h4 | 0.07318 | 0.00009 | |||||||
| h5 | 0.08108 | 0.000079 | |||||||
| h6 | 0.14154 | 0.00049 | |||||||
| 3 | h1 | 0 | 0.00049 | ||||||
| h2 | 0.06028 | 0.00015 | |||||||
| h3 | 0.06868 | 0.00011 | |||||||
| h4 | 0.07318 | 0.00009 | |||||||
| h5 | 0.08108 | 0.000079 | |||||||
| h6 | 0.14154 | 0.00049 | |||||||
| Position 2: Tapering 21° to 14° | |||||||||
| Test No. | Test Section | Distance into duct (m) | Flow Area (m²) | Flow Rate (m³/s) | Velocity (m/s) | Pressure Head (m) | Velocity Head (m) | Calculated Total Head (m) | Measured Total Head (m) |
| 1 | h1 | 0 | 0.00049 | ||||||
| h2 | 0.06028 | 0.00015 | |||||||
| h3 | 0.06868 | 0.00011 | |||||||
| h4 | 0.07318 | 0.00009 | |||||||
| h5 | 0.08108 | 0.000079 | |||||||
| h6 | 0.14154 | 0.00049 | |||||||
| 2 | h1 | 0 | 0.00049 | ||||||
| h2 | 0.06028 | 0.00015 | |||||||
| h3 | 0.06868 | 0.00011 | |||||||
| h4 | 0.07318 | 0.00009 | |||||||
| h5 | 0.08108 | 0.000079 | |||||||
| h6 | 0.14154 | 0.00049 | |||||||
| 3 | h1 | 0 | 0.00049 | ||||||
| h2 | 0.06028 | 0.00015 | |||||||
| h3 | 0.06868 | 0.00011 | |||||||
| h4 | 0.07318 | 0.00009 | |||||||
| h5 | 0.08108 | 0.000079 | |||||||
| h6 | 0.14154 | 0.00049 | |||||||
10. Report
Use the template provided to prepare your lab report for this experiment. Your report should include the following:
- Table(s) of raw data
- Table(s) of results
- For each test, plot the total head (calculated and measured), pressure head, and velocity head (y-axis) vs. distance into duct (x-axis) from manometer 1 to 6, a total of six graphs. Connect the data points to observe the trend in each graph. Note that the flow direction in duct Position 1 is from manometer 1 to 6; in Position 2, it is from manometer 6 to 1.
- Comment on the validity of Bernoulli’s equation when the flow converges and diverges along the duct.
- Comment on the comparison of the calculated and measured total heads in this experiment.
- Discuss your results, referring, in particular, to the following:
- energy loss and how it is shown by the results of this experiment, and
- the components of Bernoulli’s equation (
 ) and how they vary along the length of the test section. Indicate the points of maximum velocity and minimum pressure.
