Experiment #8: Free and Forced Vortices
1. Introduction
Vortices can occur naturally or be produced in a laboratory. There are two types of vortices: free vortices and forced vortices. A free vortex is formed, for example, when water flows out of a vessel through a central hole in the base. No external force is required to rotate the fluid, and the degree of rotation is dependent upon the initial disturbance. Whirlpools in rivers and tornadoes are examples of natural free vortices. A forced vortex, on the other hand, is caused by external forces on the fluid. It can be created by rotating a vessel containing fluid or by paddling in fluid. Rotational flow created by impellers of a pump is an example of a forced vortex in turbomachinery.
2. Practical Application
Studying natural phenomena such as hurricanes, tornadoes, and whirlpools (free vortices) requires a full understanding of vortex behavior. It is also critical for engineers and designers to be able to characterize forced vortices generated in machinery, such as centrifugal pumps or turbines. Vortices often have adverse effects, as have been seen during hurricanes, tornadoes, or scour holes created downstream of a dam outlet; however, understanding vortex behavior has enabled engineers to design turbomachinery and hydraulic structures that take advantage of these phenomena. For example, hydrodynamic separators have been developed, based on vortex behavior (swirling flow), to separate solid materials from liquids. This type of separator is used in water treatment plants.
3. Objective
The objective of this lab experiment is to study and compare the water surface profiles of free and forced vortices.
4. Method
This experiment is performed by measuring the water surface profiles of a number of free and forced vortices, and observing the differences. We will study the profiles of free vortices that are produced when water flows from orifices of different diameters that are installed at the base of a tank. Varying the size of the orifice creates changes in the flow rate, thereby changing the rotational speed and size of the vortex profile. Forced vortices are created due to external forces, so we will increase the rotational speed throughout the experiment to study the theoretical and experimental relationships between the vortex surface profile and angular velocity.
5. Equipment
The following equipment is required to perform the free and forced experiment:
- P6100 hydraulics bench, and
- P6238: Free and forced vortices apparatus.
6. Equipment Description
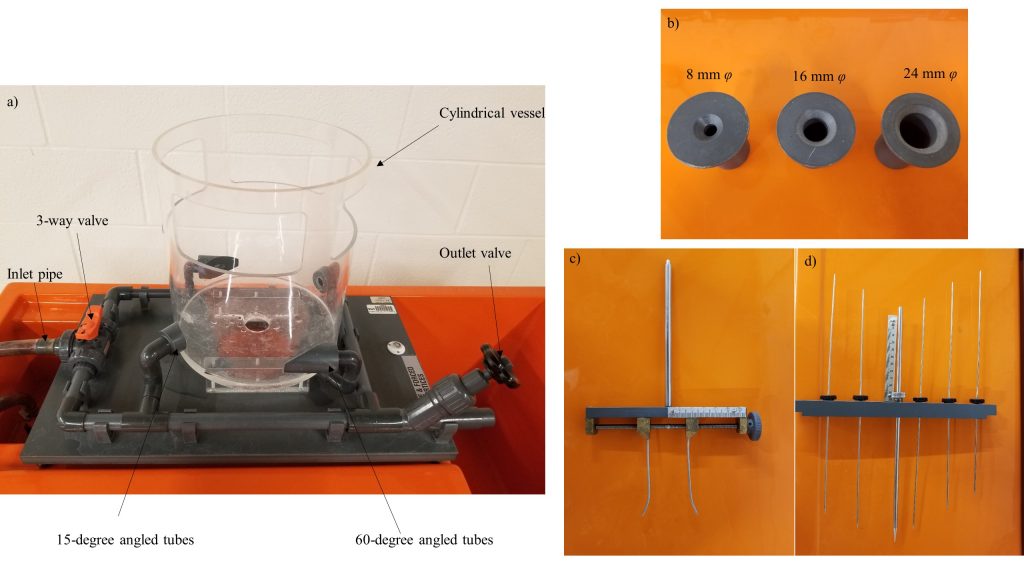
The free and forced vortices apparatus consists of a transparent cylindrical vessel, 250 mm in diameter and 180 mm deep, with two pairs of diametrically opposed inlet tubes of 9.0 mm and 12.5 mm diameter. The 12.5 diameter inlet tubes are angled at 15° to the diameter in order to create a swirling motion of the water entering the vessel during the free vortex experiment (Figure 8.1a). An outlet is centrally positioned in the base of the vessel, and a set of push-in orifices of 8, 16, and 24 mm diameter (Figure 8.1b) is supplied to reduce the outlet diameter to a suitable value and produce free vortices of different sizes. The vortex surface profile is determined by a measuring caliper (Figure 8.1c) housed on a mounted bridge, that measures the diameter of the vortex at various elevations. This provides the coordinate points that are required for plotting the free vortex profile [8].
The forced vortex is created by positioning a bushed plug in the central hole of the vessel and introducing the flow through 9 mm inlet tubes that are angled at 60° to the diameter. The water inflow from these tubes impinges on a two-blade paddle. The water exits the vessel via the 12.5 mm angled inlet tubes that are used as entry tubes for the free vortex experiment. The two-bladed paddle rotates on a vertical shaft supported by the bushed plug. A bridge piece mounted on top of the vessel houses a series of needles (Figure 8.1d) to determine the coordinates of the forced vortex profile [8].
A 3-way valve allows water to be diverted through the 12.5 mm inlet tubes for the free vortex experiment, and 9 mm inlet tubes for the forced vortex experiment.
7. Theory
Two types of vortices are distinguished in the dynamics of the motion: forced and free vortices. The forced vortex is caused by external forces on the fluid, such as the impeller of a pump, and the free vortex naturally occurs in the flow and can be observed in a drain or in the atmosphere of a tornado.
7.1. Free Vortex
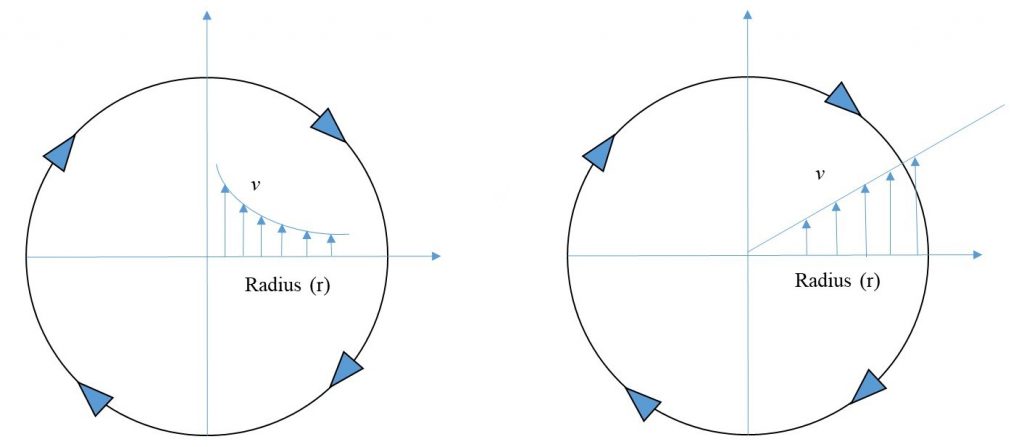
A free vortex is formed when water flows out of a vessel through a central hole in the base (Figure 8.2). The degree of the rotation depends on the initial disturbance. In a free cylindrical vortex, the velocity varies inversely with the distance from the axis of rotation (Figure 8.3).

The equation governing the surface profile is derived from the Bernoulli’s theorem:

Substituting Equation (1) into (2) will give a new expression:

or:

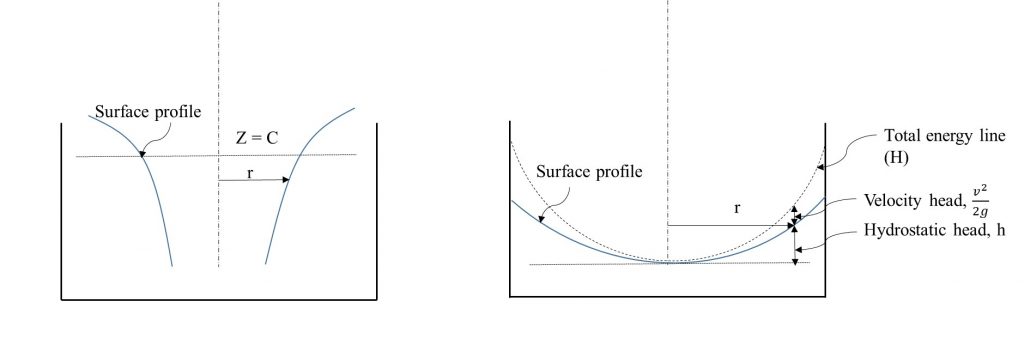
which is the equation of a hyperbolic curve of nature  (Figure 8.4)
This curve is asymptotic to the axis of rotation and to the horizontal plane through z=c.
7.2. Forced Vortex
When water is forced to rotate at a constant speed ( ) (Figure 8.2), the velocity will be also constant and equal to:

The velocity head (or kinetic energy) can be calculated as:

Substituting Equation (5) into (6) results in:

If the horizontal plane passing through the lowest point of the vortex is selected as datum, the total energy is equal to:

where ho is the pressure head at the datum. Substituting hc from Equation (7) into (8) gives:

At r=0: H=0, therefore, ho=0 , and :

This is the equation of the water surface profile, which is a parabola (Figure 8.4).
8. Experimental Procedure
This experiment will be performed in two parts: free vortex and forced vortex.
8.1. Free Vortex
- Position the apparatus on the hydraulics bench so that the central outlet in the base of the vessel is located over the weir trough.
- Adjust the feet to ensure that the apparatus is level.
- Push the 24 mm diameter orifice into the central outlet located in the base of the apparatus.
- Connect the inlet pipe of the apparatus (situated on the 3-way valve) to the hydraulics bench outlet, using the flexible pipe provided.
- Close the apparatus outlet globe valve, and position the 3-way valve so that water flows into the vessel via the 15-degree inlet ports.
- Close the bench outlet valve, and turn on the pump.
- Gradually open the bench valve, and allow the vessel to fill with water until water begins to overflow through the cutouts.
- After the vessel is slightly overflowing, slowly open the outlet valve so that the water level maintains a stable height. Note that you can also adjust the bench valve to maintain a constant water level.
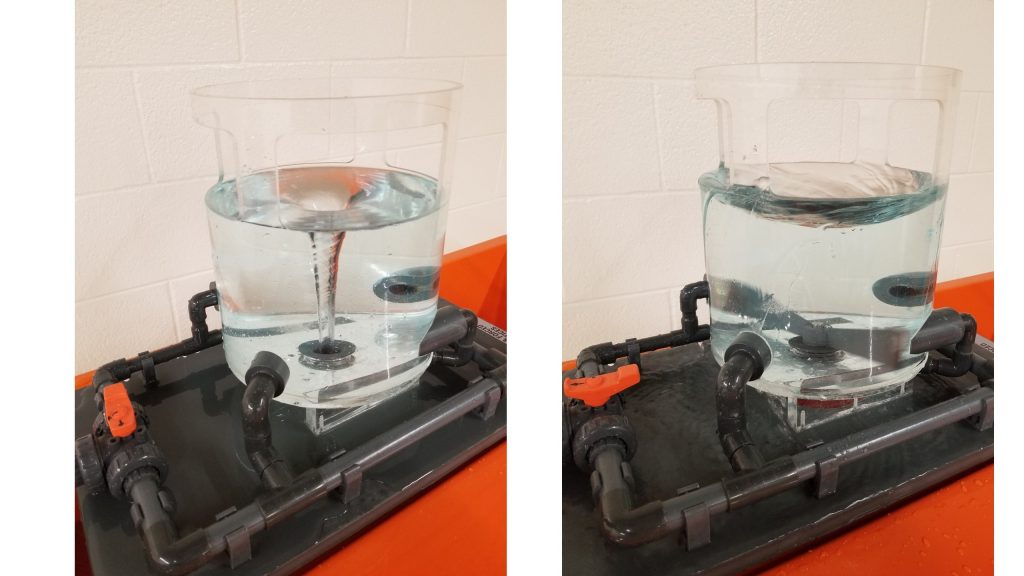
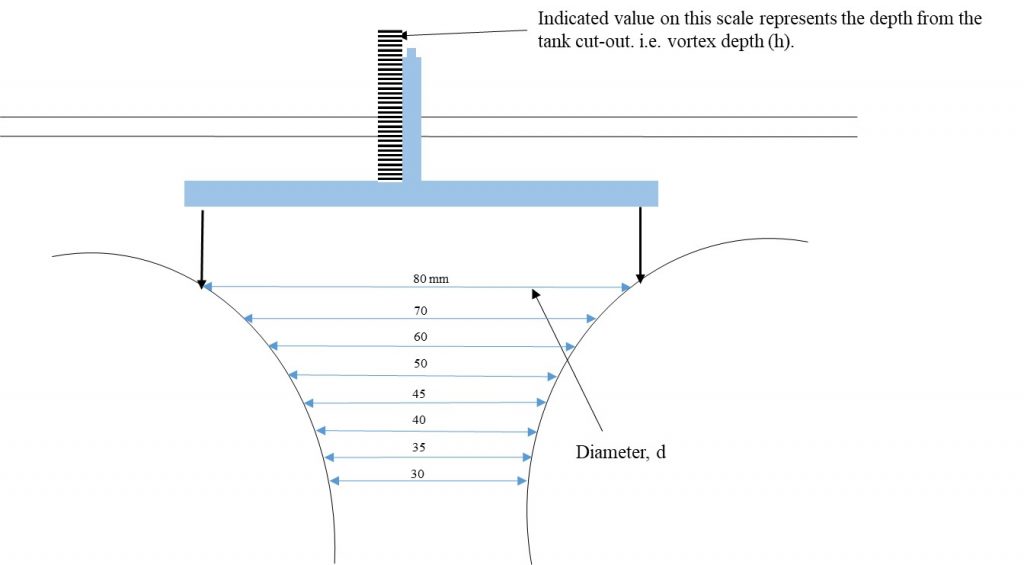
- After a constant water level has been achieved, measure the water surface profile, by adjusting the measuring caliper to a desired radius, and then lower it into the vortex until the needles evenly touch the walls of the vortex. At this point, record the height indicated by the caliper and repeat the procedure for the remaining radii (Figure 8.5).
- After completing your measurements, close the bench valve, turn off the pump, drain the apparatus, and repeat the process for the remaining two orifices.
Note: The vortex profile tends to wander, so the vortex diameter- measuring gauge arm should be positioned at 90° to the main arm. This allows a meaningful vortex diameter measurement to be made.
8.2. Forced Vortex
- Position the bushed plug into the outlet of the vessel and mount the two-blade paddle wheel on the shaft, ensuring that the tapered edges of the blades angle upward.
- Adjust the 3-way valve so that water flows into the vessel via the 60-degree outlet ports. Turn on the pump, open the bench control valve, and allow the vessel to fill with water until water just begins to overflow through the cutouts. Note that the inlet may need to be adjusted in order to achieve a low-profiled, calm vortex. Water will now flow through these ports and impinge on the paddle wheel before flowing out of the apparatus via the two 15-degree ports.
- After the vessel is filled with water, adjust the outlet valve so that the water level remains stable.
Note: If the water level fluctuates, raise the free end of the outlet tube above the grade line of the water in the vessel, and then lower it again into the bench tank. Doing this will ensure that water discharges at the same rate that it flows in, thereby helping to maintain the water level.
- After the water level is stable, measure the vortex surface profile. This is done by mounting the measuring bridge to the vessel, and then lowering the needles until they are touching the profile of the vortex. Lock them in place, then remove the bridge, and measure the height of each needle. It is recommended that this be done with a graph or engineering paper.
- Record the time that it takes for the paddles to make 10 revolutions in the vessel. You can find the angular velocity of the flow by dividing the number of revolutions by the time.
- Increase the inflow rate to achieve higher angular velocity, and repeat the process so that you have four distinct vortex profiles. Note that as you increase the inflow, you will need to adjust the outlet flow to maintain the water level. As you increase the flow rate, change the count of the revolutions to 20, 40, and 50.
9. Results and Calculations
Please visit this link for accessing excel workbook for this experiment.
9.1. Results
Use the following tables to record your measurements.
Raw Data Table: Free Vortex
| D (mm) | 24-mm Orifice |
16-mm Orifice |
8-mm Orifice |
| H (mm) | |||
| 80 | |||
| 70 | |||
| 60 | |||
| 50 | |||
| 45 | |||
| 40 | |||
| 35 | |||
| 30 | |||
Raw Data Table: Forced Vortex
| No. of Revolutions (N) | T (sec) |
Distance from center, r(mm) | ||||||
| 125 (edge) |
110 | 90 | 70 | 50 | 30 | 0 | ||
| Measured height, H(mm) | ||||||||
| 10 | ||||||||
| 20 | ||||||||
| 40 | ||||||||
| 50 | ||||||||
9.2. Calculations
a) Free Vortex
Record the coordinate points (D and H) for the three vortex profiles, using Figure 8.5 and the Raw Data Table – Free Vortex.
Result Table: Free Vortex
| 24-mm orifice | 16-mm orifice | 8-mm orifice | |||
| D (mm) | H (mm) | D (mm) | H (mm) | D (mm) | H (mm) |
| 80 | 80 | 80 | |||
| 70 | 70 | 70 | |||
| 60 | 60 | 60 | |||
| 50 | 50 | 50 | |||
| 45 | 45 | 45 | |||
| 40 | 40 | 40 | |||
| 35 | 35 | 35 | |||
| 30 | 30 | 30 | |||
b) Forced Vortex
For all series of experiments with N=10, 20, 40, and 50,
- Calculate angular velocity,

- Calculate the theoretical water surface profile, using Equation 10.
Result Table – Forced Vortex
| Distance from the center, r (mm) |
N=10 | N = 20 | N = 40 | N = 50 | ||||||||
| ω (rad/s) | H (mm) cal. | H (mm) meas. | ω (rad/s) | H (mm) cal. | H (mm) meas. | ω (rad/s) | H (mm) cal. | H (mm) meas. | ω (rad/s) | H (mm) cal. | H (mm) meas. | |
| 0 | ||||||||||||
| 30 | ||||||||||||
| 50 | ||||||||||||
| 70 | ||||||||||||
| 90 | ||||||||||||
| 110 | ||||||||||||
| 125 | ||||||||||||
cal.= calculated; meas.= measured.
10. Report
Use the template provided to prepare your lab report for this experiment. Your report should include the following:
- Table(s) of raw data
- Table(s) of results
- Graph(s)
- Plot all three measured surface profiles of the free vortices on one chart ( r as x-axis and H as y-axis). Note that your plots should look like Figure 8.4 (left): as the depth increases, the radius of the vortex decreases.
- Plot measured and calculated water surface profiles for forced vortices on one chart ( r as x-axis and H as y-axis). Note that you need to prepare one chart for each N value (a total of 4 graphs), and the surface profiles should look like Figure 8.4 (right).
- Compare and discuss the calculated and measured surface profiles of forced vortices.
- Discuss briefly the practical applications of free and forced vortices.
- Comment on the possible sources of error (e.g., variance from ideal vortex motion).
