Experiment #9: Flow Over Weirs
1. Introduction
A weir is a barrier across the width of a river or stream that alters the characteristics of the flow and usually results in a change in the height of the water level. Several types of weirs are designed for application in natural channels and laboratory flumes. Weirs can be broad-crested, short-crested, or sharp-crested. Sharp-crested weirs, commonly referred to as notches, are manufactured from sharp-edged thin plates. The relationship between the flow rate and water depth above the weir can be derived by applying the Bernoulli’s equation and by making some assumptions with regard to head loss and pressure distribution of the flow passing over the weir. A coefficient of discharge needs to be determined experimentally for each weir to account for errors in estimating the flow rate that is due to these assumptions.
2. Practical Application
Weirs are commonly used to measure or regulate flow in rivers, streams, irrigation canals, etc. Installing a weir in an open channel system causes critical depth to form over the weir. Since there is a unique relationship between the critical depth and discharge, a weir can be designed as a flow-measuring device. Weirs are also built to raise the water level in a channel to divert the flow to irrigation systems that are located at higher elevations.
3. Objective
The objectives of this experiment are to:
a) determine the characteristics of flow over a rectangular and a triangular weir, and
b) determine the value of the discharge coefficient for both notches.
4. Method
The coefficients of discharge are determined by measuring the height of the water surface above the notch base and the corresponding flow rate. The general features of the flow can be determined by direct observation.
5. Equipment
The following equipment is required to perform the flow over weirs experiment:
- F1-10 hydraulics bench;
- F1-13 rectangular and triangular weirs;
- Vernier height gauge; and
- Stopwatch.
6. Equipment Description
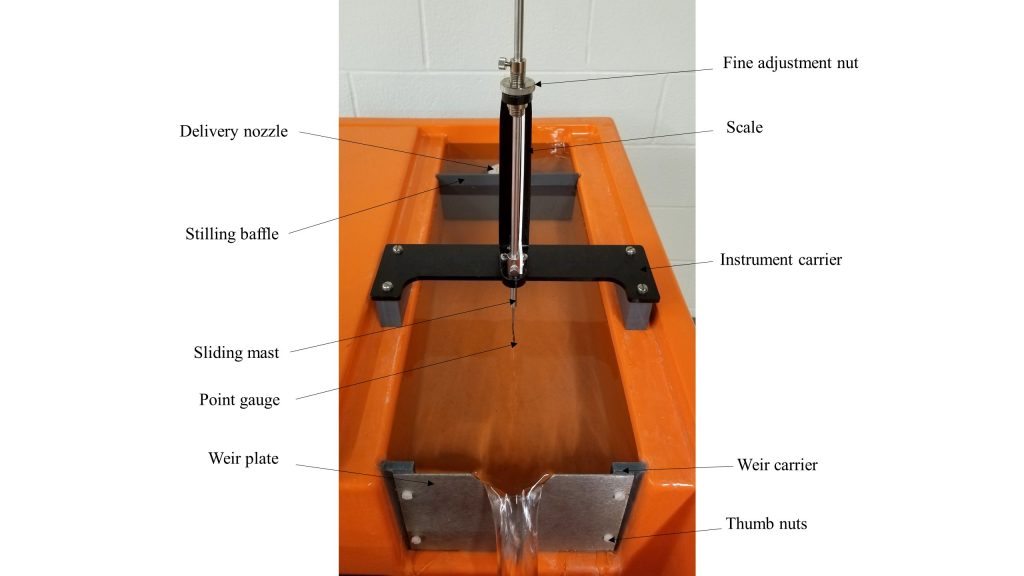
The flow over the weir apparatus includes the following elements that are used in conjunction with the flow channel in the molded bench top of the hydraulics bench (Figure 9.1).
- A combination of a stilling baffle and the inlet nozzle to promote smooth flow conditions in the channel.
- A vernier hook and point gauge, mounted on an instrument carrier, to allow measurement of the depth of flow above the base of the notch.
- The weir notches that are mounted in a carrier at the outlet end of the flow channel [9].
7. Theory
The depth of water above the base of a weir is related to the flow rate through it; therefore, the weir can be used as a flow measuring device. The relationships of flow over weirs can be obtained by applying the energy equation from a point well upstream of the weir to a point just above the weir crest. This approach requires a number of assumptions, and it yields the following results:
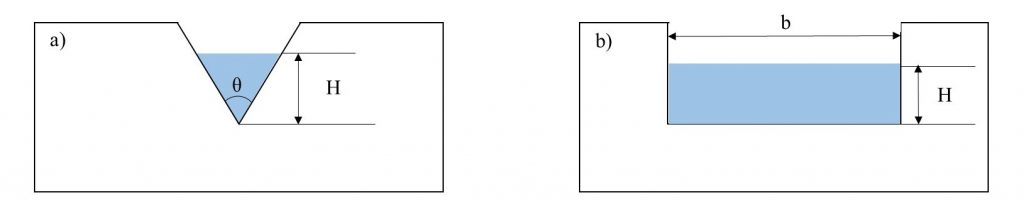
- for a triangular weir (Figure 9.2a):

- for a rectangular weir (Figure 9.2b):

where:
Q : flow rate;
H : height above the weir base;
b : width of rectangular weir (R-notch);
 : angle of triangular weir (V-notch);
Cd: discharge coefficient to account for the effects of simplifying assumptions in the theory, which has to be determined by experiment [9].
- for a V-notch

- for a R-notch:

8. Experimental Procedure
This experiment will be performed by taking the following steps:
- Ensure that the hydraulics bench is positioned so that its surface is horizontal. This is necessary because the flow over the notch is driven by gravity.
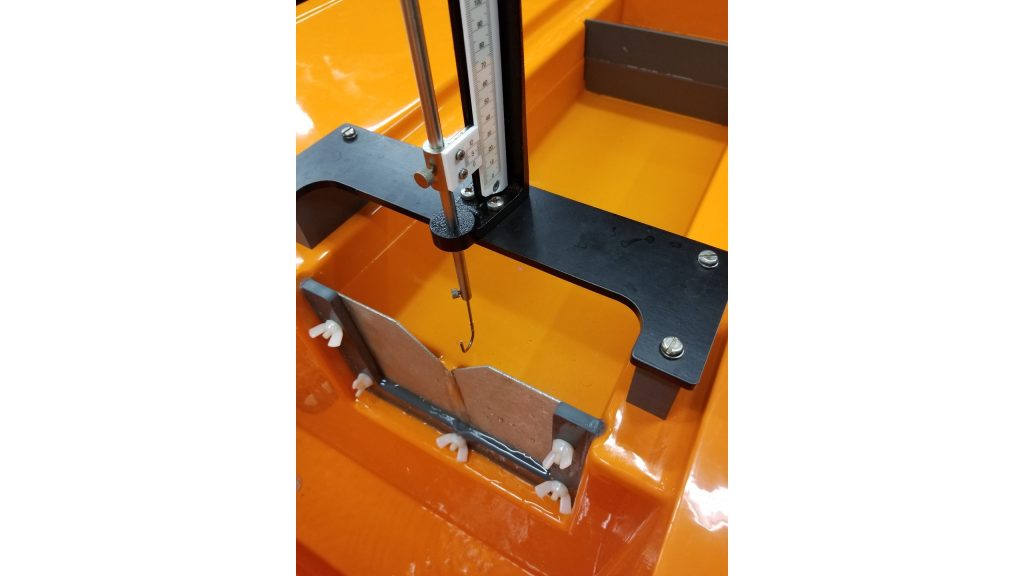
- Mount the rectangular notch plate onto the flow channel, and position the stilling baffle as shown in Figure 9.3.
- Turn on the pump, and slightly adjust the flow control to fill the channel upstream of the weir with water.
- Turn off the pump when the water starts to flow over the weir.
- Wait a few minutes to allow the water to settle.
- Level the point gauge with the water level in the channel. Record the reading as ho.
Note: To measure the datum height of the base of the notch (ho), position the instrument carrier as shown in Figure 9.3. Then carefully lower the gauge until the point is just above the notch base, and lock the coarse adjustment screw. Then, using the fine adjustment, adjust the gauge until the point just touches the water surface and take a reading, being careful not to damage the notch.
- Adjust the point gauge to read 10 mm greater than the datum.
- Record the reading as h.
- Turn on the pump, and slightly adjust the flow until the water level coincides with the point gauge. Check that the level has stabilized before taking readings.
- Measure the flow rate using the volumetric tank.
- Observe the shape of the nappe and take pictures of it.
Note: The surface of the water will fall as it approaches the weir. This is particularly noticeable at high flow rates by high heads. To obtain an accurate measurement of the undisturbed water level above the crest of the weir, it is necessary to place the measuring gauge at a distance of at least three times the head above the weir.
- Increase the flow by opening the bench regulating valve to set the heads above the datum level in 10 mm increments until the regulating valve is fully open. Take care not to allow spillage to occur over the plate top that is adjacent to the notch. At each condition, measure the flow rate and observe the shape of the nappe.
Note: To obtain a sufficiently accurate result, collect around 25 liters of water each time, or collect the water for at least 120 seconds.
- Close the regulating valve, stop the pump, and then replace the weir with the V-notch.
- Repeat the experiment with the V-notch weir plate, but with 5 mm increments in water surface elevation.
- Collect seven head and discharge readings for each weir.
9. Results and Calculations
Please visit this link for accessing excel workbook for this experiment.
9.1. Result
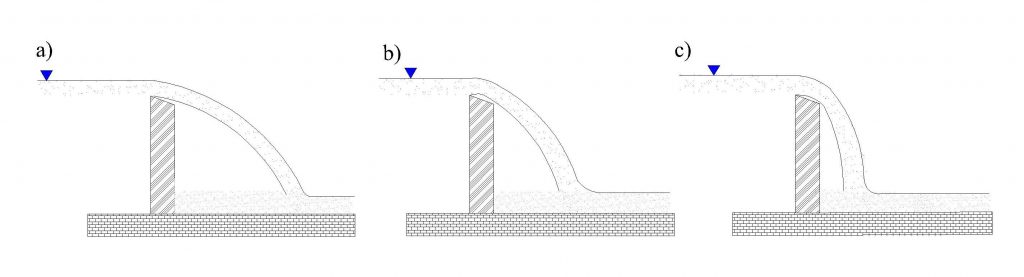
Use the following tables to record your measurements. Record any observations of the shape and the type of nappe, paying particular attention to whether the nappe was clinging or sprung clear, and of the end contraction and general change in shape. (See Figure 9.4 to classify the nappe).
Raw Data Table: R-notch
| Test No. | Datum Height ho (m) | Water Surface Elev. h(m) | Volume Collected (L) | Time for Collection (s) |
| 1 | ||||
| 2 | ||||
| 3 | ||||
| 4 | ||||
| 5 | ||||
| 6 | ||||
| 7 |
Raw Data Table: V-notch
| Test No. | Datum Height ho (m) | Water Surface Elev. h(m) | Volume Collected (L) | Time for Collection (s) |
| 1 | ||||
| 2 | ||||
| 3 | ||||
| 4 | ||||
| 5 | ||||
| 6 | ||||
| 7 |
9.2. Calculations
The following dimensions from the equipment can be used in the appropriate calculations:
– width of rectangular notch (b) = 0.03 m
– angle of V-notch () = 90°
- Calculate discharge (Q) and head (h) for each experiment, and record them in the Result Tables. For calculation purposes, the depth of the water above the weir is the difference between each water level reading and the datum reading, i.e., H = h-ho
- Calculate H5/2and H3/2 for the triangular and rectangular notches, respectively.
- For each measurement, calculate the experimental values of for the triangular and rectangular notches, using Equations 3 and 4, respectively.
- Record your calculations in the Results Tables.
Result Table: R-notch
| No. | H (m) | Volume Collected (m3) | Flow Rate (m3/s) | H 3/2 | Experimental Cd | Theoretical Cd | %Error |
| 1 | |||||||
| 2 | |||||||
| 3 | |||||||
| 4 | |||||||
| 5 | |||||||
| 6 | |||||||
| 7 |
Result Table: V-notch
| No. | H (m) | Volume Collected (m3) | Flow Rate (m3/s) | H 3/2 | Experimental Cd | Theoretical Cd | %Error |
| 1 | |||||||
| 2 | |||||||
| 3 | |||||||
| 4 | |||||||
| 5 | |||||||
| 6 | |||||||
| 7 |
10. Report
Use the template provided to prepare your lab report for this experiment. Your report should include the following:
- Table(s) of raw data
- Table(s) of results
- Graph(s)
- Schematic drawings or photos of the nappes observed during each experiment, with an indication of their type.
- Plot a graph of Q (y-axis) against H 3/2(x-axis) for the rectangular weir and Q against H 5/2 for the triangular weir. Use a linear function to plot the best fit, and express the relationship between Q and Hn and in the form of:
 in which the exponent value n is 1.5 for the rectangular weir and 2.5 for the triangular weir. Calculate the coefficients of discharge Cd (theoretical method) using Equations 5 and 6. Record Cd values calculated from the theoretical method in the Result Tables.
- for a rectangular notch:

- for a triangular notch:

- Compare the experimental results to the theory by calculating the percentage of error.
- What are the limitations of the theory?
- Why would you expect wider variation of Cd values at lower flow rates?
- Compare the results for Cd of the weirs utilized in this experiment with those you may find in a reliable source (e.g., textbooks). Include in your report a copy of the tables or graphs you have used for textbook values of Cd.
- Discuss your observations and any source of errors in calculation of Cd.
