Experiment #6: Orifice and Free Jet Flow
1. Introduction
An orifice is an opening, of any size or shape, in a pipe or at the bottom or side wall of a container (water tank, reservoir, etc.), through which fluid is discharged. If the geometric properties of the orifice and the inherent properties of the fluid are known, the orifice can be used to measure flow rates. Flow measurement by an orifice is based on the application of Bernoulli’s equation, which states that a relationship exists between the pressure of the fluid and its velocity. The flow velocity and discharge calculated based on the Bernoulli’s equation should be corrected to include the effects of energy loss and viscosity. Therefore, for accurate results, the coefficient of velocity (Cv) and the coefficient of discharge (Cd) should be calculated for an orifice. This experiment is being conducted to calibrate the coefficients of the given orifices in the lab.
2. Practical Application
Orifices have many applications in engineering practice besides the metering of fluid flow in pipes and reservoirs. Flow entering a culvert or storm drain inlet may act as orifice flow; the bottom outlet of a dam is another example. The coefficients of velocity and discharge are necessary to accurately predict flow rates from orifices.
3. Objective
The objective of this lab experiment is to determine the coefficients of velocity and discharge of two small orifices in the lab and compare them with values in textbooks and other reliable sources.
4. Method
The coefficients of velocity and discharge are determined by measuring the trajectory of a jet issuing fluid from an orifice in the side of a reservoir under steady flow conditions, i.e., a constant reservoir head.
5. Equipment
The following equipment is required to perform the orifice and free jet flow experiment:
- F1-10 hydraulics bench;
- F1-17 orifice and free jet flow apparatus, with two orifices having diameters of 3 and 6 mm;
- Measuring cylinder for flow measurement; and
- Stopwatch for timing the flow measurement.
6. Equipment Description
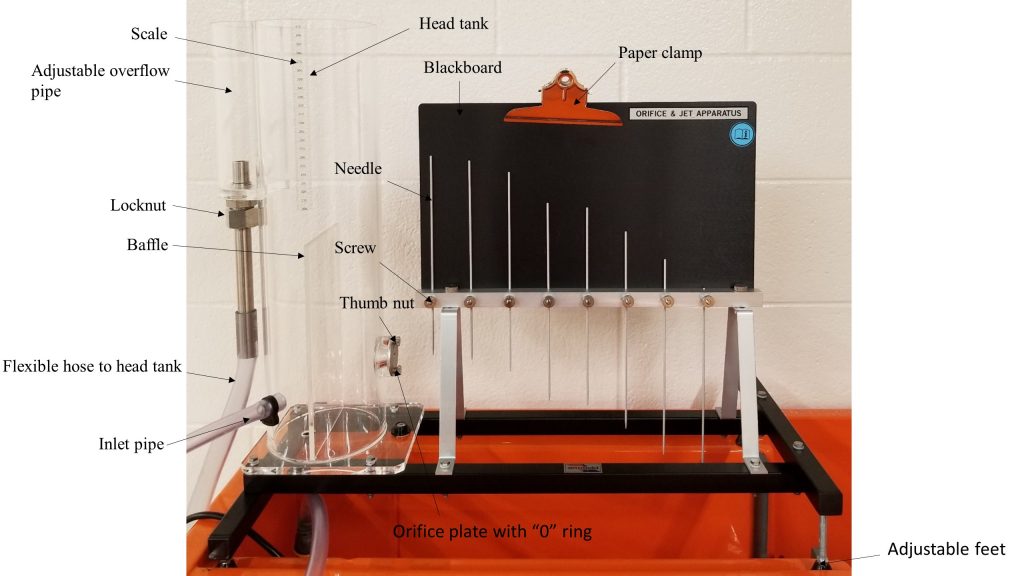
The orifice and free jet flow apparatus consists of a cylindrical head tank with an orifice plate set into its side (Figure 6.1). An adjustable overflow pipe is adjacent to the head tank to allow changes in the water level. A flexible hose attached to the overflow pipe returns excess water to the hydraulics bench. A scale attached to the head tank indicates the water level. A baffle at the base of the head tank promotes smooth flow conditions inside the tank, behind the orifice plate. Two orifice plates with 3 and 6 mm diameters are provided and may be interchanged by slackening the two thumb nuts. The trajectory of the jet may be measured, using the vertical needles. For this purpose, a sheet of paper should be attached to the backboard, and the needles should be adjusted to follow the trajectory of the water jet. The needles may be locked, using a screw on the mounting bar. The positions of the tops of the needles can be marked to plot the trajectory. A drain plug in the base of the head tank allows water to be drained from the equipment at the end of the experiment [6].
7. Theory
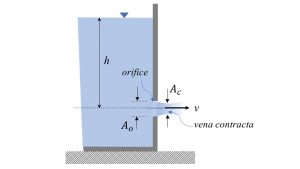
The orifice outflow velocity can be calculated by applying Bernoulli’s equation (for a steady, incompressible, frictionless flow) to a large reservoir with an opening (orifice) on its side (Figure 6.2):

where h is the height of fluid above the orifice. This is the ideal velocity since the effect of fluid viscosity is not considered in deriving Equation 1. The actual flow velocity, however, is smaller than vi and is calculated as:

Cv is the coefficient of velocity, which allows for the effects of viscosity; therefore, Cv <1. The actual outflow velocity calculated by Equation (2) is the velocity at the vena contracta, where the diameter of the jet is the least and the flow velocity is at its maximum (Figure 6.2).
The actual outflow rate may be calculated as:

where Ac is the flow area at the vena contracta. Ac is smaller than the orifice area, Ao (Figure 6.2), and is given by:

where Cc is the coefficient of contraction; therefore, Cc < 1.
Substituting v and Ac from Equations 2 and 4 into Equation 3 results in:

The product CvCc is called the coefficient of discharge, Cd; Thus, Equation 5 can be written as:

The coefficient of velocity, Cv, and coefficient of discharge, Cd, are determined experimentally as follows.
7.1. Determination of the Coefficient of Velocity
If the effect of air resistance on the jet leaving the orifice is neglected, the horizontal component of the jet velocity can be assumed to remain constant. Therefore, the horizontal distance traveled by jet (x) in time (t) is equal to:

The vertical component of the trajectory of the jet will have a constant acceleration downward due to the force of gravity. Therefore, at any time, t, the y-position of the jet may be calculated as:

Rearranging Equation (8) gives:

Substitution of t and v from Equations 9 and 2 into Equation 7 results in:

Equations (10) can be rearranged to find Cv:

Therefore, for steady flow conditions (i.e., constant h in the head tank), the value of Cv can be determined from the x, y coordinates of the jet trajectory. A graph of x plotted against  will have a slope of 2Cv.
7.2. Determination of the Coefficient of Discharge
If Cd is assumed to be constant, then a graph of Q plotted against  (Equation 6) will be linear, and the slope of this graph will be:

8. Experimental Procedure
This experiment will be performed in two parts. Part A is performed to determine the coefficient of velocity, and Part B is conducted to determine the coefficient of discharge.
Set up the equipment as follows:
- Locate the apparatus over the channel in the top of the bench.
- Using the spirit level attached to the base, level the apparatus by adjusting the feet.
- Connect the flexible inlet tube on the side of the head tank to the bench quick-release fitting.
- Place the free end of the flexible tube from the adjustable overflow on the side of the head tank into the volumetric. Make sure that this tube will not interfere with the trajectory of the jet flowing from the orifice
- Secure each needle in the raised position by tightening the knurled screw.
Part A: Determination of coefficient of velocity from jet trajectory under constant head
- Install the 3-mm orifice in the fitting on the right-hand side of the head tank, using the two securing screws supplied. Ensure that the O-ring seal is fitted between the orifice and the tank.
- Close the bench flow control valve, switch on the pump, and then gradually open the bench flow control valve. When the water level in the head tank reaches the top of the overflow tube, adjust the bench flow control valve to provide a water level of 2 to 3 mm above the overflow pipe level. This will ensure a constant head and produce a steady flow through the orifice.
- If necessary, adjust the frame so that the row of needles is parallel with the jet, but is located 1 or 2 mm behind it. This will avoid disturbing the jet, but will minimize errors due to parallax.
- Attach a sheet of paper to the backboard, between the needles and board, and secure it in place with the clamp provided so that its upper edge is horizontal.
- Position the overflow tube to give a high head (e.g., 320 mm). The jet trajectory is obtained by using the needles mounted on the vertical backboard to follow the profile of the jet.
- Release the securing screw for each needle, and move the needle until its point is just immediately above the jet. Re-tighten the screw.
- Mark the location of the top of each needle on the paper. Note the horizontal distance from the plane of the orifice (taken as ) to the coordinate point marking the position of the first needle. This first coordinate point should be close enough to the orifice to treat it as having the value of y=0. Thus, y displacements are measured relative to this position.
- The volumetric flowrate through the orifice can be determined by intercepting the jet, using the measuring cylinder and a stopwatch. The measured flow rates will be used in Part B.
- Repeat this test for lower reservoir heads (e.g., 280 mm and 240 mm)
Repeat the above procedure for the second orifice with diameter of 6 mm.
Part B: Determination of coefficient of discharge under constant head
- Position the overflow tube to have a head of 300 mm in the tank. (You may have to adjust the level of the overflow tube to achieve this.)
- Measure the flow rate by timed collection, using the measuring cylinder provided.
- Repeat this procedure for a head of 260 mm.
The procedure should also be repeated for the second orifice.
9. Results and Calculations
Please visit this link for accessing excel workbook for this experiment.
9.1. Results
Use the following tables to record your measurements.
Raw Data Table: Part A
| Needle No. |
Orifice Diameter (m) |
x (m) |
Head (m) | y(m) | ||||
| Trial 1 | Trial 2 | Trial 3 | Trial 1 | Trial 2 | Trial 3 | |||
| 1 | 0.003 | 0.014 | ||||||
| 2 | 0.064 | |||||||
| 3 | 0.114 | |||||||
| 4 | 0.164 | |||||||
| 5 | 0.214 | |||||||
| 6 | 0.264 | |||||||
| 7 | 0.314 | |||||||
| 8 | 0.364 | |||||||
| Needle No. |
Orifice Diameter (m) |
x (m) |
Head (m) | y(m) | ||||
| Trial 1 | Trial 2 | Trial 3 | Trial 1 | Trial 2 | Trial 3 | |||
| 1 | 0.006 | 0.014 | ||||||
| 2 | 0.064 | |||||||
| 3 | 0.114 | |||||||
| 4 | 0.164 | |||||||
| 5 | 0.214 | |||||||
| 6 | 0.264 | |||||||
| 7 | 0.314 | |||||||
| 8 | 0.364 | |||||||
Raw Data Table: Part B
|
Test |
Orifice Diameter (m) |
Head (m) |
Volume (L) |
Time (s) |
| 1 | 0.003 | |||
| 2 | ||||
| 3 | ||||
| 4 | ||||
| 5 | ||||
| 6 | 0.006 | |||
| 7 | ||||
| 8 | ||||
| 9 | ||||
| 10 |
9.2. Calculations
Calculate the values of (y.h)1/2 for Part A and discharge (Q) and (h0.5) for Part B. Record your calculations in the following Result Tables.
The following dimensions of the equipment are used in the appropriate calculations. If necessary, these values may be checked as part of the experimental procedure and replaced with your measurements [6].
– Diameter of the small orifice: 0.003 m
– Diameter of the large orifice: 0.006 m
– Pitch of needles: 0.05 m
Result Table- Part A
| Needle No. |
Orifice Diameter (m) |
x (m) |
Head (m) | y(m) | (y.h)1/2(m) |
||||||
| Trial 1 | Trial 2 | Trial 3 | Trial 1 | Trial 2 | Trial 3 | Trial 1 | Trial 2 | Trial 3 | |||
| 1 | 0.003 | 0.014 | |||||||||
| 2 | 0.064 | ||||||||||
| 3 | 0.114 | ||||||||||
| 4 | 0.164 | ||||||||||
| 5 | 0.214 | ||||||||||
| 6 | 0.264 | ||||||||||
| 7 | 0.314 | ||||||||||
| 8 | 0.364 | ||||||||||
| Needle No. |
Orifice Diameter (m) |
x (m) |
Head (m) | y(m) | (y.h)1/2(m) |
||||||
| Trial 1 | Trial 2 | Trial 3 | Trial 1 | Trial 2 | Trial 3 | Trial 1 | Trial 2 | Trial 3 | |||
| 1 | 0.006 | 0.014 | |||||||||
| 2 | 0.064 | ||||||||||
| 3 | 0.114 | ||||||||||
| 4 | 0.164 | ||||||||||
| 5 | 0.214 | ||||||||||
| 6 | 0.264 | ||||||||||
| 7 | 0.314 | ||||||||||
| 8 | 0.364 | ||||||||||
Result Table- Part B
|
Test |
Orifice Diameter (m) |
Head (m) |
Volume (L) |
Time (s) |
Volume (m3) | Q (m3/sec) |
h0.5 (m0.5) |
| 1 | 0.003 | ||||||
| 2 | |||||||
| 3 | |||||||
| 4 | |||||||
| 5 | |||||||
| 6 | 0.006 | ||||||
| 7 | |||||||
| 8 | |||||||
| 9 | |||||||
| 10 |
10. Report
Use the template provided to prepare your lab report for this experiment. Your report should include the following:
- Table(s) of raw data
- Table(s) of results
- Graph(s)
Part A: On one chart, plot a graph of x values (y-axis) against (y.h)1/2 values (x-axis) for each test. Calculate the slope of these graphs, using the equation of the best-fit for your experimental data and by setting the intercept to zero. Using Equation 11, calculate the coefficient of velocity for each orifice as:

Part B: Plot Q values (y-axis) against (h)0.5 values (x-axis). Determine the slope of this graph, using the equation of the best- fit for your experimental data and by setting the intercept to zero. Based on Equation 12, calculate the coefficient of discharge for each orifice, using the equation of the best-fit for your experimental data and the following relationship:

- Find the recommended values for Cv and Cd of the orifices utilized in this experiment from reliable sources (e.g., textbooks). Comment on the agreement between the textbook values and experimental results, and give reasons for any differences.
- Comment on the significance of any experimental errors.
