Chapter 7: Waves and Doppler Effect
This chapter discusses the propagation of sound waves because it is critical to understanding and mitigating the noise pollution resulting from transportation projects. A related concept, i.e., the Doppler Effect, is helpful in understanding the use of radar guns for traffic speed enforcement and spot speed studies.
Learning Objectives
At the end of the chapter, the reader should be able to do the following:
- Define a wave and its basic properties (e.g., Period, Wavelength, and Frequency).
- List different wave types.
- Describe the movement of sound waves.
- Describe Doppler Effect and its implications.
- Identify topics in the introductory transportation engineering courses that build on the Physics concept discussed in this course.
wave properties
What do we mean when we say something is a wave? The most intuitive and easiest wave to imagine is the familiar water wave. More precisely, a wave is a disturbance that propagates or moves from the place it was created. For water waves, the disturbance is in the surface of the water, perhaps created by a rock thrown into a pond or by a swimmer splashing the surface repeatedly. For sound waves, the disturbance is a change in air pressure, perhaps created by the oscillating cone inside a speaker. For earthquakes, there are several types of disturbances, including disturbance of Earth’s surface and pressure disturbances under the surface. Even radio waves are most easily understood using an analogy with water waves. Visualizing water waves is useful because there is more to it than just a mental image. Water waves exhibit characteristics common to all waves, such as amplitude, period, frequency, and energy. All wave characteristics can be described by a small set of underlying principles.
Wave Movement
A wave is a disturbance that propagates or moves from the place it was created. The simplest waves repeat themselves for several cycles and are associated with simple harmonic motion. Let us start by considering the simplified water wave in Figure 1 below. The wave is an up and down disturbance of the water surface. It causes a sea gull to move up and down in simple harmonic motion as the wave crests and troughs (peaks and valleys) pass under the bird. The time for one complete up and down motion is the wave’s period 𝑇. The wave’s frequency  . The wave itself moves to the right in the figure. This movement of the wave is actually the disturbance moving to the right, not the water itself (or the bird would move to the right). We define wave velocity
  to be the speed at which the disturbance moves. Wave velocity is sometimes also called the propagation velocity or propagation speed because the disturbance propagates from one location to another.
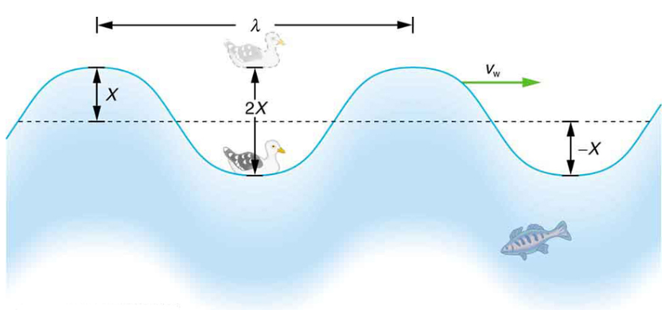 .
. The water wave in Figure 1 also has a length associated with it, called its wavelength 𝜆, the distance between adjacent identical parts of a wave. (𝜆 is the distance parallel to the direction of propagation.) The speed of propagation is the distance the wave travels in a given time, which is one wavelength in the time of one period. In equation form, that is

Or

This fundamental relationship holds for all types of waves. For water waves, is the speed of a surface wave; for sound, is the speed of sound; and for visible light, is the speed of light, for example.
Applying the Science Practices: Different Types of Waves
Consider a spring fixed to a wall with a mass connected to its end. This fixed point on the wall exerts a force on the complete spring-and-mass system, and this implies that the momentum of the complete system is not conserved. Now, consider energy. Since the system is fixed to a point on the wall, it does not do any work; hence, the total work done is conserved, which means that the energy is conserved. Consequently, we have an oscillator in which energy is conserved but momentum is not. Now, consider a system of two masses connected to each other by a spring. This type of system also forms an oscillator. Since there is no fixed point, momentum is conserved as the forces acting on the two masses are equal and opposite. Energy for such a system will be conserved because there are no external forces acting on the spring-two-masses system. It is clear from above that, for momentum to be conserved, momentum needs to be carried by waves. This is a typical example of a mechanical oscillator producing mechanical waves, which need a medium in which to propagate. Sound waves are also examples of mechanical waves. Some types of waves can travel in the absence of a medium of propagation. Such waves: they are called “electromagnetic waves.” Light waves are examples of electromagnetic waves. Electromagnetic waves are created by the vibration of electric charge. which This vibration creates a wave with both electric and magnetic field components.
Traverse and Longitudinal Waves
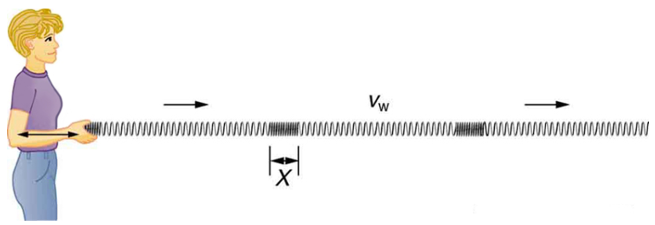
A simple wave consists of a periodic disturbance that propagates from one place to another. The wave in Figure 2 below propagates in the horizontal direction while the surface is disturbed in the vertical direction. Such a wave is called a transverse wave or shear wave; in such a wave, the disturbance is perpendicular to the direction of propagation. In contrast, in a longitudinal wave or compressional wave, the disturbance is parallel to the direction of propagation. Figure 3 below shows an example of a longitudinal wave. The size of the disturbance is its amplitude X and is completely independent of the speed of propagation .
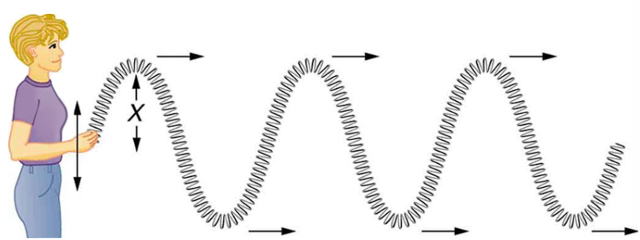
Waves may be transverse, longitudinal, or a combination of the two. (Water waves are actually a combination of transverse and longitudinal. The simplified water wave illustrated in Figure 1 shows no longitudinal motion of the bird.) The waves on the strings of musical instruments are transverse—so are electromagnetic waves, such as visible light.
Sound waves in air and water are longitudinal. Their disturbances are periodic variations in pressure that are transmitted in fluids. Fluids do not have appreciable shear strength, and thus the sound waves in them must be longitudinal or compressional. Sound in solids can be both longitudinal and transverse.
Earthquake waves under Earth’s surface also have both longitudinal and transverse components (called compressional or P-waves and shear or S-waves, respectively). These components have important individual characteristics—they propagate at different speeds, for example. Earthquakes also have surface waves that are similar to surface waves on water.
Basic Properties of Waves
Check Your Understanding: Basic Properties of Waves
Wave on a String (Simulation)
Energy in Waves: Intensity
All waves carry energy. The energy of some waves can be directly observed. Earthquakes can shake whole cities to the ground, performing the work of thousands of wrecking balls.
Loud sounds pulverize nerve cells in the inner ear, causing permanent hearing loss. Ultrasound is used for deep-heat treatment of muscle strains. A laser beam can burn away a malignancy. Water waves chew up beaches.
The amount of energy in a wave is related to its amplitude. Large-amplitude earthquakes produce large ground displacements. Loud sounds have higher pressure amplitudes and come from larger-amplitude source vibrations than soft sounds. Large ocean breakers churn up the shore more than small ones. More quantitatively, a wave is a displacement that is resisted by a restoring force.
The energy effects of a wave depend on time as well as amplitude. For example, the longer deep-heat ultrasound is applied, the more energy it transfers. Waves can also be concentrated or spread out. Sunlight, for example, can be focused to burn wood. Earthquakes spread out, so they do less damage the farther they get from the source. In both cases, changing the area the waves cover has important effects. All these pertinent factors are included in the definition of intensity I as power per unit area:

Where P is the power carried by the wave through area A. The definition of intensity is valis for any energy in transit, including that carried by waves. The SI unit for intensity is watts per square meter  . For example, infrared and visible energy from the Sun impinge on Earth at an intensity of 1300
  just above the atmosphere. There are other intensity-related units in use, too. The most common is the decibel. For example, a 90-decibel sound level corresponds to an intensity of
  . (This quantity is not much power per unit area considering that 90 decibels is a relatively high sound level. Decibels will be discussed in some detail in a later chapter.)
Describe the Movement of Sound Waves in the Environment
In this section, you will learn how to understand the physics, speed, wavelength, intensity, and level of sound by reading each description along with watching the videos included. Also, short problems to check your understanding are included.
Physics of Hearing: Sound
Sound can be used as a familiar illustration of waves. Because hearing is one of our most important senses, it is interesting to see how the physical properties of sound correspond to our perceptions of it. Hearing is the perception of sound, just as vision is the perception of visible light. The physical phenomenon of sound is defined to be a disturbance of matter that is transmitted from its source outward. Sound is a wave. The amplitude of a sound wave decreases with distance from its source, because the energy of the wave is spread over a larger and larger area. But it is also absorbed by objects, such as the eardrum.
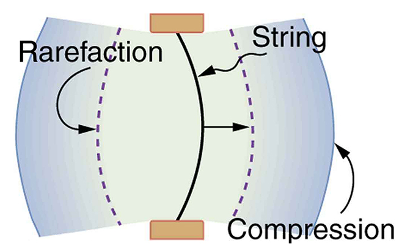
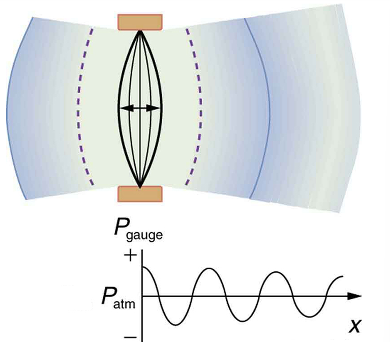
A vibrating string produces a sound wave as illustrated in Figures 4, 5, and 6. As the string oscillates back and forth, it transfers energy to the air, mostly as thermal energy created by turbulence. But a small part of the string’s energy goes into compressing and expanding the surrounding air, creating slightly higher and lower local pressures. These compressions (high pressure regions) and rarefactions (low pressure regions) move out as longitudinal pressure waves having the same frequency as the string—they are the disturbance that is a sound wave. (Sound waves in air and most fluids are longitudinal because fluids have almost no shear strength. In solids, sound waves can be both transverse and longitudinal.) Figure 6 shows a graph of gauge pressure versus distance from the vibrating string.
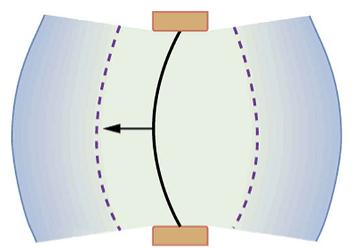
Speed of Sound, Frequency, and Wavelength
Sound, like all waves, travels at a certain speed and has the properties of frequency and wavelength. You can observe direct evidence of the speed of sound while watching a fireworks display. The flash of an explosion is seen well before its sound is heard, implying both that sound travels at a finite speed and that it is much slower than light. You can also directly sense the frequency of a sound. Perception of frequency is called pitch. The wavelength of sound is not directly sensed, but indirect evidence is found in the correlation of the size of musical instruments with their pitch. Small instruments, such as a piccolo, typically make high-pitch sounds, while large instruments, such as a tuba, typically make low-pitch sounds. High pitch means small wavelength, and the size of a musical instrument is directly related to the wavelengths of sound it produces. So, a small instrument creates short-wavelength sounds. Similar arguments hold that a large instrument creates long-wavelength sounds.
The relationship of the speed of sound, its frequency, and wavelength is the same as for all waves:
Where  is the speed of sound, f is its frequency, and 𝜆 is its wavelength. The wavelength of a sound is the distance between adjacent identical parts of a wave – for example, between adjacent compressions as illustrated in Figure 7. The frequency is the same as that of the source and is the number of waves that pass a point per unit of time.
 , and has a wavelength 𝜆
 The speed of sound can change when sound travels from one medium to another. However, the frequency usually remains the same because it is like a driven oscillation and has the frequency of the original source. If changes and f remains the same, then the wavelength 𝜆 must change. That is, because , the higher the speed of a sound, the greater its wavelength for a given frequency.
Check Your Understanding: Speed of Sound, Frequency, and Wavelength
Sound Intensity and Sound Level
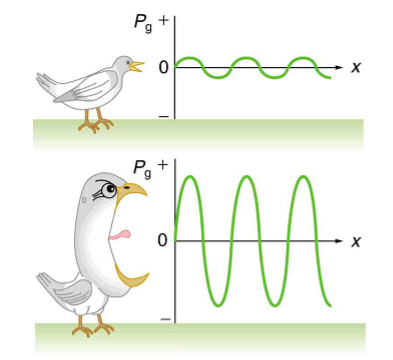
In a quiet forest, you can sometimes hear a single leaf fall to the ground. After settling into bed, you may hear your blood pulsing through your ears. But when a passing motorist has his stereo turned up, you cannot even hear what the person next to you in your car is saying. We are all very familiar with the loudness of sounds and aware that they are related to how energetically the source is vibrating. In cartoons depicting a screaming person (or an animal making a loud noise), the cartoonist often shows a gaping mouth with a vibrating uvula, the hanging tissue at the back of the mouth, to suggest a loud sound coming from the throat (see Figure 8 below). High noise exposure is hazardous to hearing, and it is common for musicians to have hearing losses that are sufficiently severe that they interfere with the musicians’ abilities to perform. The relevant physical quantity is sound intensity, a concept that is valid for all sounds whether or not they are in the audible range.
Intensity is defined to be the power per unit area carried by a wave. Power is the rate at which energy is transferred by the wave. In equation form intensity  , where P is the power through an area A.
Sound intensity levels are quoted in decibels (dB) much more often than sound intensities in watts per meter squared. Decibels are the unit of choice in the scientific literature as well as in the popular media. The reasons for this choice of units are related to how we perceive sounds. How our ears perceive sound can be more accurately described by the logarithm of the intensity rather than directly to the intensity. The sound intensity level  in decibels of a sound having an intensity I in watts per meter squared is defined to be
  is a reference intensity. In particular,
  is the lowest or threshold intensity of sound a person with normal hearing can perceive at a frequency of 1000 Hz. Sound intensity level is not the same as intensity. Because
  is defined in terms of a ratio, it is a unitless quantity telling you the level of the sound relative to a fixed standard
  , in this case). The units of decibels (dB) are used to indicate this ratio is multiplied by 10 in its definition. The bel, upon which the decibel is based, is named for Alexander Graham Bell, the inventor of the telephone.
| Sound intensity level β (dB) | Intensity I(W/m2) | Example/effect |
|---|---|---|
| 0 | 1×10–12 | Threshold of hearing at 1000 Hz |
| 10 | 1×10–11 | Rustle of leaves |
| 20 | 1×10⁻¹⁰ | Whisper at 1 m distance |
| 30 | 1×10⁻⁹ | Quiet home |
| 40 | 1×10⁻⁸ | Average home |
| 50 | 1×10⁻⁷ | Average office, soft music |
| 60 | 1×10⁻⁶ | Normal conversation |
| 70 | 1×10⁻⁵ | Noisy office, busy traffic |
| 80 | 1×10⁻⁴ | Loud radio, classroom lecture |
| 90 | 1×10⁻³ | Inside a heavy truck; damage from prolonged exposure1 |
| 100 | 1×10⁻² | Noisy factory, siren at 30 m; damage from 8 h per day exposure |
| 110 | 1×10⁻¹ | Damage from 30 min per day exposure |
| 120 | 1 | Loud rock concert, pneumatic chipper at 2 m; threshold of pain |
| 140 | 1×10² | Jet airplane at 30 m; severe pain, damage in seconds |
| 160 | 1×10⁴ | Bursting of eardrums |
The decibel level of a sound having the threshold intensity of  is
is  dB, because
  . That is, the threshold of hearing is 0 decibels. Table 1 gives levels in decibels and intensities in watts per meter squared for some familiar sounds.
Check Your Understanding: Sound Intensity and Sound Level
Wave Interference (PhET Simulation)
Sound Waves and Their Sources (1933 movie clip)
Acoustics and Your Environment: The Basics of Sounds and Highway Traffic Noise (48 min)
Describe the Doppler Effect in the Context of Waves Emanating from a Moving Source
The characteristic sound of a motorcycle buzzing by is an example of the Doppler effect. The high-pitch scream shifts dramatically to a lower-pitch roar as the motorcycle passes by a stationary observer. The closer the motorcycle brushes by, the more abrupt the shift. The faster the motorcycle moves, the greater the shift. We also hear this characteristic shift in frequency for passing race cars, airplanes, and trains.
The Doppler effect is an alteration in the observed frequency of a sound due to motion of either the source or the observer. Although less familiar, this effect is easily noticed for a stationary source and moving observer. For example, if you ride a train past a stationary warning bell, you will hear the bell’s frequency shift from high to low as you pass by. The actual change in frequency due to relative motion of source and observer is called a Doppler shift. The Doppler effect and Doppler shift are named for the Austrian physicist and mathematician Christian Johann Doppler (1803–1853), who did experiments with both moving sources and moving observers. Doppler, for example, had musicians play on a moving open train car and also play standing next to the train tracks as a train passed by. Their music was observed both on and off the train, and changes in frequency were measured.
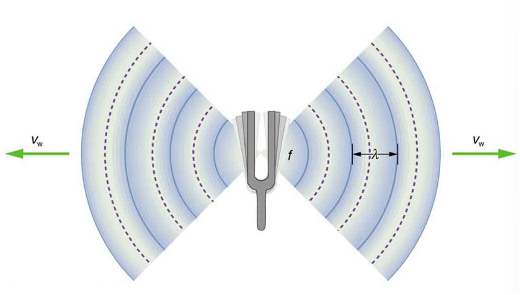
What causes the Doppler shift? Figures 9, 10, and 11 compare sound waves emitted by stationary and moving sources in a stationary air mass. Each disturbance spreads out spherically from the point where the sound was emitted. If the source is stationary, then all of the spheres representing the air compressions in the sound wave centered on the same point, and the stationary observers on either side see the same wavelength and frequency as emitted by the source, as seen in Figure 9. If the source is moving, as in Figure 10, then the situation is difference. Each compression of the air moves out in a sphere from the point where it was emitted, but the point of emission moves. This moving emission point causes the air compressions to be closer together on one side and farther apart on the other. Thus, the wavelength is shorter in the direction the source is moving (on the right in Figure 10), and longer in the opposite direction (on the left in Figure 10). Finally, if the observers move, as in Figure 11, the frequency at which they receive the compressions changes. The observer moving toward the source receives them at a higher frequency, and the person moving away from the source receives them at a lower frequency.
We know that wavelength and frequency are related by , where is the fixed speed of sound. The sound moves in a medium and has the same speed in that medium whether the source is moving or not. The f multiplied by  is a constant. Because the observer on the fight in the Figure 10 receives a shorter wavelength, the frequency she receives must be higher. Similarly, the observer on the left receives a longer wavelength, and hence he hears a lower frequency. The same thing happens in Figure 11. A higher frequency is received by the observer moving toward the source, and a lower frequency is received by an observer moving away from the source. In general, then, relative motion of source and observer toward one another increases the received frequency. Relative motion apart decreases frequency. The greater the relative speed is, the greater the effect.
What is the Doppler Effect?
Check Your Understanding: What is the Doppler Effect?
Identify the Causes of Noise from the Transportation System
In this section, you will learn about the causes of transportation system noise. To gain a better understanding of the many different noises associated with our environment, please read the article “Traffic Noise and Transportation” by The Center for Environmental Excellence by the American Association of State Highway and Transportation Officials (AASHTO).
Adsorptive Sound Wall Systems
Relevance to Transportation Engineering Coursework
In this section, you will learn about spot speed study and speed limit enforcement helping ensure that roadway design is consistent with speed on roadways and highways. You will also learn about sustainable transportation planning and development.
Spot speed study and speed limit enforcement
The information from spot speed studies is critical for the enforcement and implementation of speed management strategies if needed. A Doppler radar, either hand-held, vehicle-mounted, or poll-mounted, has been one of the most commonly used tools for speed limit enforcement. These devices are also useful in conducting spot speed studies to ensure that the roadway design is consistent with the desired speed for the street and highways. Newer Lidar-based speed measurement also works based on the Doppler Effect discussed in this chapter.
Transportation Planning and Sustainable Development
As we learn about the ill effects of noise pollution, it becomes a vital part of the environmental impact assessments and mitigation for transportation projects. It remains a critical equity concern since, historically, lower-income and minoritized communities bear the brunt of the impact of traffic-related noise. Traffic noise barriers are one of the key mitigation measures that manipulate sound waves to reduce their intensity and help minimize their impact. Noise barriers reduce the sound entering a community by either absorbing/reflecting the sound of traffic or forcing the waves to take an alternate path over and around the obstacle. The design of noise barriers is based on the wave propagation principles outlined in this chapter.
Key Takeaways
- The technology used for spot speed studies and speed limit enforcement is based on the Doppler effect in wave propagation. Spot speed studies are critical to ensure that the roadway design context aligns with the speed limit posted on the roadway segment.
- The design of noise barriers to protect communities surrounding freeways and railroads from noise pollution is based on the wave propagation principles discussed in this chapter. It has been an equity issue since marginalized lower-income communities have historically borne the most impact of roadway noise pollution.
Glossary: key terms
Amplitude[1] – the maximum displacement from the equilibrium position of an object oscillating around the equilibrium position
Doppler effect[1] – an alteration in the observed frequency of a sound due to motion of either the source or the observer
Doppler shift[1] – the actual change in frequency due to relative motion of source and observer
Frequency[1] – number of events per unit of time
Hearing[1] – the perception of sound
Intensity[1] – power per unit area; sounds below 20 Hz
Longitudinal Wave[1] – a wave in which the disturbance is parallel to the direction of propagation
Loudness[1] – the perception of sound intensity
Natural Frequency[1] – the frequency at which a system would oscillate if there were no driving and no damping forces
Period[1] – time it takes to complete one oscillation
Pitch[1] – the perception of the frequency of a sound
Sound[1] – a disturbance of matter that is transmitted from its source outward
Sound Intensity Level[1] – a unitless quantity telling you the level of the sound relative to a fixed standard
Sound Pressure Level[1] – the ratio of the pressure amplitude to a reference pressure
Tone[1] – number and relative intensity of multiple sound frequencies
Traverse Wave[1] – a wave in which the disturbance is perpendicular to the direction of propagation
Wave[1] – a disturbance that moves from its source and carries energy
Wave Velocity[1] – the speed at which the disturbance moves. Also called the propagation velocity or propagation speed
Wavelength[1] – the distance between adjacent identical parts of a wave
[1] “College Physics for AP® Courses” by Greg Wolfe, Erika Gasper, John Stoke, Julie Kretchman, David Anderson, Nathan Czuba, Sudhi Oberoi, Liza Pujji, Irina Lyublinskaya, Douglas Ingram. Access for free at https://openstax.org/books/college-physics-ap-courses/pages/1-connection-for-ap-r-courses
Media Attributions
NOTE: Text by Greg Wolfe, et al.: Access for free at https://openstax.org/books/college-physics-ap-courses/pages/1-connection-for-ap-r-courses
Videos
- Video 1:“Basic Properties of Waves” by Animations for Physics and Astronomy is licensed under Creative Commons Attribution-ShareAlike 3.0 Unported (CC BY-SA 3.0)
- Video 2: “Sound Waves and Their Sources (1933) Remastered” by Sterocanvas is licensed under Creative Commons Attribution-ShareAlike 3.0 Unported (CC BY-SA 3.0)
- Video 3: “Acoustics and Your Environment: The Bais of Sound and Highway Traffic Noise” by PublicResourceOrg is licensed under Creative Commons Attribution-ShareAlike 3.0 Unported (CC BY-SA 3.0)
- Video 4: “What is the Doppler Effect?” by Engineering Technology Simulation Learning Videos is licensed under Creative Commons Attribution-ShareAlike 3.0 Unported (CC BY-SA 3.0)
- Video 5: “Adsorptive Sound Wall Systems” by SoundFighterWalls is licensed under Creative Commons Attribution-ShareAlike 3.0 Unported (CC BY-SA 3.0)
Figures
- Figure 1: “Chapter 16: Oscillatory Motion and Waves” by Greg Wolfe, Erika Gasper, John Stoke, Julie Kretchman, David Anderson, Nathan Czuba, Sudhi Oberoi, Liza Pujji, Irina Lyublinskaya, and Douglas Ingram is licensed under Creative Commons Attribution 4.0 International (CC BY 4.0)
- Figure 2: “Chapter 16: Oscillatory Motion and Waves” by Greg Wolfe, Erika Gasper, John Stoke, Julie Kretchman, David Anderson, Nathan Czuba, Sudhi Oberoi, Liza Pujji, Irina Lyublinskaya, and Douglas Ingram is licensed under Creative Commons Attribution 4.0 International (CC BY 4.0)
- Figure 3: “Chapter 16: Oscillatory Motion and Waves” by Greg Wolfe, Erika Gasper, John Stoke, Julie Kretchman, David Anderson, Nathan Czuba, Sudhi Oberoi, Liza Pujji, Irina Lyublinskaya, and Douglas Ingram is licensed under Creative Commons Attribution 4.0 International (CC BY 4.0)
- Figure 4: “Chapter 17: Physics of Hearing” by Greg Wolfe, Erika Gasper, John Stoke, Julie Kretchman, David Anderson, Nathan Czuba, Sudhi Oberoi, Liza Pujji, Irina Lyublinskaya, and Douglas Ingram is licensed under Creative Commons Attribution 4.0 International (CC BY 4.0)
- Figure 5: “Chapter 17: Physics of Hearing” by Greg Wolfe, Erika Gasper, John Stoke, Julie Kretchman, David Anderson, Nathan Czuba, Sudhi Oberoi, Liza Pujji, Irina Lyublinskaya, and Douglas Ingram is licensed under Creative Commons Attribution 4.0 International (CC BY 4.0)
- Figure 6: “Chapter 17: Physics of Hearing” by Greg Wolfe, Erika Gasper, John Stoke, Julie Kretchman, David Anderson, Nathan Czuba, Sudhi Oberoi, Liza Pujji, Irina Lyublinskaya, and Douglas Ingram is licensed under Creative Commons Attribution 4.0 International (CC BY 4.0)
- Figure 7: “Chapter 17: Physics of Hearing” by Greg Wolfe, Erika Gasper, John Stoke, Julie Kretchman, David Anderson, Nathan Czuba, Sudhi Oberoi, Liza Pujji, Irina Lyublinskaya, and Douglas Ingram is licensed under Creative Commons Attribution 4.0 International (CC BY 4.0)
- Figure 8: “Chapter 17: Physics of Hearing” by Greg Wolfe, Erika Gasper, John Stoke, Julie Kretchman, David Anderson, Nathan Czuba, Sudhi Oberoi, Liza Pujji, Irina Lyublinskaya, and Douglas Ingram is licensed under Creative Commons Attribution 4.0 International (CC BY 4.0)
- Figure 9: “Chapter 17: Physics of Hearing” by Greg Wolfe, Erika Gasper, John Stoke, Julie Kretchman, David Anderson, Nathan Czuba, Sudhi Oberoi, Liza Pujji, Irina Lyublinskaya, and Douglas Ingram is licensed under Creative Commons Attribution 4.0 International (CC BY 4.0)
- Figure 10: “Chapter 17: Physics of Hearing” by Greg Wolfe, Erika Gasper, John Stoke, Julie Kretchman, David Anderson, Nathan Czuba, Sudhi Oberoi, Liza Pujji, Irina Lyublinskaya, and Douglas Ingram is licensed under Creative Commons Attribution 4.0 International (CC BY 4.0)
- Figure 11: “Chapter 17: Physics of Hearing” by Greg Wolfe, Erika Gasper, John Stoke, Julie Kretchman, David Anderson, Nathan Czuba, Sudhi Oberoi, Liza Pujji, Irina Lyublinskaya, and Douglas Ingram is licensed under Creative Commons Attribution 4.0 International (CC BY 4.0)
Tables
- Table 1: Garnett, A. (2022, April 26). Traffic noise overview. Center for Environmental Excellence | AASHTO. Retrieved July 1, 2022, from https://environment.transportation.org/education/environmental-topics/traffic-noise/traffic-noise-overview/
Simulations
- Simulation 1: “Wave on a String” by PhET Simulations is licensed under Creative Commons Attribution 4.0 International (CC BY 4.0)
- Simulation 2: “Wave Interference” by PhET Simulations is licensed under Creative Commons Attribution 4.0 International (CC BY 4.0)
References
“Traffic Noise and Transportation” by The Center for Environmental Excellence by the American Association of State Highway and Transportation Officials (AASHTO).
- Several government agencies and health-related professional associations recommend that 85 dB not be exceeded for 8-hour daily exposures in the absence of hearing protection. ↵
a disturbance that moves from its source and carries energy
time it takes to complete one oscillation
the speed at which the disturbance moves. Also called the propagation velocity or propagation speed
the distance between adjacent identical parts of a wave
a wave in which the disturbance is parallel to the direction of propagation
the maximum displacement from the equilibrium position of an object oscillating around the equilibrium position
power per unit area; sounds below 20 Hz
the perception of sound
a disturbance of matter that is transmitted from its source outward
number of events per unit of time
the perception of the frequency of a sound
the perception of sound intensity
a unitless quantity telling you the level of the sound relative to a fixed standard
an alteration in the observed frequency of a sound due to motion of either the source or the observer
the actual change in frequency due to relative motion of source and observer
