4.2 Causality
Learning Objectives
- Define and provide an example of idiographic and nomothetic causal explanations
- Describe the role of causality in quantitative research as compared to qualitative research
- Identify, define, and describe each of the main criteria for nomothetic causal explanations
- Describe the difference between and provide examples of independent, dependent, and control variables
- Define hypothesis, be able to state a clear hypothesis, and discuss the respective roles of quantitative and qualitative research when it comes to hypotheses
Most social scientific studies attempt to provide some kind of causal explanation. In other words, it is about cause and effect. A study on an intervention to prevent child abuse is trying to draw a connection between the intervention and changes in child abuse. Causality refers to the idea that one event, behavior, or belief will result in the occurrence of another, subsequent event, behavior, or belief. It seems simple, but you may be surprised to learn there is more than one way to explain how one thing causes another. How can that be? How could there be many ways to understand causality?

Think back to our chapter on paradigms, which were analytic lenses comprised of assumptions about the world. You’ll remember the positivist paradigm as the one that believes in objectivity and social constructionist paradigm as the one that believes in subjectivity. Both paradigms are correct, though incomplete, viewpoints on the social world and social science.
A researcher operating in the social constructionist paradigm would view truth as subjective. In causality, that means that in order to try to understand what caused what, we would need to report what people tell us. Well, that seems pretty straightforward, right? Well, what if two different people saw the same event from the exact same viewpoint and came up with two totally different explanations about what caused what? A social constructionist might say that both people are correct. There is not one singular truth that is true for everyone, but many truths created and shared by people.
When social constructionists engage in science, they are trying to establish one type of causality—idiographic causality. The word idiographic comes from the root word “idio” which means peculiar to one, personal, and distinct. An idiographic causal explanation means that you will attempt to explain or describe your phenomenon exhaustively, based on the subjective understandings of your participants. Idiographic causal explanations are intended to explain one particular context or phenomenon. These explanations are bound with the narratives people create about their lives and experience, and are embedded in a cultural, historical, and environmental context. Idiographic causal explanations are so powerful because they convey a deep understanding of a phenomenon and its context. From a social constructionist perspective, the truth is messy. Idiographic research involves finding patterns and themes in the causal themes established by your research participants.
If that doesn’t sound like what you normally think of as “science,” you’re not alone. Although the ideas behind idiographic research are quite old in philosophy, they were only applied to the sciences at the start of the last century. If we think of famous Western scientists like Newton or Darwin, they never saw truth as subjective. They operated with the understanding there were objectively true laws of science that were applicable in all situations. In their time, another paradigm–the positivist paradigm–was dominant and continues its dominance today. When positivists try to establish causality, they are like Newton and Darwin, trying to come up with a broad, sweeping explanation that is universally true for all people. This is the hallmark of a nomothetic causal explanation. The word nomothetic is derived from the root word “nomo” which means related to a law or legislative, and “thetic” which means something that establishes. Put the root words together and it means something that is establishing a law, or in our case, a universal explanation.
Nomothetic causal explanations are incredibly powerful. They allow scientists to make predictions about what will happen in the future, with a certain margin of error. Moreover, they allow scientists to generalize—that is, make claims about a large population based on a smaller sample of people or items. Generalizing is important. We clearly do not have time to ask everyone their opinion on a topic, nor do we have the ability to look at every interaction in the social world. We need a type of causal explanation that helps us predict and estimate truth in all situations.
If these still seem like obscure philosophy terms, let’s consider an example. Imagine you are working for a community-based non-profit agency serving people with disabilities. You are putting together a report to help lobby the state government for additional funding for community support programs, and you need to support your argument for additional funding at your agency. If you looked at nomothetic research, you might learn how previous studies have shown that, in general, community-based programs like yours are linked with better health and employment outcomes for people with disabilities. Nomothetic research seeks to explain that community-based programs are better for everyone with disabilities. If you looked at idiographic research, you would get stories and experiences of people in community-based programs. These individual stories are full of detail about the lived experience of being in a community-based program. Using idiographic research, you can understand what it’s like to be a person with a disability and then communicate that to the state government. For example, a person might say “I feel at home when I’m at this agency because they treat me like a family member” or “this is the agency that helped me get my first paycheck.”
Neither kind of causal explanation is better than the other. A decision to conduct idiographic research means that you will attempt to explain or describe your phenomenon exhaustively, attending to cultural context and subjective interpretations. A decision to conduct nomothetic research, on the other hand, means that you will try to explain what is true for everyone and predict what will be true in the future. In short, idiographic explanations have greater depth, and nomothetic explanations have greater breadth. More importantly, social workers understand the value of both approaches to understanding the social world. A social worker helping a client with substance abuse issues seeks idiographic knowledge when they ask about that client’s life story, investigate their unique physical environment, or probe how they understand their addiction. At the same time, a social worker also uses nomothetic knowledge to guide their interventions. Nomothetic research may help guide them to minimize risk factors and maximize protective factors or use an evidence-based therapy, relying on knowledge about what in general helps people with substance abuse issues.

Nomothetic causal explanations
If you are trying to generalize about causality, or create a nomothetic causal explanation, then the rest of these statements are likely to be true: you will use quantitative methods, reason deductively, and engage in explanatory research. How can we make that prediction? Let’s take it part by part.
Because nomothetic causal explanations try to generalize, they must be able to reduce phenomena to a universal language, mathematics. Mathematics allows us to precisely measure, in universal terms, phenomena in the social world. Because explanatory researchers want a clean “x causes y” explanation, they need to use the universal language of mathematics to achieve their goal. That’s why nomothetic causal explanations use quantitative methods. It’s helpful to note that not all quantitative studies are explanatory. For example, a descriptive study could reveal the number of people without homes in your county, though it won’t tell you why they are homeless. But nearly all explanatory studies are quantitative.
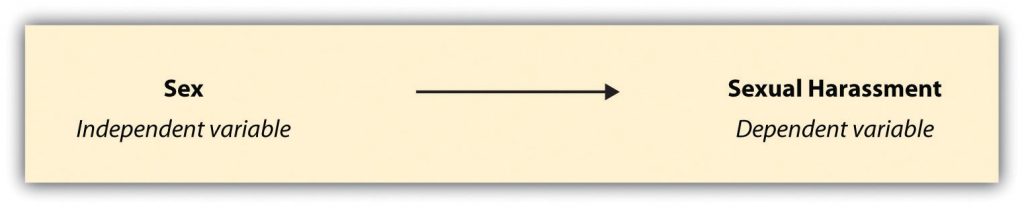
What we’ve been talking about here is an association between variables. When one variable precedes or predicts another, we have what researchers call independent and dependent variables. Two variables can be associated without having a causal relationship. However, when certain conditions are met (which we describe later in this chapter), the independent variable is considered as a “cause” of the dependent variable. For our example on spanking and aggressive behavior, spanking would be the independent variable and aggressive behavior addiction would be the dependent variable. In causal explanations, the independent variable is the cause, and the dependent variable is the effect. Dependent variables depend on independent variables. If all of that gets confusing, just remember this graphical depiction:

The strength of the association between the independent variable and dependent variable is another important factor to take into consideration when attempting to make causal claims when your research approach is nomothetic. In this context, strength refers to statistical significance. When the association between two variables is shown to be statistically significant, we can have greater confidence that the data from our sample reflect a true association between those variables in the target population. Statistical significance is usually represented in statistics as the p-value. Generally a p-value of .05 or less indicates the association between the two variables is statistically significant.
A hypothesis is a statement describing a researcher’s expectation regarding the research findings. Hypotheses in quantitative research are nomothetic causal explanations that the researcher expects to demonstrate. Hypotheses are written to describe the expected association between the independent and dependent variables. Your prediction should be taken from a theory or model of the social world. For example, you may hypothesize that treating clinical clients with warmth and positive regard is likely to help them achieve their therapeutic goals. That hypothesis would be using the humanistic theories of Carl Rogers. Using previous theories to generate hypotheses is an example of deductive research. If Rogers’ theory of unconditional positive regard is accurate, your hypothesis should be true.
Let’s consider a couple of examples. In research on sexual harassment (Uggen & Blackstone, 2004), one might hypothesize, based on feminist theories of sexual harassment, that more females than males will experience specific sexually harassing behaviors. What is the causal explanation being predicted here? Which is the independent and which is the dependent variable? In this case, we hypothesized that a person’s gender (independent variable) would predict their likelihood to experience sexual harassment (dependent variable).
Sometimes researchers will hypothesize that an association will take a specific direction. As a result, an increase or decrease in one area might be said to cause an increase or decrease in another. For example, you might choose to study the association between age and support for legalization of marijuana. Perhaps you’ve taken a sociology class and, based on the theories you’ve read, you hypothesize that age is negatively related to support for marijuana legalization. In fact, there are empirical data that support this hypothesis. Gallup has conducted research on this very question since the 1960s (Carroll, 2005). What have you just hypothesized? You have hypothesized that as people get older, the likelihood of their supporting marijuana legalization decreases. Thus, as age (your independent variable) moves in one direction (up), support for marijuana legalization (your dependent variable) moves in another direction (down). So, positive associations involve two variables going in the same direction and negative associations involve two variables going in opposite directions. If writing hypotheses feels tricky, it is sometimes helpful to draw them out and depict each of the two hypotheses we have just discussed.
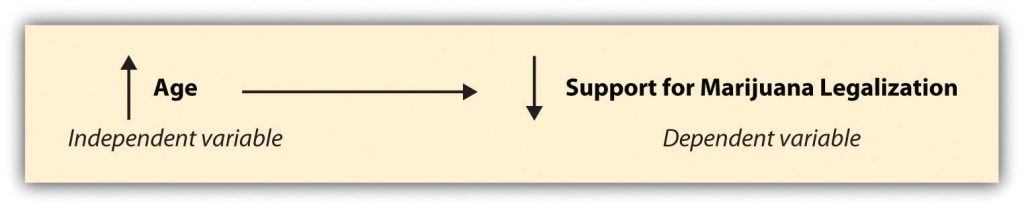
It’s important to note that once a study starts, it is unethical to change your hypothesis to match the data that you found. For example, what happens if you conduct a study to test the hypothesis from Figure 4.3 on support for marijuana legalization, but you find no association between age and support for legalization? It means that your hypothesis was wrong, but that’s still valuable information. It would challenge what the existing literature says on your topic, demonstrating that more research needs to be done to figure out the factors that impact support for marijuana legalization. Don’t be embarrassed by negative results, and definitely don’t change your hypothesis to make it appear correct all along!
Establishing causality in nomothetic research
Let’s say you conduct your study and you find evidence that supports your hypothesis, as age increases, support for marijuana legalization decreases. Success! Causal explanation complete, right? Not quite. You’ve only established one of the criteria for causality. The main criteria for causality have to do with covariation, plausibility, temporality, and spuriousness. In our example from Figure 4.3, we have established only one criteria—covariation. When variables covary, they vary together. Both age and support for marijuana legalization vary in our study. Our sample contains people of varying ages and varying levels of support for marijuana legalization and they vary together in a patterned way–when age increases, support for legalization decreases.
Just because there might be some correlation between two variables does not mean that a causal explanation between the two is really plausible. Plausibility means that in order to make the claim that one event, behavior, or belief causes another, the claim has to make sense. It makes sense that people from previous generations would have different attitudes towards marijuana than younger generations. People who grew up in the time of Reefer Madness or the hippies may hold different views than those raised in an era of legalized medicinal and recreational use of marijuana.
Once we’ve established that there is a plausible association between the two variables, we also need to establish that the cause happened before the effect, the criterion of temporality. A person’s age is a quality that appears long before any opinions on drug policy, so temporally the cause comes before the effect. It wouldn’t make any sense to say that support for marijuana legalization makes a person’s age increase. Even if you could predict someone’s age based on their support for marijuana legalization, you couldn’t say someone’s age was caused by their support for legalization.
Finally, scientists must establish nonspuriousness. A spurious association is one in which an association between two variables appears to be causal but can in fact be explained by some third variable. For example, we could point to the fact that older cohorts are less likely to have used marijuana. Maybe it is actually use of marijuana that leads people to be more open to legalization, not their age. This is often referred to as the third variable problem, where a seemingly true causal explanation is actually caused by a third variable not in the hypothesis. In this example, the association between age and support for legalization could be more about having tried marijuana than the age of the person.
Quantitative researchers are sensitive to the effects of potentially spurious associations. They are an important form of critique of scientific work. As a result, they will often measure these third variables in their study, so they can control for their effects. These are called control variables, and they refer to variables whose effects are controlled for mathematically in the data analysis process. Control variables can be a bit confusing, but think about it as an argument between you, the researcher, and a critic.
Researcher: “The older a person is, the less likely they are to support marijuana legalization.”
Critic: “Actually, it’s more about whether a person has used marijuana before. That is what truly determines whether someone supports marijuana legalization.”
Researcher: “Well, I measured previous marijuana use in my study and mathematically controlled for its effects in my analysis. The association between age and support for marijuana legalization is still statistically significant and is the most important association here.”
Let’s consider a few additional, real-world examples of spuriousness. Did you know, for example, that high rates of ice cream sales have been shown to cause drowning? Of course, that’s not really true, but there is a positive association between the two. In this case, the third variable that causes both high ice cream sales and increased deaths by drowning is time of year, as the summer season sees increases in both (Babbie, 2010). Here’s another good one: it is true that as the salaries of Presbyterian ministers in Massachusetts rise, so too does the price of rum in Havana, Cuba. Well, duh, you might be saying to yourself. Everyone knows how much ministers in Massachusetts love their rum, right? Not so fast. Both salaries and rum prices have increased, true, but so has the price of just about everything else (Huff & Geis, 1993).
Finally, research shows that the more firefighters present at a fire, the more damage is done at the scene. What this statement leaves out, of course, is that as the size of a fire increases so too does the amount of damage caused as does the number of firefighters called on to help (Frankfort-Nachmias & Leon-Guerrero, 2011). In each of these examples, it is the presence of a third variable that explains the apparent association between the two original variables.
In sum, the following criteria must be met for a correlation to be considered causal:
- The two variables must vary together.
- The association must be plausible.
- The cause must precede the effect in time.
- The association must be nonspurious (not due to a third variable).
Once these criteria are met, there is a nomothetic causal explanation, one that is objectively true. However, this is difficult for researchers to achieve. You will almost never hear researchers say that they have proven their hypotheses. A statement that bold implies that a association has been shown to exist with absolute certainty and that there is no chance that there are conditions under which the hypothesis would not be true. Instead, researchers tend to say that their hypotheses have been supported (or not). This more cautious way of discussing findings allows for the possibility that new evidence or new ways of examining an association will be discovered. Researchers may also discuss a null hypothesis. The null hypothesis is one that predicts no association between the variables being studied. If a researcher fails to accept the null hypothesis, she is saying that the variables in question are likely to be related to one another.
Idiographic causal explanations
If you not trying to generalize, but instead are trying to establish an idiographic causal explanation, then you are likely going to use qualitative methods, reason inductively, and engage in exploratory or descriptive research. We can understand these assumptions by walking through them, one by one.
Researchers seeking idiographic causal explanation are not trying to generalize, so they have no need to reduce phenomena to mathematics. In fact, using the language of mathematics to reduce the social world down is a bad thing, as it robs the causality of its meaning and context. Idiographic causal explanations are bound within people’s stories and interpretations. Usually, these are expressed through words. Not all qualitative studies analyze words, as some can use interpretations of visual or performance art, but the vast majority of social science studies do.

But wait, we predicted that an idiographic causal explanation would use descriptive or exploratory research. How can we build causality if we are just describing or exploring a topic? Wouldn’t we need to do explanatory research to build any kind of causal explanation? To clarify, explanatory research attempts to establish nomothetic causal explanations—an independent variable is demonstrated to cause changes a dependent variable. Exploratory and descriptive qualitative research are actually descriptions of the causal explanations established by the participants in your study. Instead of saying “x causes y,” your participants will describe their experiences with “x,” which they will tell you was caused by and influenced a variety of other factors, depending on time, environment, and subjective experience. As stated before, idiographic causal explanations are messy. The job of a social science researcher is to accurately identify patterns in what participants describe.
Let’s consider an example. What would you say if you were asked why you decided to become a social worker? If we interviewed many social workers about their decisions to become social workers, we might begin to notice patterns. We might find out that many social workers begin their careers based on a variety of factors, such as: personal experience with a disability or social injustice, positive experiences with social workers, or a desire to help others. No one factor is the “most important factor,” like with nomothetic causal explanations. Instead, a complex web of factors, contingent on context, emerge in the dataset when you interpret what people have said.
Finding patterns in data, as you’ll remember from Chapter 2, is what inductive reasoning is all about. A qualitative researcher collects data, usually words, and notices patterns. Those patterns inform the theories we use in social work. In many ways, the idiographic causal explanations created in qualitative research are like the social theories we reviewed in Chapter 2 and other theories you use in your practice and theory courses. Theories are explanations about how different concepts are associated with each other how that network of associations works in the real world. While you can think of theories like Systems Theory as Theory (with a capital “T”), inductive causality is like theory with a small “t.” It may apply only to the participants, environment, and moment in time in which the data were gathered. Nevertheless, it contributes important information to the body of knowledge on the topic studied.
Unlike nomothetic causal explanations, there are no formal criteria (e.g., covariation) for establishing causality in idiographic causal explanations. In fact, some criteria like temporality and nonspuriousness may be violated. For example, if an adolescent client says, “It’s hard for me to tell whether my depression began before my drinking, but both got worse when I was expelled from my first high school,” they are recognizing that oftentimes it’s not so simple that one thing causes another. Sometimes, there is a reciprocal association where one variable (depression) impacts another (alcohol abuse), which then feeds back into the first variable (depression) and also into other variables (school). Other criteria, such as covariation and plausibility still make sense, as the associations you highlight as part of your idiographic causal explanation should still be plausibly true and it elements should vary together.
Similarly, idiographic causal explanations differ in terms of hypotheses. If you recall from the last section, hypotheses in nomothetic causal explanations are testable predictions based on previous theory. In idiographic research, instead of predicting that “x will decrease y,” researchers will use previous literature to figure out what concepts might be important to participants and how they believe participants might respond during the study. Based on an analysis of the literature a researcher may formulate a few tentative hypotheses about what they expect to find in their qualitative study. Unlike nomothetic hypotheses, these are likely to change during the research process. As the researcher learns more from their participants, they might introduce new concepts that participants talk about. Because the participants are the experts in idiographic causal explanation, a researcher should be open to emerging topics and shift their research questions and hypotheses accordingly.
Complementary approaches to causality
Over time, as more qualitative studies are done and patterns emerge across different studies and locations, more sophisticated theories emerge that explain phenomena across multiple contexts. In this way, qualitative researchers use idiographic causal explanations for theory building or the creation of new theories based on inductive reasoning. Quantitative researchers, on the other hand, use nomothetic causal explanations for theory testing, wherein a hypothesis is created from existing theory (big T or small t) and tested mathematically (i.e., deductive reasoning). Once a theory is developed from qualitative data, a quantitative researcher can seek to test that theory. In this way, qualitatively-derived theory can inspire a hypothesis for a quantitative research project.
Two different baskets
Idiographic and nomothetic causal explanations form the “two baskets” of research design elements pictured in Figure 4.4 below. Later on, they will also determine the sampling approach, measures, and data analysis in your study.
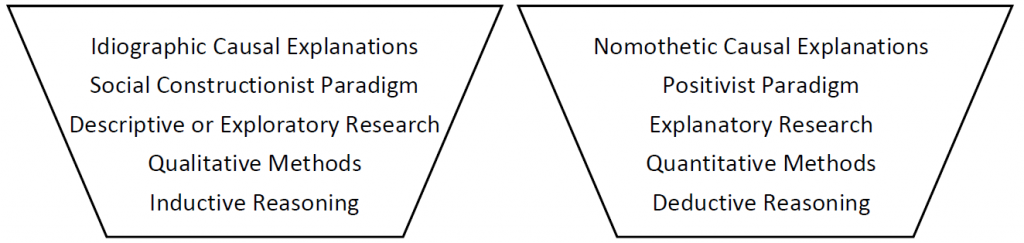
In most cases, mixing components from one basket with the other would not make sense. If you are using quantitative methods with an idiographic question, you wouldn’t get the deep understanding you need to answer an idiographic question. Knowing, for example, that someone scores 20/35 on a numerical index of depression symptoms does not tell you what depression means to that person. Similarly, qualitative methods are not often used to deductive reasoning because qualitative methods usually seek to understand a participant’s perspective, rather than test what existing theory says about a concept.
However, these are not hard-and-fast rules. There are plenty of qualitative studies that attempt to test a theory. There are fewer social constructionist studies with quantitative methods, though studies will sometimes include quantitative information about participants. Researchers in the critical paradigm can fit into either bucket, depending on their research question, as they focus on the liberation of people from oppressive internal (subjective) or external (objective) forces.
We will explore later on in this chapter how researchers can use both buckets simultaneously in mixed methods research. For now, it’s important that you understand the logic that connects the ideas in each bucket. Not only is this fundamental to how knowledge is created and tested in social work, it speaks to the very assumptions and foundations upon which all theories of the social world are built!
Key Takeaways
- Idiographic research focuses on subjectivity, context, and meaning.
- Nomothetic research focuses on objectivity, prediction, and generalizing.
- In qualitative studies, the goal is generally to understand the multitude of causes that account for the specific instance the researcher is investigating.
- In quantitative studies, the goal may be to understand the more general causes of some phenomenon rather than the idiosyncrasies of one particular instance.
- For nomothetic causal explanations, an association must be plausible and nonspurious, and the cause must precede the effect in time.
- In a nomothetic causal explanations, the independent variable causes changes in a dependent variable.
- Hypotheses are statements, drawn from theory, which describe a researcher’s expectation about an association between two or more variables.
- Qualitative research may create theories that can be tested quantitatively.
- The choice of idiographic or nomothetic causal explanation requires a consideration of methods, paradigm, and reasoning.
- Depending on whether you seek a nomothetic or idiographic causal explanation, you are likely to employ specific research design components.
Glossary
- Causality-the idea that one event, behavior, or belief will result in the occurrence of another, subsequent event, behavior, or belief
- Control variables- potential “third variables” effects are controlled for mathematically in the data analysis process to highlight the relationship between the independent and dependent variable
- Covariation- the degree to which two variables vary together
- Dependent variable- a variable that depends on changes in the independent variable
- Generalize- to make claims about a larger population based on an examination of a smaller sample
- Hypothesis- a statement describing a researcher’s expectation regarding what she anticipates finding
- Idiographic research- attempts to explain or describe your phenomenon exhaustively, based on the subjective understandings of your participants
- Independent variable- causes a change in the dependent variable
- Nomothetic research- provides a more general, sweeping explanation that is universally true for all people
- Plausibility- in order to make the claim that one event, behavior, or belief causes another, the claim has to make sense
- Spurious relationship- an association between two variables appears to be causal but can in fact be explained by some third variable
- Statistical significance- confidence researchers have in a mathematical relationship
- Temporality- whatever cause you identify must happen before the effect
- Theory building- the creation of new theories based on inductive reasoning
- Theory testing- when a hypothesis is created from existing theory and tested mathematically
Image attributions
Weather TV Forecast by mohamed_hassan CC-0
Figures 4.2 and 4.3 were copied from Blackstone, A. (2012) Principles of sociological inquiry: Qualitative and quantitative methods. Saylor Foundation. Retrieved from: https://saylordotorg.github.io/text_principles-of-sociological-inquiry-qualitative-and-quantitative-methods/ Shared under CC-BY-NC-SA 3.0 License
Beatrice Birra Storytelling at African Art Museum by Anthony Cross public domain
