Part 1. Putting Data Driven Research In Perspective
1.2 What is Big, Small, and Smart Data?
What is Big, Small, and Smart Data?
According to a March 2021 report authored by Jacquelyn Bulao, the rapid development of digitalization caused people to produce 59 zettabytes in 2020. Bulao notes that “Everyday, 306.4 billion emails are sent, 500 million Tweets are made, and 95 million photos and videos are shared every day on Instagram.” The proliferation and documentation of such immense bodies of materials is often described as “big data.”
Accordingly, the term “small data” emerged as a way of describing collections of data that although large was comparatively much smaller and more manageable than “big data.” Another term mentioned in relation to big data is “smart data,” which refers to usable or actionable data as opposed to massive unwieldy bodies of information with no clear purpose.
In this chapter, we will contextualize data analytic discourses, analyze examples of small data humanities projects, and consider the amount of labor that goes into analyzing data.
Keywords: Big Data, Small data, Smart Data,
Big and Smart Data
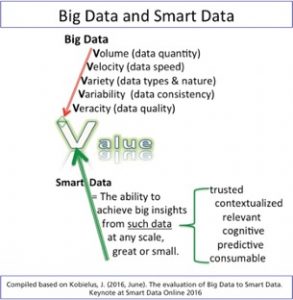
Big Data emphasizes three V’s: variety, volume, and velocity. That means, the datasets contain multiple sources and components (variety), the size is enormously large (volume), and the information is produced at high speeds (velocity).
Marcia Lei Zeng describes smart data as “the way in which different data sources (including Big Data) are brought together, correlated, analyzed, etc., to be able to feed decision-making and action processes.” Overall, “Smart Data is the ability to achieve big insights from trusted, contextualized, relevant, cognitive, predictive, and consumable data at any scale, great or small.”
One of the main challenges confronting academic disciplines engaged in data storytelling is simply access to smart or usable data collections. Large bodies of information that would be useful to humanists are not in digital formats or organized in databases. As a result, we are inclined to pursue the often arduous, time-consuming processes of building necessary datasets, or we rethink the kinds of sources that we rely on for research.
Small Data Humanities Projects
Small data projects, comprised of smart data, are commonplace in academic settings. These projects also serve as examples of how researchers might go about collecting and assembling their own resources. Gathering information and curating datasets is a crucial first step in creating data stories.
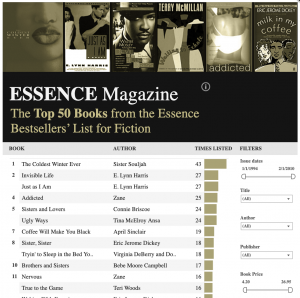
Jacinta Saffold, assistant English Professor at the University of New Orleans created The Essence Book Project. This computational database contains the hundreds of book titles from Essence magazine’s bestsellers’ list for fiction, which was published monthly from 1994-2010. This project is an intentionally data driven digital collection that catalogues and computationally conceptualizes the Black literary landscape at the turn of the twenty-first century. The one-page visualization of the project helps viewers to comprehend the sixteen-year history of the publication at a glance. The Essence Book Project also points to new approaches to engaging twentieth and twenty-first century popular African American Studies archival sources.
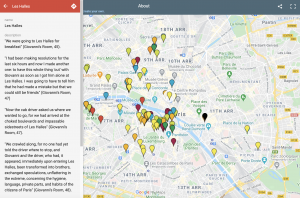
Similarly, Tyechia Lynn Thompson’s “Baldwin’s Paris” maps over 100 place markers related to the life and fiction of James Baldwin. The site pins the locations of buildings, monuments, restaurants, streets, and residences that appear in the later writer’s novels and essays, as well as personal recollections of travels. The various locations plotted on the map guide users and helped us better assess how Paris existed in the writer’s literary imagination. Even though the country of France is vast, users are able to pinpoint recurring locations and various neighborhoods that Baldwin referenced in his works. The map provides an avenue for us to compare Baldwin’s movements across the country with those of his fictional characters.
The projects drew on relatively smaller sets of information in order to produce a comprehensive overview of Essence magazine and the references of James Baldwin. Each researcher converted heritage materials, not necessarily digital born, thereby transforming resources into machine-readable sources able to be manipulated by visualization software and different types of tools.
Despite the lack of a central data repository to facilitate the various realms of study in African American literature, these projects by Saffold and Thompson are examples of how scholars produce data-rich projects about specific subject matters.
Visualizing Workloads
Small hardly means fast. Even though I categorize my own work as “small data” digital humanities, most of my projects take a considerable amount of time to complete. Assembling datasets on the careers of black writers and rappers requires gathering online information and transcribing non-digitized sources. There is often little discussion about the time it takes to produce digital projects because frequently the most captivating result overshadow the extensive process that made such outcomes possible.
Over the years, Peace Ossom-Williamson and I worked with research assistants to gather information, create datasets, and produce data visualizations. We knew the work was time-consuming, and we were curious what our workloads looked like. So along with graduate student, Kukhyoung Kim, we created another visualization to illustrate the time and labor that we put into a project about African American short story writers.
Infographic by Kukhyoung Kim (CC-BY)
The project took a total of 305 hours. Four people performed an assortment of tasks that contributed to its completion. Transcriptions from the anthologies accounted for approximately 210 hours or nearly 70% of the work. That means most of our time was spent preparing materials for analysis.
Given how long it can take prepare data for use, I strongly encourage people new to the field to work with preexisting datasets. Working with bodies of information that have already been curated makes it possible to jump right into processes of analysis and visualization.
Imagine the kinds of visualizations our team could produce if we had 300 hours with no need for dataset construction. Consider the data storytelling that would emerge if we could devote most of our time and energy to high quality outcomes and not only the preparation phase of the project.
Key Takeaways – What is Big, Small, and Smart Data?
- The term “big data” most often refers to the vast amount of information produced daily on social media sites, search engines, and other entities.
- Much of the data that would be most beneficial to academic research is not digitized.
- Small data humanities projects are common place.
- The acknowledgement of the type of labor used in creating data-driven projects in important
- Data driven research contains a range of processes that are not always readily apparent: collecting data from various sites, cleaning the information and organizing it in a data content system, interpreting the data, etc.
By Kenton Rambsy
(See bibliography for sources)
Media Attributions
Big data is a field that treats ways to analyze, systematically extract information from, or otherwise deal with data sets that are too large or complex to be dealt with by traditional data-processing application software.
Small data is data that is 'small' enough for human comprehension.[1] It is data in a volume and format that makes it accessible, informative and actionable.
Smart data is digital information that is formatted so it can be acted upon at the collection point before being sent to a downstream analytics platform for further data consolidation and analytics.
Data storytelling is the practice of building a narrative around a set of data and its accompanying visualizations to help convey the meaning of that data in a powerful and compelling fashion.
