Part 3. FLOAT Case Studies
3.2 Mapping Jay-Z’s Collaborators
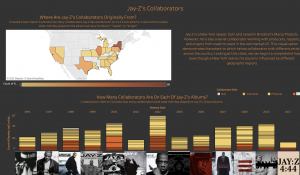
Mapping Jay-Z’s Collaborators
Project Rationale: This projects offers an overview of the various singers, rappers, and producers Jay-Z has worked with across the United States. Looking at this chart, we can begin to comprehend how even though a New York native, his sound is influenced by different geographic regions.
Data Story Description: The visualization illustrates the extent to which Jay-Z has collaborated with different artists across the country.
Formulate – A Research Question
Exploratory Question:
- How often has Jay-Z collaborated on his solo albums?
Explanatory Question (I revised my research questions during the analyzing process):
- Where are Jay-Z’s collaborators originally from?
- How many collaborators are on each of Jay-Z’s albums?
- o What type of role did they play on the album (Producer, Rapper, Singer, etc)?
Locate – A Data Source
For this project, I used The Jay-Z Collaborators Dataset. This pre-assembled dataset is published on the subverse of the Texas Data Repository. The “Black Studies Data Verse” has datasets related to an assortment of topics in Black literature and Black studies in general. The information is already cleaned and organized in a coherent manner.
You can access this information by going to this website here.
Organize – Your Data
This information already came organized. It has a data dictionary that explains the organization and components of the dataset. The dataset has 14 main categories: Release Date, Album Title, Song Title, Track #, Collaborator Name, Collaborator Role, Collaborator Gender, Collaborator Birth Year, Collaborator Birth Decade, Collaborator Origin City, Collaborator Origin State, Collaborator Birth Name, Producer, Number of Samples.
The structure of the dataset is defined in the accompanying data dictionary.
Analyze – Your Data
I used Microsoft Excel to create a pivot table to explore the dataset. I refined my questions after my analysis. I focused on the following columns in order to ask more targeted questions that focused on the specific variables in the dataset.
Explanatory questions:
- Where are Jay-Z’s collaborators originally from?
- How many collaborators are on each of Jay-Z’s albums?
What type of role did they play on the album (Producer, Rapper, Singer, etc)?
Tell— A Data Story
The video models each step. Follow along to re-create the visualization.
Pre-Step: Gathering the data and inserting it into Tableau
This is how we will gather the data from the internet and insert it into the Tableau software. This method of gathering data will work for any website you go to.
- Go to Texas Data Repository (or wherever your data is located)
- Search “Jay-Z Collaborators” and select the dataset created by Dr.Rambsy
- Download the option that is called comma separated values )
- Open tableau then drag and drop your dataset into the software
- Or you can go to Connect on the left bar and select the kind of file you have and upload your dataset that way
- After data is uploaded adjust categories
-
- Example: Collaborator Birth year (must be a string)
- Click the left corner and select string
- Release data should appear as a date- so go to the top left corner and select date in the drop down menu
- Collaborator birth decade should also be a string
- Ensure that collaborator origin state is a geographical location
- Track Number should be a string as well so go to the left corner and select string in the drop down menu
- This helps tableau interpret the data correctly so that it does not consider things like years a number that can be averaged
Step 1 – Create a Map (Where are Jay-Z’s collaborators originally from?)
I created a heat map to illustrate how many collaborators Jay-Z has worked with on his 13 solo albums. It also communicates what role they played on the album such as a “producer,” “rapper,” or “singer.”
- Drag “collaborator state” from the dimensions menu to the middle of the screen (where it says “drop screen”).
- Using the “show me” tab, click on “map” to change the view from points, to solid colors
- You can also use the “marks card” and select map from the drop down menu
- Drag the “collaborators count” from the measures menu and drop it on top of the map
- The map should transform to a heat map. The darker the color, the more collaborators from that particular state.
- Title the Map “Where Are Jay-Z’s collaborators originally from?” and center it
- Title the sheet map in the bottom tab
Step 2 – Create a bar chart (How many collaborators are on each of Jay-Z’s albums?)
I created a bar chart to illustrate how many collaborators (and what role they played) on Jay-Z’s 13 solo albums.
- Drag “Album Title” from the dimensions menu and place it in the columns bar.
- Drag “Number of collaborators” from the measures to the rows.
- The chart should now reflect a bar display a horizontal bar chart for each album.
- Drag “collaborator name” from the dimensions menu and drop the field on the bar chart.
- Drag “collaborator role” from the dimensions and drop it on color on the “marks card.”
- Click the color option on the marks card and add a black border to the bar chart. Now, viewers will be able to distinguish between each collaborator.
- Drag and drop the following categories onto the “Tool tip” option on the Marks card: Collaborator name, Album Title, Song Title, Album Release year
- You can re-arrange the order of the text on the tool tip to suit your liking.
- Put the albums in order by year by Dragging the “Release date” from the dimensions menu and place it above before the “Album title” on the columns header
- Right click the bottom album titles and deselect “Show Header” to remove the album titles at the bottom
- Title the Bar Chart “How Many Collaborators Are On Each of Jay-Z’s albums?” and center it
- Title the sheet bar chart in the bottom tab
Step 3 – Create Album Legend
I created a legend that has all of Jay-Z’s album covers. This legend will be used in the final worksheet to help users sift through information by selecting the cover of one of his albums instead of looking at text.
- Drop Album Titles into the field
- Drop album title into shapes on the marks card
- Go to “My Tableau Repository”
- Create a new folder and title it Jay-Z Album Covers
- Retrieve the album covers online
- If the shapes do not show up then select reload shapes
- Assign the correct album to each picture (this is a lot easier if you title each picture)
- Increase the size of your shapes by adjusting the shapes dial on the marks card
- Change the orientation of the shapes by selecting switch columns and rows on
- Put release date in front of album title in the columns bar to organize the albums by year
- Right click on the album title and deselect show header
- Right click on the year and deselect “show header”
- Title this “Albums” on the tab at the bottom
Step 4 – Create a dashboard
I created a dashboard and arranged all of the information on the sheet.
- Change your dimensions so that the visualization has enough room for all of your information
- On the left under dashboard change the size by utilizing the dial
- Arrange the sheets on the dashboard
- Change to the “floating” option to be able to navigate and arrange the items freely.
- Click the “use filter” option on each visualization to make the charts interact with one another when an option is selected
- Make sure you select filter for all of the charts
- Filter is especially powerful for the albums because it allows you to sort information by each album
Step 5 – Colors, Background, Aesthetics
In this step, I explain how I changed the format to make all of the charts have a consistent color scheme.
- Change all graphs to the same color palette and background
- Go to format and select shading for the background
- Go to the marks card and select color for the color palette
- Make the dashboard’s background match by going to format and selecting shading
- a) Go to Format
- b) Go to Rows and select grid lines and select None
- c) Go to Columns and select grid lines and select None
Step 6 – Cleaning up the Dashboard
- Make the albums chart more aesthetically appealing
- Go to Format and borders and make sure that your header and pane are both none
- o Do this for columns and rows
- Ensure that this has the same background as the other charts
- Go to Format and borders and make sure that your header and pane are both none
- Add text to each chart and the introduction paragraph
- Add the introduction paragraph by going under objects and selecting text
- Add text to each chart by double clicking the title and copy/paste your text in
- Keep the text color and size consistent
By Lindsey Dixon & Kenton Rambsy
