Part 1. Putting Data Driven Research In Perspective
1.3 Why is Structured Data Important?
Why Is Structured Data Important?
The terms “structured data” and “unstructured data” which refer to curated and unprocessed data, respectively, are useful to keep in mind as you work with and prepare spreadsheets. We are often charged with the task in research projects to take unstructured data and make it structured.
More than 80 percent of all data generated today is considered unstructured. When data is structured, it can be converted into different formats, joined with existing datasets, and transformed into data visualizations. Structured data is highly-organized and formatted in a way so it is easily searchable in relational databases. Data collection takes a lot of time. Therefore, drawing on already assembled and cleaned datasets can facilitate the research process. In addition, researchers can combine or add on to already existing datasets.
In this chapter, we will discuss the importance of structured data, understand how pre-assembled datasets can be manipulated, and explain how accessible datasets facilitate data driven research.
Keywords: Structured Data, Unstructured Data, Sustainability, Tidy Data README File, Data Dictionary
Tidy Data
Datasets are the bedrock of data driven research. Because data is produced everyday at an accelerated rate, archiving data is an important concept for researchers to consider. Consequently, Tidy data is an essential concept to consider for research in data analytics.
Hadley Wickham’s “Tidy Data” (2014) offers useful and straightforward principles for organizing data. Wickham defines “tidy data” as “a standardized way to link the structure of a dataset (its physical layout) with its semantics (its meaning).” According to Wickham, “Data preparation is not just a first step, but must be repeated over the course of analysis as new problems come to light or new data is collected.”
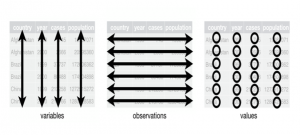
Even though Tidy data is a concept meant to help users organize data in R, the general concept also applies to how humanities and social science scholars collect data for our research. In tidy data (1) Each variable forms a column; (2) Each observation forms a row; (3) Each type of observational unit forms a table.
This concept applies to how we collect and organize information in spreadsheets. Many times, in the humanities and social sciences, we have to create our own datasets to fit our research needs. Creating more datasets related to academic subjects and making them publicly available can help spur interactions with data across disciplines. The organization and structure of data dictates how we can merge different types of files.
In order to transform our data into visualizations, we have to be mindful about data organization. Using the concept of Tidy Data, we can ensure that programs like ArcGIS or Tableau Public will be able to interpret our data properly.
Datasets and Sustainability
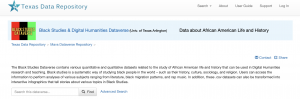
I have taught classes in digital humanities at the University of Texas at Arlington since the Fall of 2015. I have found that having ready made, archived, and accessible datasets to be especially valuable. I created the Black Studies and Digital Humanities Dataverse to store data used in my teaching and research.
Users can transform the collection of .csv files, related to the study of African American art and history into interactive infographics that tell stories about various topics in Black Studies. These structured documents are sustainable and able to be manipulated for several needs.
Each dataset comes with a metadata README file and codebook (data dictionary). A README file contains information about other files in a directory or archive of computer software. A data dictionary is a set of information describing the contents, format, and structure of a database and the relationship between its elements, used to control access to and manipulation of the database. These documents help others better understand your methods and, therefore, increase the chance that someone will be able to use the dataset.
The Black Studies and Digital Humanities Dataverse seeks to fill a notable void by making data about Black culture publicly available and sustainable.
So far, the dataverse contains datasets related to Jay-Z, Beyonce, short story writer Edward P. Jones, and a collection of contents across 100 anthologies. I use this information in my class so students can focus more on interpreting and visualizing the data instead of collecting it. After students get accustomed to working with the data and producing visualizations, they feel more empowered to curate datasets on their own. The datasets offer an entry point for data analysis.
Smart Data, Edward P. Jones, and Washington, DC Demographics
One semester, I taught a course focusing on the writer Edward P. Jones’s short story collections Lost in the City (1992) and All Aunt Hagar’s Children (2006). The two books contain a combined total of 28 stories, all of which concentrate on Washington D. C. My students and I charted what we read with the assistance of digital tools. Together, we published the edited collection Lost in the City: An Exploration of Edward P. Jones’s Short Fiction.
We produced a dataset that contained information related to 28 short stories and that contained more than 235,000 words and 500 characters. Our close reads and interactions with digital tools facilitated our ability to curate this dataset. We documented how often certain streets were mentioned and what quadrants most of Jones’s stories were set in, as well as what gender characters he presented most often and how frequently characters spoke.
The dataset we compiled also represents an instance of “smart data.” This information did not seek to comprehend the entirety of African American literature, but instead, focused solely on Jones’s short fiction. The spreadsheet enabled us to analyze the data by sorting through a large amount of story information. We later used this information to create a series of interactive visualizations about Jones’s collections.
Working with Data CAVE graduate research assistant, Kukhyoung Kim, I combined this dataset with public census records in order to create a map that overlaid real life populations changes in D.C. with the locations Jones’s referenced in his short fiction. We used ArcGIS to overlay a public dataset of DC’s demographics with the information I collected with my students.
This map can serve as a guide so readers can understand the historical dimensions of his stories. Since Jones’s stories are not set in present-day DC, his references to specific landmarks serve as indicators giving insight into the decade of each story. Jones’s stories act as a cultural reservoir of sorts by incorporating key locations from distinct periods in DC’s geographic history. Pairing this type of information with demographic data over decades helps us to consider the extent to which DC’s landscape has changed over time.
This ArcGIS map attests to the importance of structured data. Kukhyoung Kim combined historical census data and related shape files from the National Historical Geographic Information System (NHGIS) with the dataset I created with my students. The accessibility of the files was crucial. The files were open for the public to access. The files were in formats easy to manipulate by users with basic skillsets related to spreadsheets.
Structuring data in a systematic way becomes all the more important if we are to transform data into visualizations and perform complex analyses by putting significant thought into how we curate the information.
Key Takeaways – Working with Structured Data
- Spreadsheets allow for data to be saved in multiple formats ensuring its sustainability for long-term research purposes.
- Spreadsheet tools can be used to combine two separate datasets into one file
- Making data accessible for other researchers can be used to further analyze and reconfigure for new and alternative uses.
- Working with already assembled datasets allows for more time to be spent on data analysis and visualizations
By Kenton Rambsy
(See bibliography for sources)
Media Attributions
Structured data is data that adheres to a pre-defined data model and is therefore straightforward to analyse. Structured data conforms to a tabular format with relationship between the different rows and columns. Common examples of structured data are Excel files or SQL databases. Each of these have structured rows and columns that can be sorted.
Source: https://www.bigdataframework.org/data-types-structured-vs-unstructured-data/
Unstructured data is information that either does not have a predefined data model or is not organized in a pre-defined manner. Unstructured information is typically text-heavy, but may contain data such as dates, numbers, and facts as well. This results in irregularities and ambiguities that make it difficult to understand using traditional programs as compared to data stored in structured databases. Common examples of unstructured data include audio, video files or No-SQL databases.
Source: https://www.bigdataframework.org/data-types-structured-vs-unstructured-data/
Sustainability deals with development that meets the needs of the present without compromising the ability of future generations to meet their own needs.
Source: https://en.unesco.org/themes/education-sustainable-development/what-is-esd/sd#:~:text=Sustainable%20development%20is%20the%20overarching,to%20meet%20their%20own%20needs.%E2%80%9D
Tidy data is an alternative name for the common statistical form called a model matrix or data matrix
Source: https://en.wikipedia.org/wiki/Tidy_data
A README file contains information about other files in a directory or archive of computer software. A form of documentation, it is usually a simple plain text file called Read Me, READ.ME, README.TXT, README.md, README.1ST – or simply README. The file's name is generally written in uppercase letters.
A data dictionary is a collection of the names, definitions, and attributes for data elements and models. The data in a data dictionary is the metadata about the database. These elements are then used as part of a database, research project, or information system
