Part 3. FLOAT Case Studies
3.3 Animating Beyonce’s Award Nominations & Wins
Animating Beyonce’s Award Nominations & Wins
Project Rationale: As the most-awarded woman in the history of the Grammy Awards, it’s no wonder that Beyoncé has been nominated for over 600 awards since 2003, as a solo artist. This project explores what role does race and gender play in the Beyonce’s award history.
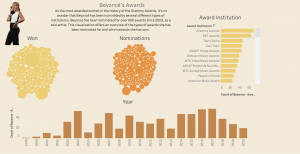
Data Story Description: This visualization offers an overview of Beyonce’s award nominations and wins from 1999 to 2020.

Formulate – A Research Question
Exploratory Question:
- How many awards has Beyonce won?
Explanatory Question (I revised my research questions during the fourth step in process, analyze):
- How many awards has Beyonce been nominated for?
- How many awards has Beyonce won?
- What award institutions nominated Beyonce for awards?
- Which years was Beyonce nominated for awards?
Locate – A Data Source
For this project, I used the “Storytelling with Data – The Beyonce Edition Dataset,” Beyonce-Awards. This pre-assembled dataset is published on the subverse of the Texas Data Repository. The “Black Studies Data Verse” has datasets related to an assortment of topics in Black literature and Black studies in general. The information is already cleaned and organized in a coherent manner.
You can access this information by going to this website here and searching for the specific dataset.
Organize – Your Data
This information already came organized. It has a data dictionary that explains the organization and components of the dataset. The dataset has 7 main categories: Song Title /Album Title, Year, Award Institution, Award Category, Award Type, International Award, and Result
The structure of the dataset is defined in the accompanying data dictionary.
Analyze – Your Data
For this project, I used Tableau Public to visually analyze the data. Specifically, I used bar charts and packed bubble charts to comprehend the timeline which Beyonce was nominated for and won awards. In addition, I used bubbles to visualize the types of awards.
Tell – A Data Story
Pre-Step: Gathering the Data
- Go to the Texas Data Repository
- Search “Storytelling with Data – The Beyonce Edition”
- Download the “Beyonce – Awards.csv” document. It is a comma separated values file
- Separated Values)
- Open tableau then drag and drop your dataset into the software
- Change the “year” to a string instead of a number.
Step 1 – Create a packed bubble (How many awards has Beyonce been nominated for?)
I created a packed bubble chart to visualize what type and how many awards Beyonce has been nominated for as a solo artist.
- I dragged “Award category” from the dimensions menu to the middle of the screen.
- I dragged “Beyonce- Awards – count” from the measure menu and placed it next to the award categories.
- I used the “show me” menu and selected the “packed bubble” chart to change the display.
- Go to the format menu, and select “animation”
- Go to the “duration” and select “0.50 seconds (medium).”
- Go to the “style” option and select “simultaneous.”
Step 2 – Create a packed bubble (How many awards has Beyonce won?)
I created a packed bubble chart to visualize the awards Beyonce has won as a solo artist.
- I dragged “Award category” from the dimensions menu to the middle of the screen.
- I dragged “Beyonce- Awards – count” from the measure menu and placed it next to the award categories.
- I dragged “Result” from the dimensions category and dropped it on “filters.”
- I checked the box “won.” This will display only those awards that she won.
- I used the “show me” menu and selected the “packed bubble” chart to change the display.
- Go to the format menu, and select “animation”
- Go to the “duration” and select “0.50 seconds (medium).”
- Go to the “style” option and select “simultaneous.”
Step 3 – Create a bar chart (What award institutions nominated Beyonce for awards?)
I created a bar chart to show which award institutions nominated Beyonce for an award.
- I dragged “Award institution” from the dimensions menu and dropped it in the middle of the screen
- I dragged “Beyonce- Awards – count” from the measure menu and placed it next to the award institution.
- I used the “show me” menu to select horizontal bars
- Go to the format menu, and select “animation”
- Go to the “duration” and select “0.50 seconds (medium).”
- Go to the “style” option and select “sequential.”
Step 4 – Create a bar chart (Which years was Beyonce nominated for awards?)
I created a bar chart to show which award institutions nominated Beyonce for an award.
- I dragged “Year” from the dimensions menu and dropped it in the middle of the screen
- I dragged “Beyonce- Awards – count” from the measure menu and placed it next to the award institution.
- I used the “show me” menu to select horizontal bars
- Go to the format menu, and select “animation”
- Go to the “duration” and select “0.50 seconds (medium).”
- Go to the “style” option and select “sequential.”
Step 5 – Create a dashboard and arrange the sheets
I created a dashboard and arranged all of the information on the sheet.
- Arrange the sheets on the dashboard
- Change to the “floating” option to be able to navigate and arrange the items freely.
- Click the “use filter” option on each visualization to make the charts interact with one another when an option is selected
- Change the color
- Add images
- Add text
- Remove unwanted titles and gridlines
By Lindsey Dixon & Kenton Rambsy

