10.4 Measurement quality: Reliability
Learning Objectives
Learners will be able to…
- Define and describe the types validity
- Define and describe the ways to estimate reliability
- Explain how sensitivity, specificity, and predictive value help describe the characteristics of a diagnostic measurement
In the previous three sections, we discussed the importance of identifying concepts and their corresponding indicators and operationalizing them. In essence, we now understand that when we think about measurement, we must be intentional and precise in the choices that we make, and base them in theory and previous empirical work. This section is all about how to judge the quality of the instruments you’re considering.
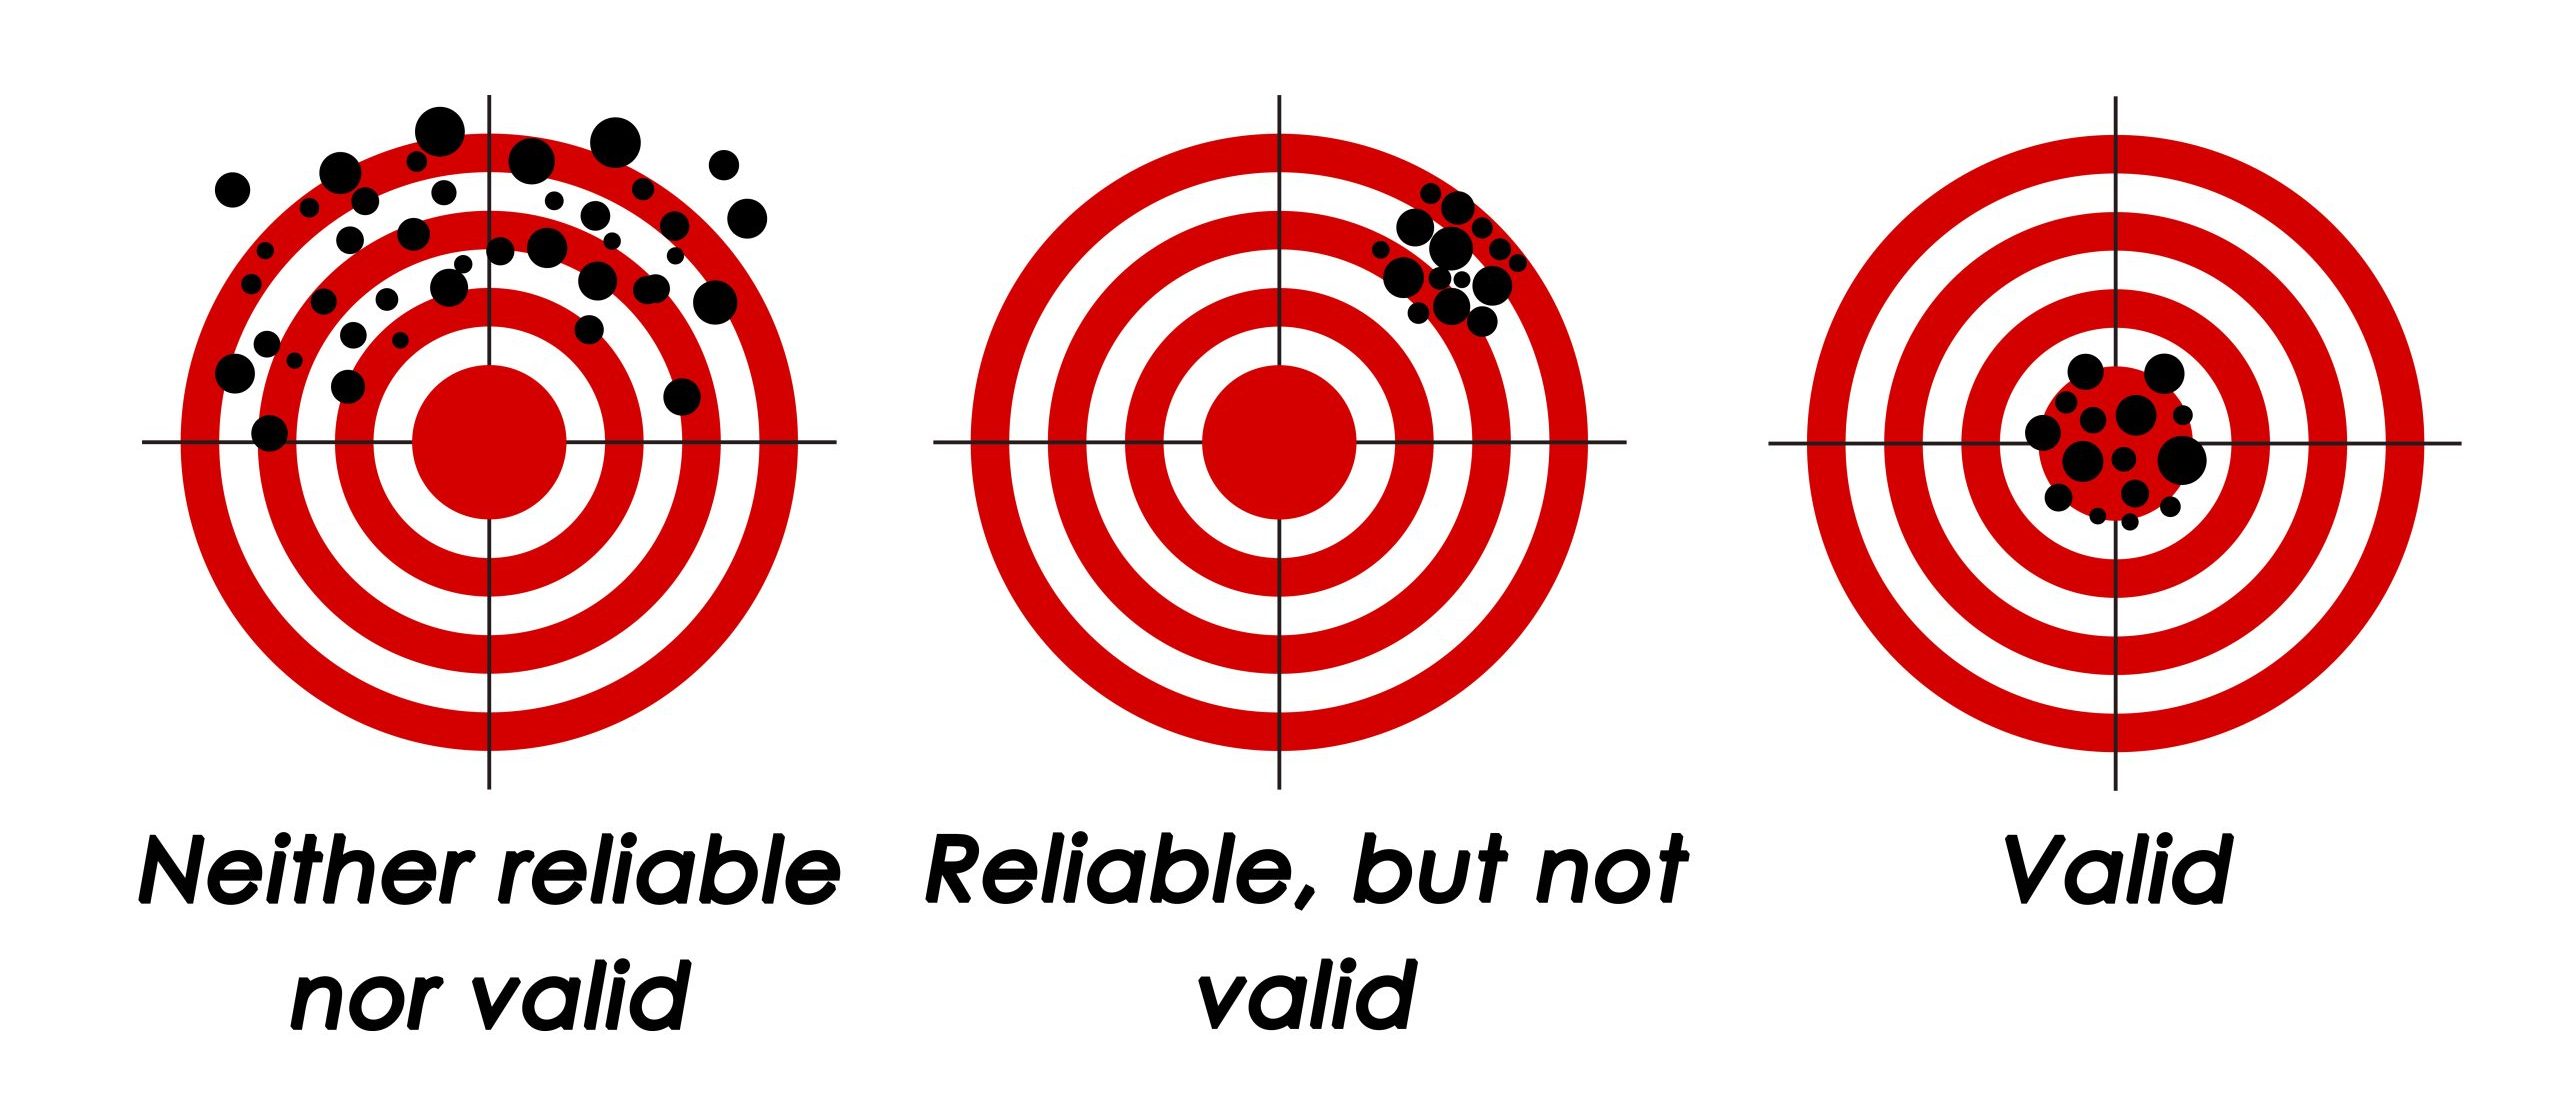
If you had a research methods course as an undergraduate or an MSW student, you may have learned that measures can be assessed by their validity and their reliability. A common basic distinction between these two qualities of a measure is that reliability has to do with a measure’s consistency, while validity has to do with its accuracy (i.e., the extent to which it measures what it is supposed to measure). It has been noted that a measure can be reliable without being valid, but cannot be valid unless it is reliable. Figure 10.2 shows a visual representation of this basic concept of validity and reliability. However, in this text, we will provide you with a more sophisticated understanding of reliability that aligns with the current scientific thought from measurement theory. In this more nuanced understanding of reliability, you will see that it can be difficult to separate discussions about reliability from validity.
Reliability
Reliability in measurement is about quantifying the degree to which our measure is imperfect. In your undergraduate or MSW programs, you may have learned that reliability is defined as “stability,” “equivalence,” or “consistency.” However, a formal definition of reliability comes out of classical test theory (Raykov & Marcoulides, 2011)[1], which recognizes the difference between the “true” value of a variable and the “observed” value. If X is the observed score on an instrument and T is the true score, then the difference between X and T is the error, which is denoted as E. So,
X = T + E.
The reliability index is then defined as the correlation between the true value, T, and the observed value, X (Raykov & Marcoulides, 2011). More often than the reliability index itself, the square of the reliability index is used, which is known as the reliability coefficient. A reliability index or coefficient can range from 0 to 1, where scores of 1 indicate the observed scores are equivalent to the true scores. An instrument with a large reliability index or coefficient is more reliable than one with a small reliability index or coefficient.
Stated another way, the reliability coefficient quantifies the proportion of observed variance that is due to true individual differences and can be calculated using this formula:
Reliability Coefficient = Var(T) / Var(X)
Unfortunately, neither the true score, T, nor error score, E, is ever directly observed. Consequently, the reliability coefficient is often computed via specialized techniques to identify the true score and error (e.g., using techniques based on confirmatory factor analysis, or CFA).
That being said, in the absence of modern software techniques that can identify the true score, other procedures that are easier to calculate have been used historically to estimate reliability. The applicability of these procedures depends in part on both context and convenience, as well as other factors, such as the level of measurement of the observed variables (i.e., nominal, ordinal, interval, ratio).
Let’s look at three different contexts in which some procedure for estimating reliability has been used: (1) traditional test procedures, (2) internal consistency, or the reliability of a composite, and (3) inter-rater reliability, where there are multiple raters scoring the same individual. Keep in mind that you may see other approaches to judging or estimating reliability mentioned in the empirical literature.
Traditional procedures for estimating reliability
Traditional procedures include alternate forms, test-retest, and test-retest with alternate forms, all of which are based on estimating a correlation coefficient. A typical context here is a sample of individuals being administered a test, or a series of tests. All of the following traditional procedures for estimating reliability have strengths and limitations and may yield different estimates of reliability.
Alternate forms
Alternate forms is based on using two forms of a test (e.g., form A and form B.) Both A and B are administered to the entire sample. However, half of the sample completes form A followed by form B, while the other half completes form B followed by form A. One then calculates the correlation between the scores on both forms. This gives the coefficient of “equivalence,” which is used as an estimate of the reliability of the test. Specifically, this coefficient reflects the degree to which the two forms are interchangeable in terms of content.
Test-retest method
When researchers measure a construct that they assume to be reliable, the scores they obtain should be repeatable across time assuming other factors don’t come into play (e.g., memory). For example, certain personality traits may be assumed to be consistent across time. This means that any good measure of such a trait should produce roughly the same scores for this individual next week as it does today. Clearly, a measure that produces highly inconsistent scores over time cannot be a very good measure of a construct that has not changed.
In the test-retest method of estimating reliability, the same test is administered to the same group of people twice with some elapsed time between the two assessments. The interest here is in the consistency of a recipient’s performance. The correlation of the two assessments is a coefficient of “stability,” and is used as an estimate of the reliability of the test.
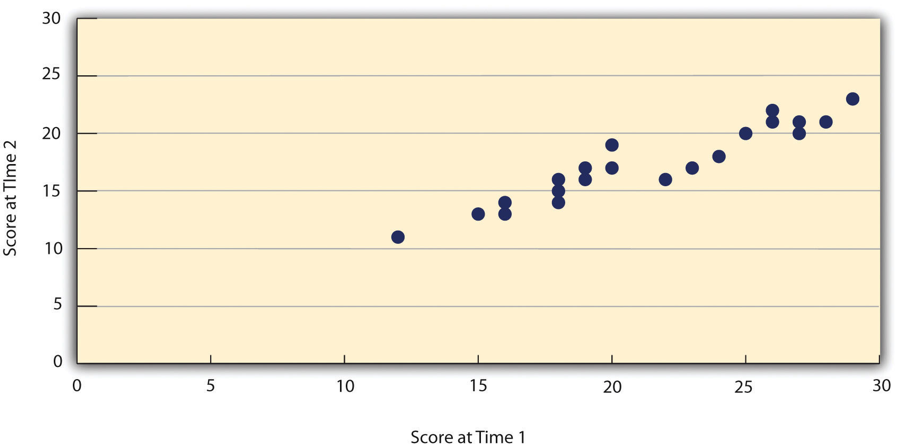
Figure 10.2 shows a scatterplot of two sets of scores of several university students on the Rosenberg Self-Esteem Scale, administered two times, a week apart. In this example, the correlation coefficient for these data is +.95, which is quite high. In general, a test-retest correlation of +.80 or greater has been considered an estimate of good reliability.[2]
Again, high test-retest correlations make sense when the construct being measured is assumed to be consistent over time, which is the case, for example, in the case of self-esteem or the Big Five personality dimensions. But other constructs cannot be assumed to be stable over time. The very nature of mood, for example, is that it changes. So a measure of mood that produced a low test-retest correlation over a period of a month would not be surprising. As such the test-retest method would not be a good way to estimate the reliability of the instrument.
Test-retest with alternate forms
The test-retest with alternate forms method combines the alternate forms and test-retest methods, in which form A and form B are administered at two different times, with one half of the sample receiving form A first and the other half receiving form B first. Then in the second administration, those who already took form A now take form B and vice versa. The correlation between the two forms is a coefficient of “stability and equivalence,” and is sometimes used as as an estimate of reliability.
Internal consistency
In behavioral and social research, we are often interested in sum scores (i.e., composites) from tests, scales, or questionnaires for example (Raykov & Marcoulides, 2011). A commonly used concept for estimating the reliability of a composite is that of internal consistency, which reflects the degree to which the items in the composite are interrelated. Statistically speaking, a composite with good internal consistency implies that the average inter-item covariance is high compared to the total variance of the composite.
A popular way of measuring internal consistency is coefficient alpha, which is also called Cronbach’s alpha. It can be readily computed for both continuous and binary data using a variety of popular statistical software packages. The formula for coefficient alpha is based on the covariances among the items in the scale and reflects the “average” covariance among the items.
Coefficient alpha is often used as a measure/proxy of reliability. However, only under certain conditions will it yield a reliability estimate corresponding to the classic definition of reliability (i.e., the reliability coefficient). One of these conditions is that error components of the scale’s items are uncorrelated. If this condition is not met, coefficient alpha can either under- or over-estimate reliability.
Another way to estimate internal consistency is the split-half method, which involves splitting a test with multiple items, or components, into “split-halves.” The split may be performed in a variety of ways, such as random assignment, but a successful split is one in which the two halves are as similar as possible in content. Each subject then receives two scores, one for each split half, and the correlation between the two is sometimes used as an estimate of the reliability of the test. The extent to which this constitutes a good estimate of reliability depends how well the split matches the content across the two halves.
An issue related to internal consistency is what is known as “unidimensionality.” Typically, when dealing with a composite, one wishes to know whether the items all pertain to the same underlying construct. For example, on the Rosenberg Self Esteem Scale, the items comprising the scale must each be indicators of one’s self-esteem. In contrast, the Multidimensional Empathy Scale[3] measures multiple dimensions of empathy including perspective-taking, empathic concern, and personal distress. Coefficient alpha or the split-half method are inappropriate estimates of reliability for the entirety of a multidimensional composite; rather they should be used only for a single dimension. Procedures other than alpha such as confirmatory factory analysis (CFA) are needed in order to test this unidimensionality hypothesis directly.
Interrater reliability
Interrater reliability pertains to a situation in which the observed scores for each individual come from multiple “raters,” such as home visitors who are assessing parental engagement in families they are observing (as in the Home Visit Rating Scales[4]). With interrater reliability, the interest is in the degree to which the variance of the observed scores is attributable to genuine differences in the true scores of the individuals being rated as opposed to differences in how multiple raters rate the same individual. The idea is that, for good interrater reliability, as much as possible of the variance in the observed scores should come from those genuine differences and as little as possible should be due to differences in how raters rate the same individual.
There are various methods to estimate interrater reliability. For continuous data, a common descriptive statistic is the intraclass correlation coefficient (ICC), which is available in popular statistical software. ICC has wider applicability beyond interrater reliability and is useful more generally for analyzing data that has some grouping structure. In the context of interrater reliability, the grouping structure relates to the set of ratings by different raters on the same individual. ICC can be viewed as the correlation of two ratings on the same individual. Its formulation bears a similarity to the formulation of the reliability coefficient, which we defined earlier in terms of the ratio of true variance to observed variance.
Key Takeaways
- Reliability is a matter of quantifying the degree to which our measure is imperfect
- Validity is a matter of how well an instrument measures what it is supposed to measure.
- While reliability can be identified with advanced statistical techniques, there are many simpler ways to estimate it.
- There are many types of validity which can provide evidence for the overall validity of an instrument.
- Diagnostic tools can be characterized by their sensitivity, specificity, and predictive power.
Exercises
TRACK 1 (IF YOU ARE CREATING A RESEARCH PROPOSAL FOR THIS CLASS):
Use the measurement tools you located in the previous exercise. Evaluate the reliability and validity of these tools. Hint: You will need to go into the literature to “research” these tools.
- Provide a clear statement regarding the reliability and validity of these tools. What strengths did you notice? What were the limitations?
- Think about your target population. Are there changes that need to be made in order for one of these tools to be appropriate for your population?
- If you decide to create your own tool, how will you assess its validity and reliability?
TRACK 2 (IF YOU AREN’T CREATING A RESEARCH PROPOSAL FOR THIS CLASS):
You are interested in studying older adults’ social-emotional well-being. Specifically, you would like to research the impact on levels of older adult loneliness of an intervention that pairs older adults living in assisted living communities with university student volunteers for a weekly conversation.
Use the measurement tool you located in the previous exercise. Evaluate the reliability and validity of these tools. Hint: You will need to go into the literature to “research” these tools.
- Provide a clear statement regarding the reliability and validity of these tools. What strengths did you notice? What were the limitations?
- Think about your target population. Are there changes that need to be made in order for one of these tools to be appropriate for your population?
- Raykov, T., & Marcoulides, G. (2011). Introduction to Psychometric Theory (1st ed.). Taylor and Francis. ↵
- Matheson G. J. (2019). We need to talk about reliability: making better use of test-retest studies for study design and interpretation. PeerJ, 7, e6918. https://doi.org/10.7717/peerj.6918 ↵
- Davis, M. H. (1980). A multidimensional approach to individual differences in empathy. JSAS Catalog of Selected Documents in Psychology, 10, 85. ↵
- Roggman, L. A., Cook, G. A., Innocenti, M. S., Jump Norman, V. K., Boyce, L. K., Olson, T. L., Christiansen, K., & Peterson, C. A. (2019). The Home Visit Rating Scale: Revised, restructured,. and revalidated. Infant Mental Health Journal, 40(3), 315-330. ↵
The degree to which an instrument reflects the true score rather than error. In statistical terms, reliability is the portion of observed variability in the sample that is accounted for by the true variability, not by error. Note: Reliability is necessary, but not sufficient, for measurement validity.
The extent to which scores obtained on a scale or other measure are consistent across time
The consistency of people’s responses across the items on a multiple-item measure. Responses about the same underlying construct should be correlated, though not perfectly.
Statistical measure used to asses the internal consistency of an instrument.
A reliability evaluation that examines the internal consistency of a a measurement tool. This process involves comparing one half of a tool to the other half of the same tool and evaluating the results.
The extent to which different observers are consistent in their assessment or rating of a particular characteristic or item.
a statistic ranging from 0 to 1 that measures how much outcomes (1) within a cluster are likely to be similar or (2) between different clusters are likely to be different
the group of people whom your study addresses