15.1 The basics of single-system research design
Learning Objectives
Learners will be able to…
- Identify why social workers might use single-subjects design.
- Describe the two stages of single-subjects design.
- Previously imported from Mauldin 2019
- WRITTEN BY TRMC
Single-systems research design, sometimes called single-subject or single-case research design, is distinct from other research methodologies in that, as its name indicates, only one person, group, policy, etc. (i.e., system) is being studied. Because clinical social work often involves one-on-one practice, single-subjects designs are often used by social workers to ensure that their interventions are having a positive effect. Single-subjects designs are used to demonstrate that social work intervention has its intended effects. Single-subjects designs are most compatible with clinical modalities such as cognitive-behavioral therapy which incorporate as part of treatment client self-monitoring, clinician data analysis, and quantitative measurement. It is routine in this therapeutic model to track, for example, the number of intrusive thoughts experienced between counseling sessions. Moreover, practitioners spend time each session reviewing changes in patterns during the therapeutic process, using it to evaluate and fine-tune the therapeutic approach. Although researchers have used single-subjects designs with less positivist therapies, such as narrative therapy, the single-subjects design is generally used in therapies with more quantifiable outcomes. The results of single-systems studies help ensure that social workers are not providing useless or counterproductive interventions to their clients.
By definition, single-systems design only attempts to explain causality in one case; therefore the results are not generalizable. Because their results are not generalizable, single-systems studies do not meet the strict definition of research , and are generally used in practice settings only. While the results will not be generalizable, they do provide important insight into the effectiveness of clinical interventions. Social work researchers teaching in BSW and MSW programs will teach single-systems design to their students, and on occasion may publish results of single systems research design to further knowledge about interventions.
The two main stages of single-systems research design
Single-systems designs follow the logic of experimental design by attempting to compare conditions when no intervention or treatment is applied to conditions when there is an intervention. To do this, SSRDs involve repeated measurements over time, usually in two stages and attempts to identify changes in a behavioral outcome (i.e., the dependent variable) s a result of an intervention, program, or treatment (i.e., the independent variable). The dependent variable is measured repeatedly during two distinct phases: the baseline stage and the treatment stage.
The baseline stage is the period of time before the intervention starts. During the baseline stage, the social worker is collecting data about the problem the treatment is hoping to address. For example, a person with substance use issues may binge drink on the weekends but cut down their drinking during the work week. A social worker might ask the client to record the number of drinks that they consume each day. By looking at this, we could evaluate the level of alcohol consumption. For other clients, the social worker might assess other indicators, such as the number of arguments the client had when they were drinking or whether or not the client blacked out as a result of drinking. Whatever measure is used to assess the targeted problem, that measure is the dependent variable in the single-subjects design.
The baseline stage should last until a pattern emerges in the dependent variable. This requires at least three different occasions of measurement, but it can often take longer. During the baseline stage, the social worker looks for one of three types of patterns (Engel & Schutt, 2016). The dependent variable may (1) be stable over time, (2) exhibit a trend where it is increasing or decreasing over time, or (3) have a cycle of increasing and decreasing that is repeated over time. Establishing a pattern can prove difficult in clients whose behaviors vary widely.
Ideally, social workers would start measurement for the baseline stage before starting the intervention. This provides the opportunity to determine the baseline pattern. Unfortunately, that may be impractical or unethical to do in practice if it entails withholding important treatment. In that case, a retrospective baseline can be attained by asking the client to recollect data from before the intervention started. The drawback to this is the information is likely to be less reliable than a baseline data recorded in real time. The baseline stage is important because with only one subject, there is no control group. Thus, we have to see if our intervention is effective by comparing the client before treatment to and during and after treatment. In this way, the baseline stage provides the same type of information as a control group — what it looks like when there is not treatment given.
The next stage is the treatment stage, and it refers to the time in which the treatment is administered by the social worker. Repeated measurements are taken during this stage to see if there is change in the dependent variable during treatment.
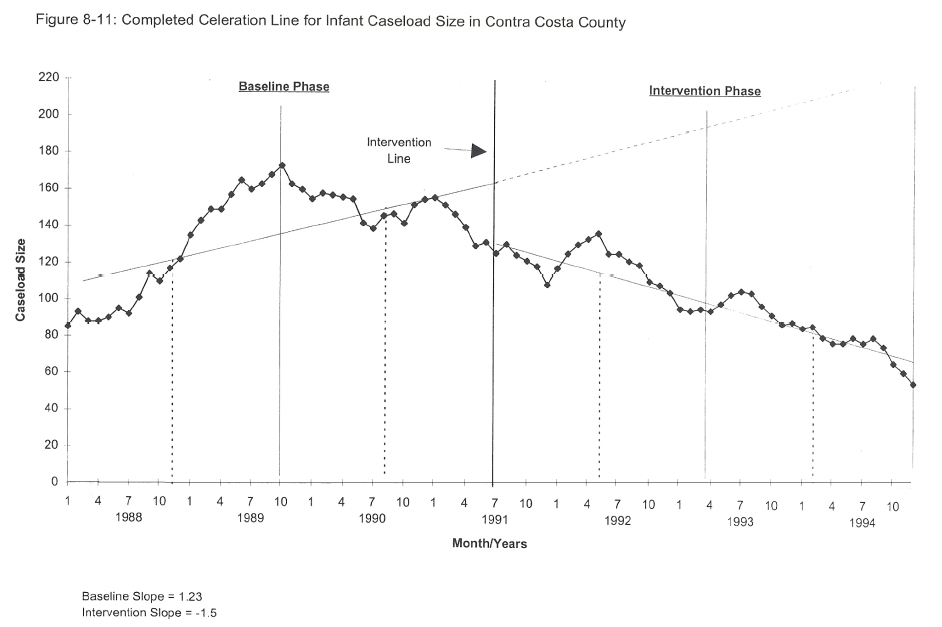
One way to analyze the data from a single-subjects design is to visually examine a graphical representation of the results. An example of a graph from a single-subjects design is shown in Figure 11.1. The x-axis is time, as measured in months. The y-axis is the measure of the problem we’re trying to change (i.e., the dependent variable).
In Figure 11.1, the y-axis is caseload size. From 1998 to July of 1991, there was no treatment. This is the baseline phase, and we can examine it for a pattern. There was an upward trend at the beginning of the baseline phase, but it looks as if the caseloads began to decrease around October 1989. The vertical line indicates when the intervention began (around July 1991). Once the intervention occurred, the downward trend continues. In this case, it is not clear if there was a change due to the intervention or if it was a continuation of a trend that began in October of 1989.
Key Takeaways
- Social workers conduct single-subjects research designs to make sure their interventions are effective.
- Single-subjects designs use repeated measures before and during treatment to assess the effectiveness of an intervention.
- Single-subjects designs often use a graphical representation of numerical data to look for patterns.
a systematic investigation, including development, testing, and. evaluation, designed to develop or contribute to generalizable knowledge
The stage in single-subjects design in which a baseline level or pattern of the dependent variable is established
The stage in single subjects research design in which the treatment or intervention is delivered