11.3 Probability sampling approaches
Learning Objectives
Learners will be able to…
- Define probability sampling
- Discuss the strengths and limitations of probability sampling
- Distinguish between various approaches to probability sampling and detail reasons to use each approach
Probability sampling is a sampling approach in which every element it in the sampling frame has a chance of being selected in the sample, and this chance can be accurately determined. The ability to accurately determine an element’s chance of being selected in the sample comes from having a physical sampling frame, where the elements (or settings where elements can be found) can be counted, and if desired, divided into subgroups. With probability sampling, sample statistics, such as sample mean or standard deviation, are unbiased estimates of population parameters, as long as the sample is large enough and the sampled units are weighted according to their probability of selection. The different types of probability sampling techniques include:” (1) simple random sampling, (2) systematic random sampling, (3) stratified random sampling, and (4) cluster sampling. These probability sampling approaches are summarized in Table 11.2.
| Sample type | Description |
| Simple random | Researcher randomly selects elements from sampling frame. |
| Systematic random | Researcher selects every kth element from sampling frame after selecting a random start. |
| Stratified random | Researcher creates subgroups then randomly selects elements from each subgroup. |
| Cluster | Researcher randomly selects clusters then randomly selects elements from selected clusters. |
Simple random sampling
What might be a better strategy is getting a list of all email addresses of social work students and randomly selecting email addresses of students to whom you can send your survey. This would be an example of simple random sampling. It’s important to note that you need a real list of people in your sampling frame from which to select your email addresses. However, it is likely that administrators at your school’s registrar would be reluctant to share the list of students’ names and email addresses. For projects where the people who could potentially participate is not known by the researcher, probability sampling is not possible. Always remember to consider the feasibility and ethical implications of the sampling approach you choose.
Usually, simple random sampling is accomplished by assigning each person, or element, in your sampling frame a number and selecting your participants using a random number generator. You would follow an identical process if you were sampling records or documents as your elements, rather than people. True randomness is difficult to achieve, and it takes complex computational calculations to do so. Although you think you can select things at random, human-generated randomness is actually quite predictable, as it falls into patterns called heuristics. To truly randomly select elements, researchers must rely on computer-generated help. Many free websites have good pseudo-random number generators. A good example is the website Random.org, which contains a random number generator that can also randomize lists of participants. Sometimes, researchers use a table of numbers that have been generated randomly. There are several possible sources for obtaining a random number table. Some statistics and research methods textbooks provide such tables in an appendix.
>>>this is from Bhattacherjee, Chapter 8, Sampling , p. 67<<<
“Simple random sampling. In this technique, all possible subsets of a population (more accurately, of a sampling frame) are given an equal probability of being selected. The probability of selecting any set of n units out of a total of N units in a sampling frame is NCn. Hence, sample statistics are unbiased estimates of population parameters, without any weighting. Simple random sampling involves randomly selecting respondents from a sampling frame, but with large sampling frames, usually a table of random numbers or a computerized random number generator is used. For instance, if you wish to select 200 firms to survey from a list of 1000 firms, if this list is entered into a spreadsheet like Excel, you can use Excel’s RAND() function to generate random numbers for each of the 1000 clients on that list. Next, you sort the list in increasing order of their corresponding random number, and select the first 200 clients on that sorted list. This is the simplest of all probability sampling techniques; however, the simplicity is also the strength of this technique. Because the sampling frame is not subdivided or partitioned, the sample is unbiased and the inferences are most generalizable amongst all probability sampling techniques.”
Systematic random sampling
Though simple, this approach to sampling can be tedious since the researcher must assign a number to each person in a sampling frame. Systematic random sampling techniques are somewhat less tedious but still offer the benefits of a random sample. As with simple random samples, you must possess a list of everyone in your sampling frame. The elements on the list will have an order from the first element to the last. Once you’ve done that, to draw a systematic random sample you only select one element randomly as a starting point . From that starting point, you then simply select every kth element on your list. But what is k, and where on the list of population elements does one begin the selection process?
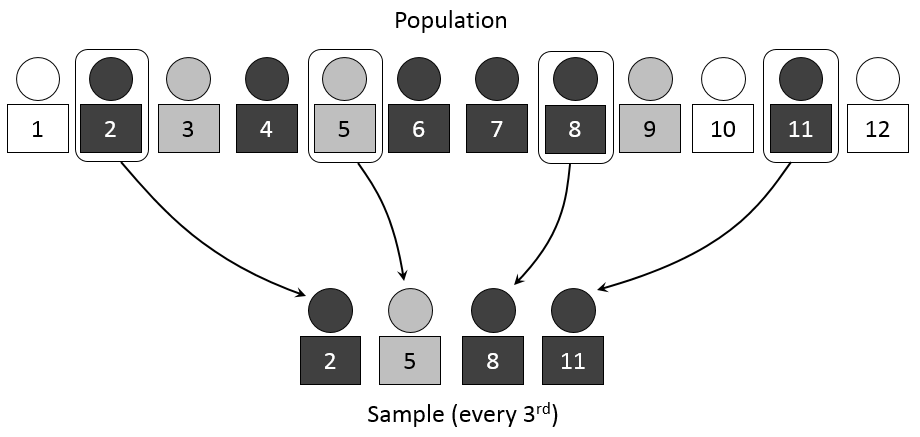
k is your sampling interval or the distance between the elements you select for inclusion in your study. To begin the selection process, you’ll need to figure out how many elements you wish to include in your sample. Let’s say you want to survey 25 social work students and there are 100 social work students on your campus. In this case, your sampling interval, or k, is 4. To get your sampling interval, simply divide the total number of population elements by your desired sample size (in this example, k = 100/25 = 4). An easy way to find the starting point in systematic random sampling is to randomly select a number between 1 and k (inclusive) to start from, and then recruiting every kth person. In our example, we may start at number 3 and then select the 7th, 11th, 15th (and so forth) person on our list of email addresses. In Figure 11.2, you can see the researcher starts at number 2 and then selects every third person for inclusion in the sample.
There is one clear instance in which systematic random sampling should not be employed. If your sampling frame has any pattern to it, you could inadvertently introduce bias into your sample by using a systemic sampling strategy. (Bias will be discussed in more depth in section 11.3.) This is sometimes referred to as the problem of periodicity. Periodicity refers to the tendency for a pattern to occur at regular intervals.
To stray a bit from our example, imagine we were sampling client charts based on the date they entered a health center and recording the reason for their visit. We may expect more admissions for issues related to alcohol consumption on the weekend than we would during the week. The periodicity of alcohol intoxication may bias our sample towards either overrepresenting or underrepresenting this issue, depending on our sampling interval and if the cases included were from a weekday or weekend.
>>>from Bhattacherjee, 2012, p. 68
“In this technique, the sampling frame is ordered according to some criteria and elements are selected at regular intervals through that ordered list. Systematic sampling involves a random start and then proceeds with the selection of every kth element from that point onwards, where k = N/n, where k is the ratio of sampling frame size N and the desired sample size n, and is formally called the sampling ratio. It is important that the starting point is not automatically the first in the list, but is instead randomly chosen from within the first k elements on the list. In our previous example of selecting 200 firms from a list of 1000 firms, you can sort the 1000 firms in increasing (or decreasing) order of their size (i.e., employee count or annual revenues), randomly select one of the first five firms on the sorted list, and then select every fifth firm on the list. This process will ensure that there is no overrepresentation of large or small firms in your sample, but rather that firms of all sizes are generally uniformly represented, as it is in your sampling frame. In other words, the sample is representative of the population, at least on the basis of the sorting criterion.”
Stratified random sampling
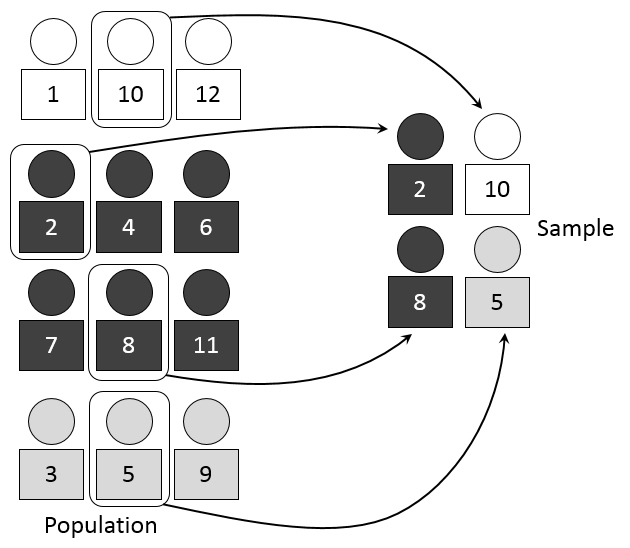
Returning again to our idea of sampling student email addresses, one of the challenges in our study will be the different types of students. If we are interested in all social work students, it may be helpful to divide our sampling frame, or list of students, into three lists—one for full-time undergraduate students, another for part-time undergraduate students, and one more for graduate students—and then randomly select from within these lists. This is particularly important if we wanted to make sure our sample had the same proportion of each type of student as in the student body.
This approach is the first step in stratified random sampling. In stratified random sampling, a researcher divides the study population into relevant subgroups or strata and then draws a random sample from each subgroup, or stratum. Strata is the plural of stratum, so it refers to all of the groups while stratum refers to each group. Stratified random sampling is generally used to recruit a sample that makes sure all types of elements of the population are included sufficiently enough for conclusions to be drawn about them.
Sometimes, the purpose is to create a sample that contains similar proportions of subgroups as the target population along whatever strata you’ve identified. Proportionate stratified random sampling….[ADD CONTENT]
In disproportionate (or non-proportionate) stratified random sampling, participants from specific subgroups a higher opportunity to be selected to increase this subgroup’s representation in the sample. For example, perhaps the social work program has relatively few Asian students but you want to include enough Asian students in the sample to detect statistically significant associations for the subgroup. You could use race to divide people into subgroups or strata and then disproportionately sample from the Asian students to make sure enough of them were in your sample to draw meaningful conclusions.
[THERE NEEDS TO BE A LOT MORE DETAIL IN THIS SECTION….X-REF RUBIN & BABBIE]
>>>this is from Bhattacherjee, Chapter 8, Sampling , p. 68-69<<<
In stratified sampling, the sampling frame is divided into homogeneous and non-overlapping subgroups (called “strata”), and a simple random sample is drawn within each subgroup. In the previous example of selecting 200 firms from a list of 1000 firms, you can start by categorizing the firms based on their size as large (more than 500 employees), medium (between 50 and 500 employees), and small (less than 50 employees). You can then randomly select 67 firms from each subgroup to make up your sample of 200 firms. However, since there are many more small firms in a sampling frame than large firms, having an equal number of small, medium, and large firms will make the sample less representative of the population (i.e., biased in favor of large firms that are fewer in number in the target population). This is called non-proportional stratified sampling because the proportion of sample within each subgroup does not reflect the proportions in the sampling frame (or the population of interest), and the smaller subgroup (large-sized firms) is over sampled. An alternative technique will be to select subgroup samples in proportion to their size in the population. For instance, if there are 100 large firms, 300 mid-sized firms, and 600 small firms, you can sample 20 firms from the “large” group, 60 from the “medium” group and 120 from the “small” group. In this case, the proportional distribution of firms in the population is retained in the sample, and hence this technique is called proportional stratified sampling. Note that the non-proportional approach is particularly effective in representing small subgroups, such as large-sized firms, and is not necessarily less representative of the population compared to the proportional approach, as long as the findings of the non-proportional approach is weighted in accordance to a subgroup’s proportion in the overall population.”
Cluster sampling
Up to this point in our discussion of probability sampling, we’ve assumed that researchers will be able to access a list of population elements in order to create a sampling frame. This, as you might imagine, is not always the case. Let’s say, for example, that you wish to conduct a study of health center usage across students at each social work program in your state. Just imagine trying to create a list of every single social work student in the state. Even if you could find a way to generate such a list, attempting to do so might not be the most practical use of your time or resources. When this is the case, researchers can turn to cluster sampling. Cluster sampling occurs when a researcher begins by randomly sampling groups (or clusters) of population elements and then selecting elements from within those groups.
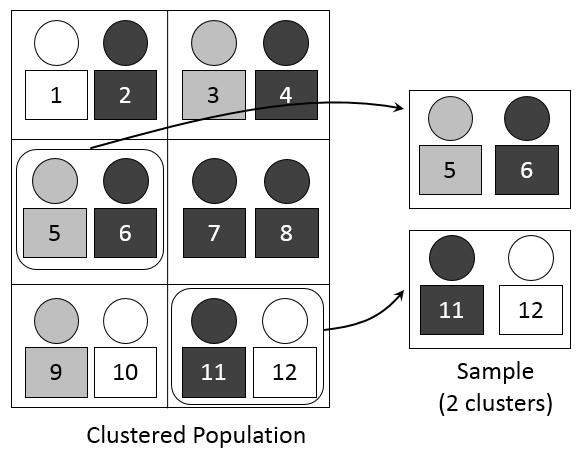
Let’s work through how we might use cluster sampling. While creating a list of all social work students in your state would be next to impossible, you could easily create a list of all social work programs in your state. Then, you could draw a random sample of social work programs (your cluster) and then draw another random sample of elements (in this case, social work students) from each of the programs you randomly selected from the list of all programs.
Cluster sampling often works in stages. In this example, we sampled in two stages—(1) social work programs and (2) social work students at each program we selected. However, we could add another stage if it made sense to do so. We could randomly select (1) states in the United States (2) social work programs in that state and (3) individual social work students. As you might have guessed, sampling in multiple stages does introduce a greater possibility of error. Each stage is subject to its own sampling problems. Despite this drawback, cluster sampling is nevertheless a highly efficient method.
>>from Bhattacherjee Chap 8, p. 69:
“If you have a population dispersed over a wide geographic region, it may not be feasible to conduct a simple random sampling of the entire population. In such case, it may be reasonable to divide the population into “clusters” (usually along geographic boundaries), randomly sample a few clusters, and measure all units within that cluster. For instance, if you wish to sample city governments in the state of New York, rather than travel all over the state to interview key city officials (as you may have to do with a simple random sample), you can cluster these governments based on their counties, randomly select a set of three counties, and then interview officials from every official in those counties. However, depending on between-cluster differences, the variability of sample estimates in a cluster sample will generally be higher than that of a simple random sample, and hence the results are less generalizable to the population than those obtained from simple random samples. “
Jessica Holt and Wayne Gillespie (2008)[1] used cluster sampling in their study of students’ experiences with violence in intimate relationships. Specifically, the researchers randomly selected 14 classes on their campus and then drew a random sub-sample of students from those classes. But you probably know from your experience with college classes that not all classes are the same size. So, if Holt and Gillespie had simply randomly selected 14 classes and then selected the same number of students from each class to complete their survey, then students in the smaller of those classes would have had a greater chance of being selected for the study than students in the larger classes. When clusters are of different sizes, as in the example of sampling college classes, researchers often use a method called probability proportionate to size sampling (PPS). This means that they take into account that their clusters are of different sizes. They do this by giving clusters different chances of being selected based on their size so that each element across all clusters has an equal chance of being selected.
Before continuing to Considerations for Selecting a Probability Sampling Strategy below, you may want to use the interactive drag and drop exercise below to review your the types of probability sampling.
Considerations for selecting a probability sampling strategy
To summarize, probability sampling increases the generalizability of the results from a sample to the population. Probability samples require a sampling frame from which elements, usually human beings, can be selected at random from a list. The use of random selection reduces the error and bias (which we will discuss in greater detail in section 11.4), though some error will always remain. In relying on a random selection, researchers can more accurately state that their sample represents the population from which it was drawn.
In determining which probability sampling approach makes the most sense for your project, it helps to know more about your population. Simple random sampling and systematic random sampling are relatively similar to carry out. They both require a physical list of all elements in your sampling frame. Systematic random sampling is slightly easier in that it does not require you to use a random number generator, instead using a sampling interval that is easy to calculate by hand.
However, the relative simplicity of both approaches is offset by their lack of sensitivity to characteristics of your population. Stratified random sampling can better account for periodicity by creating strata that reduce or eliminate its effects. Stratified random sampling also ensures that smaller subgroups are adequately represented in your sample, thereby making your sample more representative of the overall population. While these benefits are important, creating strata for this purpose requires having information about your population before beginning the sampling process.
Common to each of the previous probability sampling approaches is the necessity of using a real list of all elements in your sampling frame. Cluster sampling is different. It allows a researcher to perform probability sampling in cases for which a list of elements for the entire population is not available or feasible to create (but a list of clusters is available). Cluster sampling is also useful for making claims about a larger population (in our previous example, all social work students within a state). However, because sampling occurs at multiple stages in the process, (in our previous example, at the university and student level), sampling error increases. For many researchers, the benefits of cluster sampling outweigh this weaknesses.
In this and the previous section, we discussed non-probability and probability sampling strategies. In the next section, we will introduce sample quality.
Test your memory of which types of sampling are probability and non-probability with this drag and drop activity:
Exercises
TRACK 1 (IF YOU ARE CREATING A RESEARCH PROPOSAL FOR THIS CLASS):
- Before you start sampling, do you know enough about your sampling frame to use stratified random sampling, which increases the potential of getting a representative sample?
- Do you have enough information about your sampling frame to use another probability sampling approach like simple random sampling or cluster sampling?
- If little information is available on which to select people, are you using availability sampling? Remember that availability sampling is okay if it is the only approach that is feasible for the researcher, but it comes with significant limitations when drawing conclusions about a larger population.
TRACK 2 (IF YOU AREN’T CREATING A RESEARCH PROPOSAL FOR THIS CLASS):
Imagine you are studying the disproportionate rates of abuse and sexual assault for people with intellectual and developmental disabilities. You are interested in learning more about abuse prevention strategies, such as healthy relationship education, for this population.
- Before you start sampling, do you know enough about your sampling frame to use stratified random sampling, which increases the potential of getting a representative sample?
- Do you have enough information about your sampling frame to use another probability sampling approach like simple random sampling or cluster sampling?
- If little information is available on which to select people, are you using availability sampling? Remember that availability sampling is okay if it is the only approach that is feasible for the researcher, but it comes with significant limitations when drawing conclusions about a larger population.
Key Takeaways
-
- Probability sampling approaches are more accurate when the researcher wants to generalize from a smaller sample to a larger population. However, non-probability sampling approaches are often more feasible. You will have to weigh advantages and disadvantages of each when designing your project.
- There are many four types of probability sampling approaches. Each requires you know some information about people who potentially would participate in your study.
- Probability sampling also requires that you assign people within the sampling frame a number and select using a truly random process
- Holt, J. L., & Gillespie, W. (2008). Intergenerational transmission of violence, threatened egoism, and reciprocity: A test of multiple psychosocial factors affecting intimate partner violence. American Journal of Criminal Justice, 33, 252–266. ↵
sampling approaches for which a person’s likelihood of being selected from the sampling frame is known
selecting elements from a list using randomly generated numbers
individual units of a population
a probability sampling approach that begins by selecting a random start on a sampling frame and then selects every kth element from your sampling frame for the sample
used in systematic random sampling; the distance between the elements in the sampling frame selected for the sample; determined by dividing the total sampling frame by the desired sample size
the tendency for a pattern to occur at regular intervals
dividing the study population into subgroups based on a characteristic (or strata) and then drawing a sample from each subgroup
the characteristic by which the sample is divided in stratified random sampling
a sampling approach that begins by sampling groups (or clusters) of population elements and then selects elements from within those groups
a type of cluster sampling, in which clusters are given different chances of being selected based on their size so that each element across all of the clusters has an equal chance of being selected