15.4 Data analysis in single-systems research design
Learning Objectives
Learners will be able to…
Source :
- https://kpu.pressbooks.pub/psychmethods4e/chapter/single-subject-research-designs/ (Section: Reversal Designs) NOTE: THIS HAS FIGURES WE MIGHT WANT TO USE
In addition to its focus on individual participants, single-subject research differs from group research in the way the data are typically analyzed. As we have seen throughout the book, group research involves combining data across participants. Group data are described using statistics such as means, standard deviations, correlation coefficients, and so on to detect general patterns. Finally, inferential statistics are used to help decide whether the result for the sample is likely to generalize to the population. Single-subject research, by contrast, relies heavily on a very different approach called
. This means plotting individual participants’ data as shown throughout this chapter, looking carefully at those data, and making judgments about whether and to what extent the independent variable had an effect on the dependent variable. Inferential statistics are typically not used.
In visually inspecting their data, single-subject researchers take several factors into account. One of them is changes in the level of the dependent variable from condition to condition. If the dependent variable is much higher or much lower in one condition than another, this suggests that the treatment had an effect. A second factor is trend, which refers to gradual increases or decreases in the dependent variable across observations. If the dependent variable begins increasing or decreasing with a change in conditions, then again this suggests that the treatment had an effect. It can be especially telling when a trend changes directions—for example, when an unwanted behavior is increasing during baseline but then begins to decrease with the introduction of the treatment. A third factor is latency, which is the time it takes for the dependent variable to begin changing after a change in conditions. In general, if a change in the dependent variable begins shortly after a change in conditions, this suggests that the treatment was responsible.
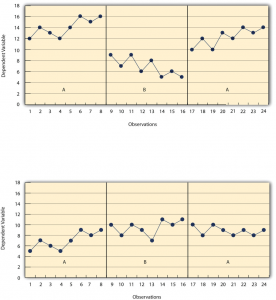
In the top panel of Figure 10.4, there are fairly obvious changes in the level and trend of the dependent variable from condition to condition. Furthermore, the latencies of these changes are short; the change happens immediately. This pattern of results strongly suggests that the treatment was responsible for the changes in the dependent variable. In the bottom panel of Figure 10.4, however, the changes in level are fairly small. And although there appears to be an increasing trend in the treatment condition, it looks as though it might be a continuation of a trend that had already begun during baseline. This pattern of results strongly suggests that the treatment was not responsible for any changes in the dependent variable—at least not to the extent that single-subject researchers typically hope to see.
The results of single-subject research can also be analyzed using statistical procedures—and this is becoming more common. There are many different approaches, and single-subject researchers continue to debate which are the most useful. One approach parallels what is typically done in group research. The mean and standard deviation of each participant’s responses under each condition are computed and compared, and inferential statistical tests such as the t test or analysis of variance are applied (Fisch, 2001)[3]. (Note that averaging across participants is less common.) Another approach is to compute the
(PND) for each participant (Scruggs & Mastropieri, 2001)[4]. This is the percentage of responses in the treatment condition that are more extreme than the most extreme response in a relevant control condition. In the study of Hall and his colleagues, for example, all measures of Robbie’s study time in the first treatment condition were greater than the highest measure in the first baseline, for a PND of 100%. The greater the percentage of non-overlapping data, the stronger the treatment effect. Still, formal statistical approaches to data analysis in single-subject research are generally considered a supplement to visual inspection, not a replacement for it.
Image Description
Figure 10.2 long description: Line graph showing the results of a study with an ABAB reversal design. The dependent variable was low during first baseline phase; increased during the first treatment; decreased during the second baseline, but was still higher than during the first baseline; and was highest during the second treatment phase. [Return to Figure 10.2]
Figure 10.3 long description: Three line graphs showing the results of a generic multiple-baseline study, in which different baselines are established and treatment is introduced to participants at different times.
For Baseline 1, treatment is introduced one-quarter of the way into the study. The dependent variable ranges between 12 and 16 units during the baseline, but drops down to 10 units with treatment and mostly decreases until the end of the study, ranging between 4 and 10 units.
For Baseline 2, treatment is introduced halfway through the study. The dependent variable ranges between 10 and 15 units during the baseline, then has a sharp decrease to 7 units when treatment is introduced. However, the dependent variable increases to 12 units soon after the drop and ranges between 8 and 10 units until the end of the study.
For Baseline 3, treatment is introduced three-quarters of the way into the study. The dependent variable ranges between 12 and 16 units for the most part during the baseline, with one drop down to 10 units. When treatment is introduced, the dependent variable drops down to 10 units and then ranges between 8 and 9 units until the end of the study. [Return to Figure 10.3]
Figure 10.4 long description: Two graphs showing the results of a generic single-subject study with an ABA design. In the first graph, under condition A, level is high and the trend is increasing. Under condition B, level is much lower than under condition A and the trend is decreasing. Under condition A again, level is about as high as the first time and the trend is increasing. For each change, latency is short, suggesting that the treatment is the reason for the change.
In the second graph, under condition A, level is relatively low and the trend is increasing. Under condition B, level is a little higher than during condition A and the trend is increasing slightly. Under condition A again, level is a little lower than during condition B and the trend is decreasing slightly. It is difficult to determine the latency of these changes, since each change is rather minute, which suggests that the treatment is ineffective. [Return to Figure 10.4]