2.3 Data management and analysis
Learning Objectives
Learners will be able to…
- Define and construct a data analysis plan
- Define key quantitative data management terms—variable name, data dictionary, and observations/cases
- Differentiate between univariate and bivariate quantitative analysis
- Explain when we might use quantitative bivariate analysis in social work research
- Identify how your qualitative research question, research aim, and type of data may influence your choice of analytic methods
- Outline the steps you will take in preparation for conducting qualitative data analysis
After you have your raw data, whether secondary data or data you collected yourself, you will need to analyze it. While the specific steps to follow in quantitative or qualitative data analysis are beyond the scope of this chapter, we are going to address some basic concepts in this section to help you create a data analysis plan. A data analysis plan is an ordered outline that includes your research question, a description of the data you are going to use to answer it, and the exact step-by-step analyses that you plan to run to answer your research question. If you look back at Table 2.1, you will see that creating a data analysis plan is a part of the study design process. The data analysis plan flows from the research question, is integral to the study design, and should be well conceptualized prior to beginning data collection. In this section, we will walk through the basics of quantitative and qualitative data analysis to help you understand the fundamentals of creating a data analysis plan.
When considering what primary data you might want to collect as part of your project, there are two important considerations. You might only get one chance to interact with your participants, so you must think comprehensively in your planning phase about what information you need and collect as much relevant data as possible. At the same time, though, especially when collecting sensitive information, you need to consider how onerous the data collection is for participants and whether you really need them to share that information. Just because something is interesting to us doesn’t mean it’s related enough to our research question to chase it down. Work with your research team early in your project to talk through these issues before you get to this point. And if you’re using secondary data, make sure you have access to all the information you need in that data before you use it.
Quantitative Data: Management
Once you’ve collected your quantitative data, you need to make sure it is well-organized in a database in a way that’s actually usable. “Database” can be kind of a scary word, but really, it can be as simple as an Excel spreadsheet or a data file in whatever program you’re using to analyze your data. You may want to avoid Excel and use a formal database such as Microsoft Access or MySQL if you’ve got a large or complicated data set. But if your data set is smaller and you plan to keep your analyses simple, you can definitely get away with Excel. A typical data set is organized with variables as columns and observations/cases as rows. For example, let’s say we did a survey on ice cream preferences and collected the following information in Table 2.3:
| Name | Age | Gender | Hometown | Fav_Ice_Cream |
| Tom | 54 | 0 | 1 | Rocky Road |
| Jorge | 18 | 2 | 0 | French Vanilla |
| Melissa | 22 | 1 | 0 | Espresso |
| Amy | 27 | 1 | 0 | Black Cherry |
There are a few key data management terms to understand:
-
-
- Variable name: Just what it sounds like—the name of your variable. Make sure this is something useful and short and, if you’re using something other than Excel, all one word. Most statistical programs will automatically rename variables for you if they aren’t one word, but the names can be a little ridiculous and long.
- Observations/cases: The rows in your data set. In social work, these are often your study participants (people), but can be anything from census tracts to black bears to trains. When we talk about sample size, we’re talking about the number of observations/cases. In our mini data set, each person is an observation/case.
- Data dictionary (also called a code book or metadata): This is the document where you list your variable names, what the variables actually measure or represent, what each of the values of the variable mean if the meaning isn’t obvious (i.e., if there are numbers assigned to gender), the level of measurement and anything special to know about the variables (for instance, the source if you mashed two data sets together). If you’re using secondary data, the researchers sharing the data should make the data dictionary available.
-
Let’s take that mini data set we’ve got up above and we’ll show you what your data dictionary might look like in Table 2.4.
| Variable name | Description | Values/Levels | Level of measurement | Notes |
| Name | Participant’s first name | open-ended response | Nominal | First name only. If name appears more than once, a random number has been attached to the end of the name to distinguish. |
| Age | Participant’s age at time of survey | integer, in years | Ratio | Self-reported |
| Gender | Participant’s self-identified gender | 0=cisgender female; 1=cisgender male; 2=non-binary; 3=transgender female; 4=transgender male; 5=another gender | Nominal | Self-reported |
| Hometown | Participant’s hometown | 0=This town
1=Another town |
Nominal | Self-reported |
| Fav_Flav | Participant’s favorite ice cream | open-ended response | Nominal | Self-reported |
Quantitative Data: Univariate Analysis
As part of planning for your research, you should come up with a data analysis plan. Remember, a data analysis plan is an ordered outline that includes your research question, a description of the data you are going to use to answer it, and the exact step-by-step analyses that you plan to run to answer your research question. A basic data analysis plan might look something like what you see in Table 2.5. Don’t panic if you don’t yet understand some of the statistical terms in the plan; we’re going to delve into some of them in this section, and others will be covered in more depth in your statistics courses. Note here also that this is what operationalizing your variables and moving through your research with them looks like on a basic level. We will cover operationalization in more depth in Chapter 10.
| Research question: What is the relationship between a person’s race and their likelihood to graduate from high school? |
| Data: Individual-level U.S. American Community Survey data for 2017 from IPUMS, which includes race/ethnicity and other demographic data (i.e., educational attainment, family income, employment status, citizenship, presence of both parents, etc.). Only including individuals for which race and educational attainment data is available. |
Steps in Data Analysis Plan
|
An important point to remember is that you should never get stuck on using a particular statistical method because you or one of your co-researchers thinks it’s cool or it’s the hot thing in your field right now. You should certainly go into your data analysis plan with ideas, but in the end, you need to let your research question guide what statistical tests you plan to use. Be prepared to be flexible if your plan doesn’t pan out because the data is behaving in unexpected ways.
You’ll notice that the first step in the quantitative data analysis plan is univariate and descriptive statistics. Univariate data analysis is a quantitative method in which a variable is examined individually to determine its distribution, or the way the scores are distributed across the levels, or values, of that variable. When we talk about levels, what we are talking about are the possible values of the variable—like a participant’s age, income, or gender. (Note that this is different from levels of measurement, which will be discussed in Chapter 11, but the level of measurement of your variables absolutely affects what kinds of analyses you can do with it.) Univariate analysis is non-relational, which just means that we’re not looking into how our variables relate to each other. Instead, we’re looking at variables in isolation to try to understand them better. For this reason, univariate analysis is used for descriptive research questions.
So, when do you use univariate data analysis? Always! It should be the first step you take with your quantitative data, whether you plan to move on to more complex statistical analyses or are conducting a study to describe a new phenomenon. You need to understand what the values of each variable look like—what if one of your variables has a lot of missing data because participants didn’t answer that question on your survey? What if there isn’t much variation in the gender of your sample? These are things you’ll learn through univariate analysis.
Quantitative Data: Bivariate Analysis
Did you know that ice cream causes shark attacks? It’s true! When ice cream sales go up in the summer, so does the rate of shark attacks. So you’d better put down that ice cream cone unless you want to make yourself look more delicious to a shark.

Ok, so it’s quite obviously not true that ice cream causes shark attacks. But if you looked at these two variables and how they’re related, you’d notice that during times of the year with high ice cream sales, there are also the most shark attacks. This is a classic example of the difference between correlation and causation. Despite the conclusion we drew about causation being wrong, it’s nonetheless true that these two variables are related, and researchers figured that out through the use of bivariate analysis.
Bivariate analysis consists of a group of statistical techniques that examine the association between two variables. We could look at how anti-depressant medications and appetite are related, whether there is a relation between having a pet and emotional well-being, or if a policy-maker’s level of education is related to how they vote on bills related to environmental issues.
Bivariate analysis forms the foundation of multivariate analysis, which we don’t get to in this book. All you really need to know here is that there are steps beyond bivariate analysis, which you’ve undoubtedly seen in scholarly literature already! But before we can move forward with multivariate analysis, we need to understand the associations between the variables in our study.
Throughout your PhD program, you will learn much more about quantitative data analysis techniques, including more sophisticated multivariate analysis methods. Hopefully, this section has provided you with some initial insights into how data is analyzed, and the importance of creating a data analysis plan prior to collecting data. Next, we will discuss some basic strategies for creating a qualitative data analysis plan.
Resources for Quantitative Data Analysis
If you are affiliated with a university, you will likely have access to some kind of commercial statistics software. Examples in the previous section use SPSS, a common commercial statistical software package. SPSS is relatively easy to use due to its graphical user interface, which does not require researchers to learn basic computer programming. However, like its competitors SAS and STATA, SPSS is expensive and the software license must be renewed every year (like a subscription).
We suggest getting familiar with open source statistical software packages such JASP Statistics or R. JASP is a free and open-source alternative to SPSS developed and supported by the University of Amsterdam. It has a similar user interface as SPSS, and should be similarly easy to learn. Moreover, usability upgrades from SPSS like generating APA formatted tables make it a compelling option. While a great many of my students will rely on statistical analyses of their programs and practices in reports to funders, it is unlikely that any will use SPSS. Browse JASP’s how-to guide or consult this textbook Learning Statistics with JASP: A Tutorial for Psychology Students and Other Beginners, written by Danielle J. Navarro, David R. Foxcroft, and Thomas J. Faulkenberry.
R (a.k.a. The R Project for Statistical Computing) uses a command line interface, so you will need some coding knowledge in order to use it. Luckily, R is the most commonly used statistics software in the world, and the community of support and guides for using R are omnipresent online. For beginning researchers, consult the textbook Learning Statistics with R: A tutorial for psychology students and other beginners by Danielle J. Navarro.
While statistics software is sometimes needed to perform advanced statistical tests, most univariate and bivariate tests can be performed in spreadsheet software like Microsoft Excel, Google Sheets, or the free and open source LibreOffice Calc. Microsoft includes a ToolPak to perform complex data analysis as an add-on to Excel. For more information on using spreadsheet software to perform statistics, the open textbook Collaborative Statistics Using Spreadsheets by Susan Dean, Irene Mary Duranczyk, Barbara Illowsky, Suzanne Loch, and Janet Stottlemyer.
Statistical analysis is performed in just about every discipline, and as a result, there are a lot of openly licensed, free resources to assist you with your data analysis. We have endeavored to provide you with the basics in the past few chapters, but ultimately, you will likely need additional support in completing quantitative data analysis from an instructor, textbook, or other resource. Browse the Open Textbook Library for statistics resources or look for video tutorials from reputable instructors like this video textbook on statistics by Bryan Koenig.
Qualitative Data: Management
Qualitative research often involves human participants and qualitative data can include recordings or transcripts of their words, photographs or images, or diaries and documents. The personal nature of qualitative data poses the challenge of recognizability of sensitive information on individuals, communities, and places. If you choose this methodology for your research, you should familiarize yourself with policies, procedures, and rules to ensure the safety and security of data in the documentation and dissemination process.
In any research involving primary data, a researcher is not only entrusted with the responsibility of upholding the privacy of their participants but also accountable to them, making confidentiality and human subjects’ protection front and center of qualitative data management. Data such as audiotapes, videotapes, transcripts, notes, and other records should be stored and secured in locations where only authorized persons have access to them.
Sometimes in qualitative research, you will learn intimate details about people’s lives. Often, qualitative data contain personal identifiers. A helpful practice to ensure that participants’ confidentiality is to replace personal information in transcripts with pseudonyms or descriptive language (e.g., “[the participant’s sister]” instead of the sister’s name). Once audio and video recordings have been accurately transcribed with the de-identification of personal identifiers, the original recordings should be destroyed.
Qualitative Data: Analysis
There are many different types of qualitative data, including transcripts of interviews and focus groups, observational data, documents and other artifacts, and more. Your qualitative data analysis plan should be anchored in the type of data collected and the purpose of your study. Qualitative research can serve a range of purposes. Below is a brief list of general questions we might consider when using a qualitative approach.
-
-
- Are you trying to understand how a particular group is affected by an issue?
- Are you trying to uncover how people arrive at a decision in a given situation?
- Are you trying to examine different points of view on the impact of a recent event?
- Are you trying to summarize how people understand or make sense of a condition?
- Are you trying to describe the needs of your target population?
-
If you don’t see the general aim of your research question reflected in one of these areas, don’t fret! This is only a small sampling of what you might be trying to accomplish with your qualitative study. Whatever your aim, you need to have a plan for what you will do once you have collected your data.
Iterative or Linear
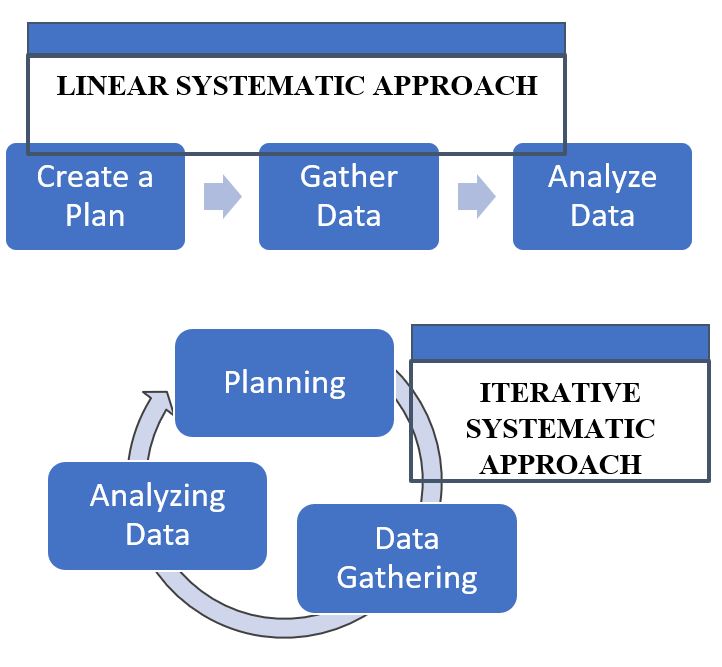
Some qualitative research is linear, meaning it follows more of a traditionally quantitative process: create a plan, gather data, and analyze data; each step is completed before we proceed to the next.
However, many times qualitative research is iterative, or evolving in cycles. An iterative approach means that once we begin collecting data, we also begin analyzing data as it is coming in. This early and ongoing analysis of our (incomplete) data then impacts our continued planning, data gathering, and future analysis.
As a comparison, think about the way this book is written and used. It is written linearly, but you will likely engage with it iteratively as you use it for future reference. You may revisit previous sections so you can understand how they fit together and you are in a continuous process of building and revising how you think about the concepts you are learning about.
As you may have guessed, there are benefits and challenges to both linear and iterative approaches. A linear approach is much more straightforward, with each step being fairly defined. However, linear research being more defined and rigid also presents certain challenges. A linear approach assumes that we know what we need to ask or look for at the very beginning of data collection, which often is not the case. Figure 2.1 contrasts the two approaches.
With iterative research, we have more flexibility to adapt our approach as we learn new things. We still need to keep our approach systematic and organized, however, so that our work doesn’t become a free-for-all. As we adapt, we do not want to stray too far from the original premise of our study. It’s also important to remember with an iterative approach that we may risk ethical concerns if our work extends beyond the original boundaries of our informed consent and institutional review board agreement (IRB; see Chapter 3 for more on IRBs). If you need to update your original research plan as you gain more insight into the topic, you can submit an addendum to modify your original IRB application. Make sure to keep detailed notes of the decisions that you are making and what is informing these choices. This helps to support transparency and credibility throughout the research process.
Acquainting yourself with your data
As you begin your analysis, you need to get to know your data. This often means reading through your data prior to any attempt at breaking it apart and labeling it. It is common to read transcripts at least twice before beginning any analyses. This helps give you a more comprehensive feel for each piece of data and the data as a whole, again, before you start to break it down into smaller units or deconstruct it. This is especially important if others assisted in the data collection process. We often gather data as part of a team and everyone involved in the analysis needs to be very familiar with all of the data.
Capturing your emerging understanding of the data
During your reviewing you will start to develop and evolve your understanding of what the data means. Coding is a part of the qualitative data analysis process where we begin to interpret and assign meaning to the data. It represents one of the first steps as we begin to filter the data through our own subjective lens as the researcher. This understanding of the data should be dynamic and flexible, but you want to have a way to capture this understanding as it evolves. You may include this as part of your qualitative codebook where you are tracking the main ideas that are emerging and what they mean. Table 2.6 is an example of how your thinking might change about a code and how you can go about capturing it.
| Date | Code |
Explanations |
| 6/18/24 | Experience of wellness | This code captures the different ways people describe wellness in their lives |
| 6/22/24 | Understanding of wellness | Changed the label of this code slightly to reflect that many participants emphasize the cognitive aspect of how they understand wellness—how they think about it in their lives, not only the act of ‘experiencing it’. This understanding seems like a precursor to experiencing. An evolving sense of how you think about wellness in your life. |
| 6/25/24 | Wellness experienced by developing personal awareness | A broader understanding of this category is developing. It involves building a personalized understanding of what makes up wellness in each person’s life and the role that they play in maintaining it. Participants have emphasized that this is a dynamic, personal and ongoing process of uncovering their own intimate understanding of wellness. They describe having to experiment, explore, and reflect to develop this awareness. |
There are a variety of different approaches to qualitative analysis, including thematic analysis, content analysis, grounded theory, phenomenology, photovoice, and more. The specific steps you will take to code your qualitative data and generate themes from these codes will vary based on the analytic strategy you are employing. In designing your qualitative study, you would identify an analytical approach as you plan out your project. The one you select would depend on the type of data you have and what you want to accomplish with it. In Chapter 19, we will go into more detail about various types of qualitative data analysis. Each qualitative approach has specific techniques and methods that take substantial study and practice to master.
Key Takeaways
- Getting organized at the beginning of your project with a data analysis plan will help keep you on track. Data analysis plans should include your research question, a description of your data, and a step-by-step outline of what you’re going to do with it. [chapter 14.1]
- Be flexible with your data analysis plan—sometimes data surprises us and we have to adjust the statistical tests we are using. [chapter 14.1]
- Always make a data dictionary or, if using secondary data, get a copy of the data dictionary so you (or someone else) can understand the basics of your data. [chapter 14.1]
- Bivariate analysis is a group of statistical techniques that examine the relationship between two variables. [chapter 15.1]
- You need to conduct bivariate analyses before you can begin to draw conclusions from your data, including in future multivariate analyses. [chapter 15.1]
- There are a lot of high-quality and free online resources to learn and perform statistical analysis.
- Qualitative research analysis requires preparation and careful planning. You will need to take time to familiarize yourself with the data in a general sense before you begin analyzing. [chapter 19.3]
- The specific steps you will take to code your qualitative data and generate final themes will depend on the qualitative analytic approach you select.
Exercises
TRACK 1 (IF YOU ARE CREATING A RESEARCH PROPOSAL FOR THIS CLASS)
- Make a data analysis plan for your project. Remember this should include your research question, a description of the data you will use, and a step-by-step outline of what you’re going to do with your data once you have it, including statistical tests (non-relational and relational) that you plan to use. You can do this exercise whether you’re using quantitative or qualitative data! The same principles apply.
- Make a data dictionary for the data you are proposing to collect as part of your study. You can use the example above as a template.
TRACK 2 (IF YOU AREN’T CREATING A RESEARCH PROPOSAL FOR THIS CLASS)
You are researching the impact of your city’s recent harm reduction interventions for intravenous drug users (e.g., sterile injection kits, monitored use, overdose prevention, naloxone provision, etc.).
- Make a draft quantitative data analysis plan for your project. Remember this should include your research question, a description of the data you will use, and a step-by-step outline of what you’re going to do with your data once you have it, including statistical tests (non-relational and relational) that you plan to use. It’s okay if you don’t yet have a complete idea of the types of statistical analyses you might use.
An ordered outline that includes your research question, a description of the data you are going to use to answer it, and the exact analyses, step-by-step, that you plan to run to answer your research question.
The name of your variable.
The rows in your data set. In social work, these are often your study participants (people), but can be anything from census tracts to black bears to trains.
This is the document where you list your variable names, what the variables actually measure or represent, what each of the values of the variable mean if the meaning isn't obvious.
process by which researchers spell out precisely how a concept will be measured in their study
A group of statistical techniques that examines the relationship between at least three variables
Univariate data analysis is a quantitative method in which a variable is examined individually to determine its distribution.
the way the scores are distributed across the levels of that variable.
Chapter Outline
- Practical and ethical considerations (14 minute read)
- Raw data (10 minute read)
- Creating a data analysis plan (?? minute read)
- Critical considerations (3 minute read)
Content warning: Examples in this chapter discuss substance use disorders, mental health disorders and therapies, obesity, poverty, gun violence, gang violence, school discipline, racism and hate groups, domestic violence, trauma and triggers, incarceration, child neglect and abuse, bullying, self-harm and suicide, racial discrimination in housing, burnout in helping professions, and sex trafficking of indigenous women.
2.1 Practical and ethical considerations
Learning Objectives
Learners will be able to...
- Identify potential stakeholders and gatekeepers
- Differentiate between raw data and the results of scientific studies
- Evaluate whether you can feasibly complete your project
Pre-awareness check (Knowledge)
Similar to practice settings, research has ethical considerations that must be taken to ensure the safety of participants. What ethical considerations were relevant to your practice experience that may have impacted the delivery of services?
As a PhD student, you will have many opportunities to conduct research. You may be asked to be a part of a research team led by the faculty at your institution. You will also conduct your own research for your dissertation. As you will learn, research can take many forms. For example, you may want to focus qualitatively on individuals’ lived experiences, or perhaps you will quantitatively assess the impact of interventions on research subjects. You may work with large, already-existing datasets, or you may create your own data. Though social work research can vary widely from project to project, researchers typically follow the same general process, even if their specific research questions and methodologies differ. Table 2.1 outlines the major components of the research process covered in this textbook, and indicates the chapters where you will find more information on each subject. You will notice that your research paradigm is an organizing framework that guides each component of the research process.
Table 2.1 Components of the Research Process
|
Research Paradigm The research paradigm is a guiding framework at each step. See Chapter 7 for more information on paradigms. How does your paradigm influence the decisions you make as a researcher?
|
Component of the Research Process | Brief Description | Chapter(s) |
| Problem formulation | The researcher chooses a social problem to focus on in their study. | 2 | |
| Theory | After selecting a topic for study, researchers will often choose one or more theories they believe will inform the design, conduct, and interpretation of their study. | 7 | |
| Conceptual framework | Researchers propose how the chosen theories, as well as the variables included within these theories, are connected to their research problem. If working quantitatively, the team will think through the causal factors and outcomes of interest for this particular study. | 7,11 | |
| Literature review | The researchers search several databases for peer-reviewed empirical articles on the chosen problem and theories. The conceptual framework will be adapted as needed based on this review. | 3,4,5 | |
| Research question(s) | Using the knowledge gained through the literature review, researchers pose specific research questions they intend to answer. | 2,9 | |
| Study design | Researchers decide if their research questions will be answered by quantitative or qualitative methods.
Quantitative studies may use survey or experimental design. The research team will make decisions about sampling, design, measurement, and analysis. |
Sampling: 10, Design: 13, Measurement: 11 | |
| IRB approval | If the study will involve human subjects, the researchers will need to get institutional review board (IRB) approval prior to commencing the study. The team will need to think through the ethical risks and mitigation strategies for their chosen study design. | 1, 6 | |
| Collect, manage, and analyze data | Once IRB approval has been obtained, the data collection process is ready to begin. Researchers will conduct their study, clean and manage data, and then will analyze it. |
Quant: 14, 15, 16 Qual: 17, 18, 19 |
|
| Publish results | At the end of the research process, the team will determine how to disseminate results. They may choose to write a research article. Such articles typically explain the study’s literature review, methods, and results, and include a discussion of the implications and conclusions of the study. Future research directions may also be identified. | 24 |
Feasibility
Feasibility refers to whether you can practically conduct the study you plan to do, given the resources and ethical obligations you have. In this chapter, we will review some important practical and ethical considerations researchers should start thinking about from the beginning of a research project. These considerations apply to all research, but it is important to also consider the context of research and researchers when thinking about feasibility.
For example, as a doctoral student, you likely have a unique set of circumstances that inspire and constrain your research. Some students have the ability to engage in independent studies where they can gain skills and expertise in specialized research methods to prepare them for a research-intensive career. Others may have reasons, such as a limited amount of funding or family concerns, that encourage them to complete their dissertation research as quickly as possible. These circumstances relate to the feasibility of a research project. Regardless of the potential societal importance of a 10-year longitudinal study, it’s not feasible for a student to conduct it in time to graduate! Your dissertation chair, doctoral program director, and other faculty mentors can help you navigate the many decisions you will face as a doctoral student about conducting independent research or joining research projects.
The context and role of the researcher continue to affect feasibility even after a doctoral student graduates. Many will continue in their careers to become tenure track faculty with research expectations to obtain tenure. Some funders expect faculty members to have a track record of successful projects before trusting them to lead expensive or long-term studies. Realistically, these expectations will influence what research is feasible for a junior faculty member to conduct. Just like for doctoral students, mentorship is incredibly valuable for junior faculty to make informed decisions about what research to conduct. Senior faculty, associate deans of research, chairs, and deans can help junior faculty decide what projects to pursue to ensure they meet the expectations placed on them without losing sight of the reasons they became a researcher in the first place.
As you read about other feasibility considerations such as gaining access, consent, and collecting data, consider the ways in which context and roles also influence feasibility.
Access, consent, and ethical obligations
One of the most important feasibility issues is gaining access to your target population. For example, let’s say you wanted to better understand middle-school students who engaged in self-harm behaviors. That is a topic of social importance, but what challenges might you face in accessing this population? Let's say you proposed to identify students from a local middle school and interview them about self-harm. Methodologically, that sounds great since you are getting data from those with the most knowledge about the topic, the students themselves. But practically, that sounds challenging. Think about the ethical obligations a social work practitioner has to adolescents who are engaging in self-harm (e.g., competence, respect). In research, we are similarly concerned mostly with the benefits and harms of what you propose to do as well as the openness and honesty with which you share your project publicly.

Gatekeepers
If you were the principal at your local middle school, would you allow researchers to interview kids in your schools about self-harm? What if the results of the study showed that self-harm was a big problem that your school was not addressing? What if the researcher's interviews themselves caused an increase in self-harming behaviors among the children? The principal in this situation is a gatekeeper. Gatekeepers are the individuals or organizations who control access to the population you want to study. The school board would also likely need to give consent for the research to take place at their institution. Gatekeepers must weigh their ethical questions because they have a responsibility to protect the safety of the people at their organization, just as you have an ethical obligation to protect the people in your research study.
For vulnerable populations, it can be a challenge to get consent from gatekeepers to conduct your research project. As a result, researchers often conduct research projects in places where they have established trust with gatekeepers. In the case where the population (children who self-harm) are too vulnerable, researchers may collect data from people who have secondary knowledge about the topic. For example, the principal may be more willing to let you talk to teachers or staff, rather than children.
Stakeholders
In some cases, researchers and gatekeepers partner on a research project. When this happens, the gatekeepers become stakeholders. Stakeholders are individuals or groups who have an interest in the outcome of the study you conduct. As you think about your project, consider whether there are formal advisory groups or boards (like a school board) or advocacy organizations who already serve or work with your target population. Approach them as experts and ask for their review of your study to see if there are any perspectives or details you missed that would make your project stronger.
There are many advantages to partnering with stakeholders to complete a research project together. Continuing with our example on self-harm in schools, in order to obtain access to interview children at a middle school, you will have to consider other stakeholders' goals. School administrators also want to help students struggling with self-harm, so they may want to use the results to form new programs. But they may also need to avoid scandal and panic if the results show high levels of self-harm. Most likely, they want to provide support to students without making the problem worse. By bringing in school administrators as stakeholders, you can better understand what the school is currently doing to address the issue and get an informed perspective on your project's questions. Negotiating the boundaries of a stakeholder relationship requires strong meso-level practice skills.
Of course, partnering with administrators probably sounds quite a bit easier than bringing on board the next group of stakeholders—parents. It's not ethical to ask children to participate in a study without their parents' consent. We will review the parameters of parental and child consent in Chapter 5. Parents may be understandably skeptical of a researcher who wants to talk to their child about self-harm, and they may fear potential harm to the child and family from your study. Would you let a researcher you didn't know interview your children about a very sensitive issue?
Social work research must often satisfy multiple stakeholders. This is especially true if a researcher receives a grant to support the project, as the funder has goals it wants to accomplish by funding the research project. Your university is also a stakeholder in your project. When you conduct research, it reflects on your school. If you discover something of great importance, your school looks good. If you harm someone, they may be liable. Your university likely has opportunities for you to share your research with the campus community, and may have incentives or grant programs for researchers. Your school also provides you with support and access to resources like the library and data analysis software.
Target population
So far, we've talked about access in terms of gatekeepers and stakeholders. Let's assume all of those people agree that your study should proceed. But what about the people in the target population? They are the most important stakeholder of all! Think about the children in our proposed study on self-harm. How open do you think they would be to talking to you about such a sensitive issue? Would they consent to talk to you at all?
Maybe you are thinking about simply asking clients on your caseload. As we talked about before, leveraging existing relationships created through field work can help with accessing your target population. However, they introduce other ethical issues for researchers. Asking clients on your caseload or at your agency to participate in your project creates a dual relationship between you and your client. What if you learn something in the research project that you want to share with your clinical team? More importantly, would your client feel uncomfortable if they do not consent to your study? Social workers have power over clients, and any dual relationship would require strict supervision in the rare case it was allowed.
Resources and scope
Let's assume everyone consented to your project and you have adequately addressed any ethical issues with gatekeepers, stakeholders, and your target population. That means everything is ready to go, right? Not quite yet. As a researcher, you will need to carry out the study you propose to do. Depending on how big or how small your proposed project is, you’ll need a little or a lot of resources.
Raw data
One thing that all projects need is raw data. Raw data can come in may forms. Very often in social science research, raw data includes the responses to a survey or transcripts of interviews and focus groups, but raw data can also include experimental results, diary entries, art, or other data points that social scientists use in analyzing the world. Primary data is data you have collected yourself. Sometimes, social work researchers do not collect raw data of their own, but instead use secondary data analysis to analyze raw data that has been shared by other researchers. Secondary data is data someone else has collected that you have permission to use in your research. For example, you could use data from a local probation program to determine if a shoplifting prevention group was reducing the rate at which people were re-offending. You would need data on who participated in the program and their criminal history six months after the end of their probation period. This is secondary data you could use to determine whether the shoplifting prevention group had any effect on an individual's likelihood of re-offending. Whether a researcher should use secondary data or collect their own raw data is an important choice which we will discuss in greater detail in section 2.2. Collecting raw data or obtaining secondary data can be time consuming or expensive, but without raw data there can be no research project.

Time
Time is an important resource to consider when designing research projects. Make sure that your proposal won't require you to spend more time than you have to collect and analyze data. Think realistically about the timeline for your research project. If you propose to interview fifty mental health professionals in their offices in your community about your topic, make sure you can dedicate fifty hours to conduct those interviews, account for travel time, and think about how long it will take to transcribe and analyze those interviews.
- What is reasonable for you to do in your timeframe?
- How many hours each week can the research team dedicate to this project?
One thing that can delay a research project is receiving approval from the institutional review board (IRB), the research ethics committee at your university. If your study involves human subjects, you may have to formally propose your study to the IRB and get their approval before gathering your data. A well-prepared study is likely to gain IRB approval with minimal revisions needed, but the process can take weeks to complete and must be done before data collection can begin. We will address the ethical obligations of researchers in greater detail in Chapter 5.
Money
Most research projects cost some amount of money. Potential expenses include wages for members of the research team, incentives for research participants, travel expenses, and licensing costs for standardized instruments. Most researchers seek grant funding to support the research. Grant applications can be time consuming to write and grant funding can be competitive to receive.
Knowledge, competence, and skills
For social work researchers, the social work value of competence is key in their research ethics.
Clearly, researchers need to be skilled in working with their target population in order to conduct ethical research. Some research addresses this challenge by collecting data from competent practitioners or administrators who have second-hand knowledge of target populations based on professional relationships. Members of the research team delivering an intervention also need to have training and skills in the intervention. For example, if a research study examines the effectiveness of dialectical behavioral therapy (DBT) in a particular context, the person delivering the DBT must be certified in DBT. Another idea to keep in mind is the level of data collection and analysis skills needed to complete the project. Some assessments require training to administer. Analyses may be complex or require statistical consultation or advanced training.
Summary
In summary, here are a few questions you should ask yourself about your project to make sure it's feasible. While we present them early on in the research process (we're only in Chapter 2), these are certainly questions you should ask yourself throughout the proposal writing process. We will revisit feasibility again in Chapter 9 when we work on finalizing your research question.
- Do you have access to the data you need or can you collect the data you need?
- Will you be able to get consent from stakeholders, gatekeepers, and your target population?
- Does your project pose risk to individuals through direct harm, dual relationships, or breaches in confidentiality?
- Are you competent enough to complete the study?
- Do you have the resources and time needed to carry out the project?
Key Takeaways
- People will have to say “yes” to your research project. Evaluate whether your project might have gatekeepers or potential stakeholders. They may control access to data or potential participants.
- Researchers need raw data such as survey responses, interview transcripts, or client charts. Your research project must involve more than looking at the analyses conducted by other researchers, as the literature review is only the first step of a research project.
- Make sure you have enough resources (time, money, and knowledge) to complete your research project.
Post-awareness check (Emotion)
What factors have created your passion toward assisting your target population? How can this connection enhance your ability to receive a “yes” from potential participants? What are the anticipated challenges to receiving a “yes” from potential participants?
Exercises
TRACK 1 (IF YOU ARE CREATING A RESEARCH PROPOSAL FOR THIS CLASS)
Think about how you might answer your question by collecting your own data.
- Identify any gatekeepers and stakeholders you might need to contact.
- How can you increase the likelihood you will get access to the people or records you need for your study?
Describe the resources you will need for your project.
- Do you have concerns about feasibility?
TRACK 2 (IF YOU AREN'T CREATING A RESEARCH PROPOSAL FOR THIS CLASS)
You are researching the impact of your city's recent harm reduction interventions for intravenous drug users (e.g., sterile injection kits, monitored use, overdose prevention, naloxone provision, etc.).
- Thinking about the services related to this issue in your own city, identify any gatekeepers and stakeholders you might need to contact.
- How might you approach these gatekeepers and stakeholders? How would you explain your study?
Describe the resources you will need for your project.
- Do you have concerns about feasibility?
2.2 Raw data
Learning Objectives
Learners will be able to...
- Identify potential sources of available data
- Weigh the challenges and benefits of collecting your own data
In our previous section, we addressed some of the challenges researchers face in collecting and analyzing raw data. Just as a reminder, raw data are unprocessed, unanalyzed data that researchers analyze using social science research methods. It is not just the statistics or qualitative themes in journal articles. It is the actual data from which those statistical outputs or themes are derived (e.g., interview transcripts or survey responses).
There are two approaches to getting raw data. First, students can analyze data that are publicly available or from agency records. Using secondary data like this can make projects more feasible, but you may not find existing data that are useful for answering your working question. For that reason, many students gather their own raw data. As we discussed in the previous section, potential harms that come from addressing sensitive topics mean that surveys and interviews of practitioners or other less-vulnerable populations may be the most feasible and ethical way to approach data collection.
Using secondary data
Within the agency setting, there are two main sources of raw data. One option is to examine client charts. For example, if you wanted to know if substance use was related to parental reunification for youth in foster care, you could look at client files and compare how long it took for families with differing levels of substance use to be reunified. You will have to negotiate with the agency the degree to which your analysis can be public. Agencies may be okay with you using client files for a class project but less comfortable with you presenting your findings at a city council meeting. When analyzing data from your agency, you will have to manage a stakeholder relationship.
Another great example of agency-based raw data comes from program evaluations. If you are working with a grant funded agency, administrators and clinicians are likely producing data for grant reporting. The agency may consent to have you look at the raw data and run your own analysis. Larger agencies may also conduct internal research—for example, surveying employees or clients about new initiatives. These, too, can be good sources of available data. Generally, if the agency has already collected the data, you can ask to use them. Again, it is important to be clear on the boundaries and expectations of the agency. And don't be angry if they say no!
Some agencies, usually government agencies, publish their data in formal reports. You could take a look at some of the websites for county or state agencies to see if there are any publicly available data relevant to your research topic. As an example, perhaps there are annual reports from the state department of education that show how seclusion and restraint is disproportionately applied to Black children with disabilities, as students found in Virginia. In another example, one student matched public data from their city's map of criminal incidents with historically redlined neighborhoods. For this project, she is using publicly available data from Mapping Inequality, which digitized historical records of redlined housing communities and the Roanoke, VA crime mapping webpage. By matching historical data on housing redlining with current crime records, she is testing whether redlining still impacts crime to this day.
Not all public data are easily accessible, though. The student in the previous example was lucky that scholars had digitized the records of how Virginia cities were redlined by race. Sources of historical data are often located in physical archives, rather than digital archives. If your project uses historical data in an archive, it would require you to physically go to the archive in order to review the data. Unless you have a travel budget, you may be limited to the archival data in your local libraries and government offices. Similarly, government data may have to be requested from an agency, which can take time. If the data are particularly sensitive or if the department would have to dedicate a lot of time to your request, you may have to file a Freedom of Information Act request. This process can be time-consuming, and in some cases, it will add financial cost to your study.
Another source of secondary data is shared by researchers as part of the publication and review process. There is a growing trend in research to publicly share data so others can verify your results and attempt to replicate your study. In more recent articles, you may notice links to data provided by the researcher. Often, these have been de-identified by eliminating some information that could lead to violations of confidentiality. You can browse through the data repositories in Table 2.1 to find raw data to analyze. Make sure that you pick a data set with thorough and easy to understand documentation. You may also want to use Google's dataset search which indexes some of the websites below as well as others in a very intuitive and easy to use way.
| Organizational home | Focus/topic | Data | Web address |
| National Opinion Research Center | General Social Survey; demographic, behavioral, attitudinal, and special interest questions; national sample | Quantitative | https://gss.norc.org/ |
| Carolina Population Center | Add Health; longitudinal social, economic, psychological, and physical well-being of cohort in grades 7–12 in 1994 | Quantitative | http://www.cpc.unc.edu/projects/addhealth |
| Center for Demography of Health and Aging | Wisconsin Longitudinal Study; life course study of cohorts who graduated from high school in 1957 | Quantitative | https://www.ssc.wisc.edu/wlsresearch/ |
| Institute for Social & Economic Research | British Household Panel Survey; longitudinal study of British lives and well- being | Quantitative | https://www.iser.essex.ac.uk/bhps |
| International Social Survey Programme | International data similar to GSS | Quantitative | http://www.issp.org/ |
| The Institute for Quantitative Social Science at Harvard University | Large archive of written data, audio, and video focused on many topics | Quantitative and qualitative | http://dvn.iq.harvard.edu/dvn/dv/mra |
| Institute for Research on Women and Gender | Global Feminisms Project; interview transcripts and oral histories on feminism and women’s activism | Qualitative | https://globalfeminisms.umich.edu/ |
| Oral History Office | Descriptions and links to numerous oral history archives | Qualitative | https://archives.lib.uconn.edu/islandora/ object/20002%3A19840025 |
| UNC Wilson Library | Digitized manuscript collection from the Southern Historical Collection | Qualitative | http://dc.lib.unc.edu/ead/archivalhome.php? CISOROOT=/ead |
| Qualitative Data Repository | A repository of qualitative data that can be downloaded and annotated collaboratively with other researchers | Qualitative | https://qdr.syr.edu/ |
Ultimately, you will have to weigh the strengths and limitations of using secondary data on your own. Engel and Schutt (2016, p. 327)[1] propose six questions to ask before using secondary data:
- What were the agency’s or researcher’s goals in collecting the data?
- What data were collected, and what were they intended to measure?
- When was the information collected?
- What methods were used for data collection? Who was responsible for data collection, and what were their qualifications? Are they available to answer questions about the data?
- How is the information organized (by date, individual, family, event, etc.)? Are identifiers used to indicate different types of data available?
- What is known about the success of the data collection effort? How are missing data indicated and treated? What kind of documentation is available? How consistent are the data with data available from other sources?
In this section, we've talked about data as though it is always collected by scientists and professionals. But that's definitely not the case! Think more broadly about sources of data that are already out there in the world. Perhaps you want to examine the different topics mentioned in the past 10 State of the Union addresses by the President. Or maybe you want to examine whether the websites and public information about local health and mental health agencies use gender-inclusive language. People share their experiences through blogs, social media posts, videos, performances, among countless other sources of data. When you think broadly about data, you'll be surprised how much you can answer with available data.
Collecting your own raw data
The primary benefit of collecting your own data is that it allows you to collect and analyze the specific data you are looking for, rather than relying on what other people have shared. You can make sure the right questions are asked to the right people. Your early research projects may be smaller in scope. This isn't necessarily a limitation. Early projects are often the first step in a long research trajectory in which the same topic is studied in increasing detail and sophistication over time.
Student researchers often propose to survey or interview practitioners. The focus of these projects should be about the practice of social work and the study will uncover how practitioners understand what they do. Surveys of practitioners often test whether responses to questions are related to each other. For example, you could propose to examine whether someone's length of time in practice was related to the type of therapy they use or their level of burnout. Interviews or focus groups can also illuminate areas of practice. One student proposed to conduct focus groups of individuals in different helping professions in order to understand how they viewed the process of leaving an abusive partner. She suspected that people from different disciplines would make unique assumptions about the survivor's choices.
It's worth remembering here that you need to have access to practitioners, as we discussed in the previous section. Resourceful researchers will look at publicly available databases of practitioners, draw from agency and personal contacts, or post in public forums like Facebook groups. Consent from gatekeepers is important, and as we described earlier, you and your agency may be interested in collaborating on a project. Bringing your agency on board as a stakeholder in your project may allow you access to company email lists or time at staff meetings as well as access to practitioners. One student partnered with her internship placement at a local hospital to measure the burnout that nurses experienced in their department. Her project helped the agency identify which departments may need additional support.
Another possible way you could collect data is by partnering with your agency on evaluating an existing program. Perhaps they want you to evaluate the early stage of a program to see if it's going as planned and if any changes need to be made. Maybe there is an aspect of the program they haven't measured but would like to, and you can fill that gap for them. Collaborating with agency partners in this way can be a challenge, as you must negotiate roles, get stakeholder buy-in, and manage the conflicting time schedules of field work and research work. At the same time, it allows you to make your work immediately relevant to your specific practice and client population.
In summary, many early projects fall into one of the following categories. These aren't your only options! But they may be helpful in thinking about what research projects can look like.
- Analyzing charts or program evaluations at an agency
- Analyzing existing data from an agency, government body, or other public source
- Analyzing popular media or cultural artifacts
- Surveying or interviewing practitioners, administrators, or other less-vulnerable groups
- Conducting a program evaluation in collaboration with an agency
Key Takeaways
- All research projects require analyzing raw data.
- Research projects often analyze available data from agencies, government, or public sources. Doing so allows researchers to avoid the process of recruiting people to participate in their study. This makes projects more feasible but limits what you can study to the data that are already available to you.
- Think through the potential harm of discussing sensitive topics when surveying or interviewing clients and other vulnerable populations. Since many social work topics are sensitive, researchers often collect data from less-vulnerable populations such as practitioners and administrators.
Post-awareness check (Environment)
In what environment are you most comfortable in data collection (phone calls, face to face recruitment, etc)? Consider your preferred method of data collection that may align with both your personality and your target population.
Exercises
TRACK 1 (IF YOU ARE CREATING A RESEARCH PROPOSAL FOR THIS CLASS)
- Describe the difference between raw data and the results of research articles.
- Identify potential sources of secondary data that might help you answer your working question.
- Consider browsing around the data repositories in Table 2.1.
- Identify a common type of project (e.g., surveys of practitioners) and how conducting a similar project might help you answer your working question.
TRACK 2 (IF YOU AREN'T CREATING A RESEARCH PROPOSAL FOR THIS CLASS)
You are researching the impact of your city's recent harm reduction interventions for intravenous drug users (e.g., sterile injection kits, monitored use, overdose prevention, naloxone provision, etc.).
- Describe the difference between raw data and the results of research articles.
- Identify potential sources of secondary data that might help you in your harm reduction study.
- Consider browsing around the data repositories in Table 2.1.
- What kind of raw data might you collect yourself for your study?
2.3 Creating a data analysis plan
Learning Objectives
Learners will be able to...
-
- Define and construct a data analysis plan.
- Define key quantitative data management terms—variable name, data dictionary, primary and secondary data, observations/cases.
- Differentiate between univariate and bivariate quantitative analysis.
- Explain when we might use quantitative bivariate analysis in social work research.
- Identify how your qualitative research question, research aim, and type of data may influence your choice of analytic methods.
- Outline the steps you will take in preparation for conducting qualitative data analysis.
After you have your raw data, whether this is secondary data or data you collected yourself, you will need to analyze it. While the specific steps to follow in quantitative or qualitative data analysis are beyond the scope of this chapter, we are going to address some basic concepts in this section to help you create a data analysis plan. A data analysis plan is an ordered outline that includes your research question, a description of the data you are going to use to answer it, and the exact step-by-step analyses that you plan to run to answer your research question. If you look back at Table 2.1, you will see that creating a data analysis plan is a part of the study design process. The data analysis plan flows from the research question, is integral to the study design, and should be well conceptualized prior to beginning data collection. In this section, we will walk through the basics of quantitative and qualitative data analysis to help you understand the fundamentals of creating a data analysis plan.
Quantitative Data: Management
When considering what data you might want to collect as part of your project, there are two important considerations that can create dilemmas for researchers. You might only get one chance to interact with your participants, so you must think comprehensively in your planning phase about what information you need and collect as much relevant data as possible. At the same time, though, especially when collecting sensitive information, you need to consider how onerous the data collection is for participants and whether you really need them to share that information. Just because something is interesting to us doesn't mean it's related enough to our research question to chase it down. Work with your research team and/or faculty early in your project to talk through these issues before you get to this point. And if you're using secondary data, make sure you have access to all the information you need in that data before you use it.
Once you've collected your quantitative data, you need to make sure it is well-organized in a database in a way that's actually usable. "Database" can be kind of a scary word, but really, it can be as simple as an Excel spreadsheet or a data file in whatever program you're using to analyze your data. You may want to avoid Excel and use a formal database such as Microsoft Access or MySQL if you've got a large or complicated data set. But if your data set is smaller and you plan to keep your analyses simple, you can definitely get away with Excel. A typical data set is organized with variables as columns and observations/cases as rows. For example, let's say we did a survey on ice cream preferences and collected the following information in Table 2.3:
| Name | Age | Gender | Hometown | Fav_Ice_Cream |
| Tom | 54 | 0 | 1 | Rocky Road |
| Jorge | 18 | 2 | 0 | French Vanilla |
| Melissa | 22 | 1 | 0 | Espresso |
| Amy | 27 | 1 | 0 | Black Cherry |
There are a few key data management terms to understand:
-
-
- Variable name: Just what it sounds like—the name of your variable. Make sure this is something useful, short and, if you're using something other than Excel, all one word. Most statistical programs will automatically rename variables for you if they aren't one word, but the names can be a little ridiculous and long.
- Observations/cases: The rows in your data set. In social work, these are often your study participants (people), but can be anything from census tracts to black bears to trains. When we talk about sample size, we're talking about the number of observations/cases. In our mini data set, each person is an observation/case.
- Data dictionary (sometimes called a code book or metadata): This is the document where you list your variable names, what the variables actually measure or represent, what each of the values of the variable mean if the meaning isn't obvious (i.e., if there are numbers assigned to gender), the level of measurement and anything special to know about the variables (for instance, the source if you mashed two data sets together). If you're using secondary data, the researchers sharing the data should make the data dictionary available.
-
Let's take that mini data set we've got up above and we'll show you what your data dictionary might look like in Table 2.4.
| Variable name | Description | Values/Levels | Level of measurement | Notes |
| Name | Participant's first name | open-ended response | Nominal | First name only. If name appears more than once, a random number has been attached to the end of the name to distinguish. |
| Age | Participant's age at time of survey | integer, in years | Ratio | Self-reported |
| Gender | Participant's self-identified gender | 0=cisgender female; 1=cisgender male; 2=non-binary; 3=transgender female; 4=transgender male; 5=another gender | Nominal | Self-reported |
| Hometown | Participant's hometown | 0=This town
1=Another town |
Nominal | Self-reported |
| Fav_Flav | Participant's favorite ice cream | open-ended response | Nominal | Self-reported |
Quantitative Data: Univariate Analysis
As part of planning for your research, you should come up with a data analysis plan. Remember, a data analysis plan is an ordered outline that includes your research question, a description of the data you are going to use to answer it, and the exact step-by-step analyses that you plan to run to answer your research question. A basic data analysis plan might look something like what you see in Table 2.5. Don't panic if you don't yet understand some of the statistical terms in the plan; we're going to delve into some of them in this section, and others will be covered in more depth in your statistics courses. Note here also that this is what operationalizing your variables and moving through your research with them looks like on a basic level. We will cover operationalization in more depth in Chapter 11.
| Research question: What is the relationship between a person's race and their likelihood to graduate from high school? |
| Data: Individual-level U.S. American Community Survey data for 2017 from IPUMS, which includes race/ethnicity and other demographic data (i.e., educational attainment, family income, employment status, citizenship, presence of both parents, etc.). Only including individuals for which race and educational attainment data is available. |
Steps in Data Analysis Plan
|
An important point to remember is that you should never get stuck on using a particular statistical method because you or one of your co-researchers thinks it's cool or it's the hot thing in your field right now. You should certainly go into your data analysis plan with ideas, but in the end, you need to let your research question guide what statistical tests you plan to use. Be prepared to be flexible if your plan doesn't pan out because the data is behaving in unexpected ways.
You'll notice that the first step in the quantitative data analysis plan is univariate and descriptive statistics. Univariate data analysis is a quantitative method in which a variable is examined individually to determine its distribution, or the way the scores are distributed across the levels, or values, of that variable. When we talk about levels, what we are talking about are the possible values of the variable—like a participant's age, income or gender. (Note that this is different from levels of measurement, which will be discussed in Chapter 11, but the level of measurement of your variables absolutely affects what kinds of analyses you can do with it.) Univariate analysis is non-relational, which just means that we're not looking into how our variables relate to each other. Instead, we're looking at variables in isolation to try to understand them better. For this reason, univariate analysis is used for descriptive research questions.
So when do you use univariate data analysis? Always! It should be the first thing you do with your quantitative data, whether you are planning to move on to more sophisticated statistical analyses or are conducting a study to describe a new phenomenon. You need to understand what the values of each variable look like—what if one of your variables has a lot of missing data because participants didn't answer that question on your survey? What if there isn't much variation in the gender of your sample? These are things you'll learn through univariate analysis.
Quantitative Data: Bivariate Analysis
Did you know that ice cream causes shark attacks? It's true! When ice cream sales go up in the summer, so does the rate of shark attacks. So you'd better put down that ice cream cone, unless you want to make yourself look more delicious to a shark.
Ok, so it's quite obviously not true that ice cream causes shark attacks. But if you looked at these two variables and how they're related, you'd notice that during times of the year with high ice cream sales, there are also the most shark attacks. Despite the fact that the conclusion we drew about the relationship was wrong, it's nonetheless true that these two variables appear related, and researchers figured that out through the use of bivariate analysis. (You will learn about correlation versus causation in Chapter 8.)
Bivariate analysis consists of a group of statistical techniques that examine the association between two variables. We could look at how anti-depressant medications and appetite are related, whether there is a relation between having a pet and emotional well-being, or if a policy-maker's level of education is related to how they vote on bills related to environmental issues.
Bivariate analysis forms the foundation of multivariate analysis, which we don't get to in this book. All you really need to know here is that there are steps beyond bivariate analysis, which you've undoubtedly seen in scholarly literature already! But before we can move forward with multivariate analysis, we need to understand the associations between the variables in our study.
[MADE THIS UP] Throughout your PhD program, you will learn more about quantitative data analysis techniques. Hopefully this section has provided you with some initial insights into how data is analyzed, and the importance of creating a data analysis plan prior to collecting data. Next, we will discuss some basic strategies for creating a qualitative data analysis plan.
Qualitative Data: Management
Qualitative Data: Analysis
There are many different types of qualitative data, including transcripts of interviews and focus groups, observational data, documents and other artifacts, and more. Your qualitative data analysis plan should be anchored in the type of data collected and the purpose of your study. Qualitative research can serve a range of purposes. Below is a brief list of general purposes we might consider when using a qualitative approach.
-
-
- Are you trying to understand how a particular group is affected by an issue?
- Are you trying to uncover how people arrive at a decision in a given situation?
- Are you trying to examine different points of view on the impact of a recent event?
- Are you trying to summarize how people understand or make sense of a condition?
- Are you trying to describe the needs of your target population?
-
If you don't see the general aim of your research question reflected in one of these areas, don't fret! This is only a small sampling of what you might be trying to accomplish with your qualitative study. Whatever your aim, you need to have a plan for what you will do once you have collected your data.
Iterative or linear
Some qualitative research is linear, meaning it follows more of a traditionally quantitative process: create a plan, gather data, and analyze data; each step is completed before we proceed to the next. You can think of this like how information is presented in this book. We discuss each topic, one after another.
However, many times qualitative research is iterative, or evolving in cycles. An iterative approach means that once we begin collecting data, we also begin analyzing data as it is coming in. This early and ongoing analysis of our (incomplete) data then impacts our continued planning, data gathering and future analysis. Again, coming back to this book, while it may be written linear, we hope that you engage with it iteratively as you design and conduct your own research. By this we mean that you will revisit previous sections so you can understand how they fit together and you are in continuous process of building and revising how you think about the concepts you are learning about.
As you may have guessed, there are benefits and challenges to both linear and iterative approaches. A linear approach is much more straightforward, each step being fairly defined. However, linear research being more defined and rigid also presents certain challenges. A linear approach assumes that we know what we need to ask or look for at the very beginning of data collection, which often is not the case.
With iterative research, we have more flexibility to adapt our approach as we learn new things. We still need to keep our approach systematic and organized, however, so that our work doesn't become a free-for-all. As we adapt, we do not want to stray too far from the original premise of our study. It's also important to remember with an iterative approach that we may risk ethical concerns if our work extends beyond the original boundaries of our informed consent and institutional review board agreement (IRB; see Chapter 6 for more on IRBs). If you feel that you do need to modify your original research plan in a significant way as you learn more about the topic, you can submit an addendum to modify your original application that was submitted. Make sure to keep detailed notes of the decisions that you are making and what is informing these choices. This helps to support transparency and your credibility throughout the research process.
Acquainting yourself with your data
As you begin your analysis, you need to get to know your data. This often means reading through your data prior to any attempt at breaking it apart and labeling it. You might read through a couple of times, in fact. This helps give you a more comprehensive feel for each piece of data and the data as a whole, again, before you start to break it down into smaller units or deconstruct it. This is especially important if others assisted us in the data collection process. We often gather data as part of team and everyone involved in the analysis needs to be very familiar with all of the data.

Capturing your emerging understanding of the data
During your reviewing you will start to develop and evolve your understanding of what the data means. Coding is a part of the qualitative data analysis process where we begin to interpret and assign meaning to the data. It represents one of the first steps as we begin to filter the data through our own subjective lens as the researcher. This understanding of the data should be dynamic and flexible, but you want to have a way to capture this understanding as it evolves. You may include this as part of your qualitative codebook where you are tracking the main ideas that are emerging and what they mean. Figure 2.2 is an example of how your thinking might change about a code and how you can go about capturing it.
| Date | Code Lable | Explanations |
| 6/18/18 | Experience of wellness | This code captures the different ways people describe wellness in their lives |
| 6/22/18 | Understanding of wellness | Changed the label of this code slightly to reflect that many participants emphasize the cognitive aspect of how they understand wellness—how they think about it in their lives, not only the act of 'experiencing it'. This understanding seems like a precursor to experiencing. An evolving sense of how you think about wellness in your life. |
| 6/25/18 | Wellness experienced by developing personal awareness | A broader understanding of this category is developing. It involves building a personalized understanding of what makes up wellness in each person's life and the role that they play in maintaining it. Participants have emphasized that this is a dynamic, personal and onging process of uncovering their own intimate understanding of wellness. They describe having to experiment, explore, and reflect to develop this awareness. |
There are a variety of different approaches to qualitative analysis, including thematic analysis, content analysis, grounded theory, phenomenology, photovoice, and more. The specific steps you will take to code your qualitative data, and to generate themes from these codes, will vary based on the analytic strategy you are employing. In designing your qualitative study, you would identify an analytical approach as you plan out your project. The one you select would depend on the type of data you have and what you want to accomplish with it.
Key Takeaways
- Getting organized at the beginning of your project with a data analysis plan will help keep you on track. Data analysis plans should include your research question, a description of your data, and a step-by-step outline of what you're going to do with it. [chapter 14.1]
- Be flexible with your data analysis plan—sometimes data surprises us and we have to adjust the statistical tests we are using. [chapter 14.1]
- Always make a data dictionary or, if using secondary data, get a copy of the data dictionary so you (or someone else) can understand the basics of your data. [chapter 14.1]
- Bivariate analysis is a group of statistical techniques that examine the relationship between two variables. [chapter 15.1]
- You need to conduct bivariate analyses before you can begin to draw conclusions from your data, including in future multivariate analyses. [chapter 15.1]
- Qualitative research analysis requires preparation and careful planning. You will need to take time to familiarize yourself with the data in a general sense before you begin analyzing. [chapter 19.3]
- The specific steps you will take to code your qualitative data and generate final themes will depend on the qualitative analytic approach you select.
Exercises [from chapter 14.1]
TRACK 1 (IF YOU ARE CREATING A RESEARCH PROPOSAL FOR THIS CLASS)
- Make a data analysis plan for your project. Remember this should include your research question, a description of the data you will use, and a step-by-step outline of what you're going to do with your data once you have it, including statistical tests (non-relational and relational) that you plan to use. You can do this exercise whether you're using quantitative or qualitative data! The same principles apply.
- Make a data dictionary for the data you are proposing to collect as part of your study. You can use the example above as a template.
TRACK 2 (IF YOU AREN'T CREATING A RESEARCH PROPOSAL FOR THIS CLASS)
You are researching the impact of your city's recent harm reduction interventions for intravenous drug users (e.g., sterile injection kits, monitored use, overdose prevention, naloxone provision, etc.).
- Make a draft quantitative data analysis plan for your project. Remember this should include your research question, a description of the data you will use, and a step-by-step outline of what you're going to do with your data once you have it, including statistical tests (non-relational and relational) that you plan to use. It's okay if you don't yet have a complete idea of the types of statistical analyses you might use.
2.4 Critical considerations
Learning Objectives
Learners will be able to...
- Critique the traditional role of researchers and identify how action research addresses these issues
So far in this chapter, we have presented the steps of research projects as follows:
-
-
- Find a topic that is important to you and read about it.
- Pose a question that is important to the literature and to your community.
- Propose to use specific research methods and data analysis techniques to answer your question.
- Carry out your project and report the results.
-
These were depicted in more detail in Table 2.1 earlier in this chapter. There are important limitations to this approach. This section examines those problems and how to address them.
Whose knowledge is privileged?
First, let's critically examine your role as the researcher. Following along with the steps in a research project, you start studying the literature on your topic, find a place where you can add to scientific knowledge, and conduct your study. But why are you the person who gets to decide what is important? Just as clients are the experts on their lives, members of your target population are the experts on their lives. What does it mean for a group of people to be researched on, rather than researched with? How can we better respect the knowledge and self-determination of community members?

A different way of approaching your research project is to start by talking with members of the target population and those who are knowledgeable about that community. Perhaps there is a community-led organization you can partner with on a research project. The researcher's role in this case would be more similar to a consultant, someone with specialized knowledge about research who can help communities study problems they consider to be important. The social worker is a co-investigator, and community members are equal partners in the research project. Each has a type of knowledge—scientific expertise vs. lived experience—that should inform the research process.
The community focus highlights something important: they are localized. These projects can dedicate themselves to issues at a single agency or within a service area. With a local scope, researchers can bring about change in their community. This is the purpose behind action research.
Action research
Action research is research that is conducted for the purpose of creating social change. When engaging in action research, scholars collaborate with community stakeholders to conduct research that will be relevant to the community. Social workers who engage in action research don't just go it alone; instead, they collaborate with the people who are affected by the research at each stage in the process. Stakeholders, particularly those with the least power, should be consulted on the purpose of the research project, research questions, design, and reporting of results.
Action research also distinguishes itself from other research in that its purpose is to create change on an individual and community level. Kristin Esterberg puts it quite eloquently when she says, “At heart, all action researchers are concerned that research not simply contribute to knowledge but also lead to positive changes in people’s lives” (2002, p. 137).[2] Action research has multiple origins across the globe, including Kurt Lewin’s psychological experiments in the US and Paulo Friere’s literacy and education programs (Adelman, 1993; Reason, 1994).[3] Over the years, action research has become increasingly popular among scholars who wish for their work to have tangible outcomes that benefit the groups they study.
A traditional scientist might look at the literature or use their practice wisdom to formulate a question for quantitative or qualitative research, as we suggested earlier in this chapter. An action researcher, on the other hand, would consult with people in the target population and community to see what they believe the most pressing issues are and what their proposed solutions may be. In this way, action research flips traditional research on its head. Scientists are not the experts on the research topic. Instead, they are more like consultants who provide the tools and resources necessary for a target population to achieve their goals and to address social problems using social science research.
According to Healy (2001),[4] the assumptions of participatory-action research are that (a) oppression is caused by macro-level structures such as patriarchy and capitalism; (b) research should expose and confront the powerful; (c) researcher and participant relationships should be equal, with equitable distribution of research tasks and roles; and (d) research should result in consciousness-raising and collective action. Consistent with social work values, action research supports the self-determination of oppressed groups and privileges their voice and understanding through the conceptualization, design, data collection, data analysis, and dissemination processes of research. We will return to similar ideas in Part 4 of the textbook when we discuss qualitative research methods, though action research can certainly be used with quantitative research methods, as well.
Key Takeaways
- Traditionally, researchers did not consult target populations and communities prior to formulating a research question. Action research proposes a more community-engaged model in which researchers are consultants that help communities research topics of import to them.
Post- awareness check (Knowledge)
Based on what you know of your target population, what are a few ways to receive their “buy-in” to participate in your proposed research study?
Exercises
TRACK 1 (IF YOU ARE CREATING A RESEARCH PROPOSAL FOR THIS CLASS)
Apply the key concepts of action research to your project. How might you incorporate the perspectives and expertise of community members in your project?
TRACK 2 (IF YOU AREN'T CREATING A RESEARCH PROPOSAL FOR THIS CLASS)
You are researching the impact of your city's recent harm reduction interventions for intravenous drug users (e.g., sterile injection kits, monitored use, overdose prevention, naloxone provision, etc.).
- Apply the key concepts of action research to your project. How might you incorporate the perspectives and expertise of community members in your project?
The level that describes how data for variables are recorded. The level of measurement defines the type of operations can be conducted with your data. There are four levels: nominal, ordinal, interval, and ratio.
Referring to data analysis that doesn't examine how variables relate to each other.
a group of statistical techniques that examines the relationship between two variables
A research process where you create a plan, you gather your data, you analyze your data and each step is completed before you proceed to the next.
An iterative approach means that after planning and once we begin collecting data, we begin analyzing as data as it is coming in. This early analysis of our (incomplete) data, then impacts our planning, ongoing data gathering and future analysis as it progresses.
Part of the qualitative data analysis process where we begin to interpret and assign meaning to the data.
A document that we use to keep track of and define the codes that we have identified (or are using) in our qualitative data analysis.