22.4 Final product taking shape
Learning Objectives
Learners will be able to…
- Evaluate the various means of disseminating research and consider their applicability for your research project
- Determine appropriate building blocks for designing your qualitative research product
As we have discussed, qualitative research takes many forms. It should then come as no surprise that qualitative research products also come in many different packages. To help guide you as the final products of your research take shape, we will discuss some of the building blocks or elements that you are likely to include as tools in sharing your qualitative findings. These are the elements that will allow you to flesh out the details of your dissemination plan.
Building blocks
There are many building blocks that are at our disposal as we formulate our qualitative research product(s). Quantitative researchers have charts, graphs, tables, and narrative descriptions of numerical output. These tools allow the quantitative researcher to tell the story of their research with numbers. As qualitative researchers, we are tasked with telling the story of our research findings as well, but our tools look different. While this isn’t an exhaustive list of tools that are at our disposal as qualitative researchers, a number of commonly used elements in sharing qualitative findings are discussed here. Depending on your study design and the type of data you are working with, you may use one or some combination of the building blocks discussed below.
Themes
Themes are a very common element when presenting qualitative research findings. They may be called themes, but they may also go by other names: categories, dimensions, main ideas, etc. Themes offer the qualitative researcher a way to share ideas that emerged from your analysis that were shared by multiple participants or across multiple sources of data. They help us to distill the large amounts of qualitative data that we might be working with into more concise and manageable pieces of information that are more consumable for our audience. When integrating themes into your qualitative research product, you will want to offer your audience: the title of the theme (try to make this as specific/meaningful as possible), a brief description or definition of the theme, any accompanying dimensions or sub-themes that may be relevant, and examples (when appropriate).
Quotes
Quotes offer you the opportunity to share participants’ exact words with your audience. Of course, we can’t only rely on quotes, because we need to knit the information that is shared into one cohesive description of our findings and an endless list of quotes is unlikely to support this. Because of this, you will want to be judicious in selecting your quotes. Choose quotes that can stand on their own, best reflect the sentiment that is being captured by the theme or category of findings that you are discussing, and are likely to speak to and be understood by your audience. Quotes are a great way to help your findings come alive or to give them greater depth and significance. If you are using quotes, be sure to do so in a balanced manner—don’t only use them in some sections but not others, or use a large number to support one theme and only one or two for another. Finally, we often provide some brief demographic information in a parenthetical reference following a quote so our reader knows a little bit about the person who shared the information. This helps to provide some context for the quote.
Kohli and Pizarro (2016)[1] provide a good example of a qualitative study using quotes to exemplify their themes. In their study, they gathered data through short-answer questionnaires and in-depth interviews from racial-justice oriented teachers of Color. Their study explored the experiences and motivations of these teachers and the environments in which they worked. As you might guess, the words of the teacher-participants were especially powerful and the quotes provided in the results section were very informative and important in helping to fulfill the aim of the research study. Take a few minutes to review this article. Note how the authors provide a good amount of detail as to what each of the themes meant and how they used the quotes to demonstrate and support each theme. The quotes help bring the themes to life and anchor the results in the actual words of the participants (suggesting greater trustworthiness in the findings).
Figure 20.1 below offers a more extensive example of a theme being reported along with supporting quotes from a study conducted by Karabanow, Gurman, and Naylor (2012).[2] This study focused on the role of work activities in the lives of “Guatemalan street youth”. One of the important themes dealt with the intersection of work and identity for this group. In this example, brief quotes are used within the body of the description of the theme, and also longer quotes (full sentence(s)) to demonstrate important aspects of the description.
Work-based Identity: Creativity and Self-WorthWork, be it formal or informal, is beneficial for street youth not only for its financial benefits; but it helps youth to develop and rebuild their sense of self, to break away from destructive patterns, and ultimately contributes to any goals of exiting street life. Although many of the participants were aware that society viewed them as “lazy” or “useless,” they tended to see themselves as contributing members of society earning a valid and honest living. One participant said, “Well, a lot of people say, right? ‘The kid doesn’t want to do anything. Lazy kid’ right? And I wouldn’t like for people to say that about me, I’d rather do something so that they don’t say that I’m lazy. I want to be someone important in life.” This youth makes an interesting and important connection in this statement: he intrinsically associates “being someone” with “doing something” – he accepts the work-based identity that characterizes much of contemporary capitalist society. Many of the interviews subtly enforced this idea that in the informal economy, as in the formal economy, “who one is” is largely dependent on “what one does.” This demonstrates two important ideas: that street youth working in the informal sector are surprisingly ‘mainstream’ in their underlying beliefs and ambitions, and that work – be it formal or informal – plays a crucial role in allowing street youth, who have often dealt with trauma, isolation and low self-esteem, to rebuild a sense of self-worth. Many of the youth involved in this study dream of futures that echo traditional ideals: “to have my family all together…to have a home, or rather to have a nice house…to have a good job.” Several explained that this future is unattainable without hard work; many viewed those who “do nothing” as people who “waste their time” and think that “your life isn’t important to you.” On the other hand, those who value their lives and wish to attain a future of “peace and tranquility” must “look for work, that’s what needs to be done to have that future because if God allows it, in the future maybe you can find a partner, form a family and live peacefully.” For these youth, working – be it in the formal or informal sector – is essential to a feeling of “moving forward (seguir adelante).” This movement forward begins with self-esteem. Although the focus of this study was not the troubled pasts of the participants, many alluded to the difficulties they have faced and the various traumas that forced them onto the streets. Several of the youth noted that working was a catalyst in rebuilding positive feelings about oneself: one explained, “[When I’m working,] I feel happy, powerful…Sometimes when I go out to sell, I feel happy.” Another said: For me, when I’m working I feel free because I know that I’m earning my money in an honest way, not stealing right. Because when you’re stealing, you don’t feel free, right? Now when you’re working, you’re free, they can’t arrest you or anything because you’re selling. Now if you’re stealing and everything, you don’t feel free. But when you’re selling you feel free, out of danger. This feeling of being “free” or “powerful” rests on the idea that money is “earned” and not stolen; being able to earn money is associated with being “someone,” with being a valid and contributing member of society. In addition, work helps street youth to break away from destructive patterns. One participant spoke of her experience working full time at a café: For me, working means to be busy, to not just be there….It helps us meet other people, like new people and not to be always in the same scene. Because if you’re not busy, you feel really bored and you might want to, I don’t know, go back to the same thing you were in before…you even forget your problems because you’re keeping busy, you’re talking to other people, people who don’t know you. For this participant, a formal job was beneficial in that it supplied her with a daily routine and allowed her to interact with non-street people – these factors helped to separate her from the destructive lifestyle of the street, and helped her to “move forward.” Although these benefits are indeed most obvious with formal employment, many participants spoke of the positive effects of informal work as well, although to varying degrees. In Guatemala, since the informal economy accounts for over half of the country’s GNP, there is a wide range of under-the-table informal work available. These jobs frequently bring youth out of the street context and, therefore, provide similar benefits to a formal job, as described by the above participant. As to informal work that takes place on the street, such as hawking or car watching, the benefits of work are present, although to a different degree. Even hawking, for example, gives young workers a routine and a chance to interact with non-street people. As one young man continuously emphasized throughout his interview, “work helps you to keep your mind busy, to be in another mind-set, right? To not be thinking the same thing all the time: ‘Oh, drugs, drugs, drugs…’” As explained earlier, the code of the hawking world dictates that vendors cannot sell while high – just like a formal job, hawking helps to distance youth workers from some of their destructive street habits. However, as one participant thoughtfully noted, it is difficult to break these habits when one is still highly embroiled in street culture; “it depended on who was around me because if they were in the same problems as I was, I stopped working and I started doing the same as they did. And if I was surrounded by serious people, then I got my act together.” While certain types of informal work, like cleaning or waitressing, can help youth to distance themselves from destructive patterns, others, such as car watching and selling, may not do enough to separate youth from their peers. While the routine and activity do have positive effects, they often are not sufficient. Among some of the participants, there was the sentiment that informal work could function as a transition stage towards exiting the street; it could “change your life.” One participant said “there are lots of vendors who’ve gotten off the streets, if you make an effort, you go out to sell, you can get off the street. Like myself, when I was selling, I mean working, I got off the street, I went home and I managed to stay there quite a long time.” One might credit this success to several factors: first, the money the seller may have been able to save and accumulate; second, the routine of selling may have helped the seller to break from destructive patterns, such as drug use, and also prepared the seller for the demands of formal sector employment; and, thirdly, selling may have enabled the seller to develop the necessary confidence and sense of self to attempt exiting the street. |
Pictures or videos
If our data collection involves the use of photographs, drawings, videos or other artistic expression of participants or collection of artifacts, we may very well include selections of these in our dissemination of qualitative findings. In fact, if we failed to include these, it would seem a bit inauthentic. For the same reason we include quotes as direct representations of participants’ contributions, it is a good idea to provide direct reference to other visual forms of data that support or demonstrate our findings. We might incorporate narrative descriptions of these elements or quotes from participants that help to interpret their meaning. Integrating pictures and quotes is especially common if we are conducting a study using a Photovoice approach, as we discussed in Chapter 17, where a main goal of the research technique is to bring together participant generated visuals with collaborative interpretation.
Take some time to explore the website linked here. It is the webpage for The Philidelphia Collaborative for Health Equity’s PhotoVoice Exhibit Gallery and offers a good demonstration of research that brings together pictures and text.
Graphic or figure
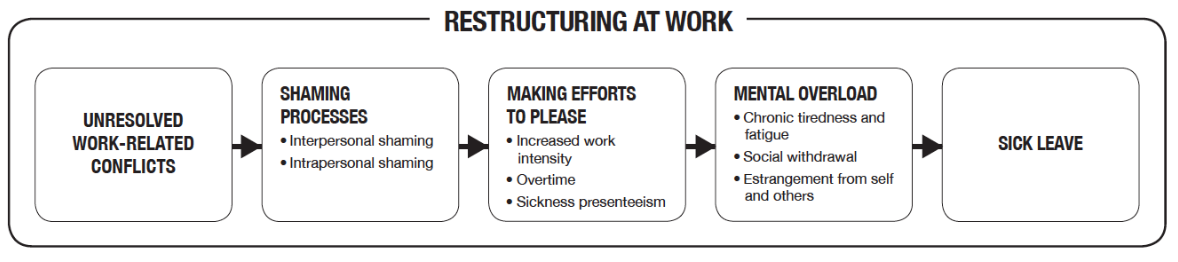
Qualitative researchers will often create a graphic or figure to visually reflect how the various pieces of your findings come together or relate to each other. Using a visual representation can be especially compelling for people who are visual learners. When you are using a visual representation, you will want to: label all elements clearly; include all the components or themes that are part of your findings; pay close attention to where you place and how you orient each element (as their spatial arrangement carries meaning); and finally, offer a brief but informative explanation that helps your reader to interpret your representation. A special subcategory of visual representation is process. These are especially helpful to lay out a sequential relationship within your findings or a model that has emerged out of your analysis. A process or model will show the ‘flow’ of ideas or knowledge in our findings, the logic of how one concept proceeds to the next and what each step of the model entails.
Noonan and colleagues (2004)[3] conducted a qualitative study that examined the career development of high achieving women with physical and sensory disabilities. Through the analysis of their interviews, they built a model of career development based on these women’s experiences with a figure that helps to conceptually illustrate the model. They place the ‘dyanmic self’ in the center, surrounded by a dotted (permeable) line, with a number of influences outside the line (i.e. family influences, disability impact, career attitudes and behaviors, sociopoltical context, developmental opportunities and social support) and arrows directed inward and outward between each influence and the dynamic self to demonstrate mutual influence/exchange between them. The image is included in the results section of their study and brings together “core categories” and demonstrates how they work together in the emergent theory or how they relate to each other. Because so many of our findings are dynamic, like Noonan and colleagues, showing interaction and exchange between ideas, figures can be especially helpful in conveying this as we share our results.
Composites
Going one step further than the graphic or figure discussed above, qualitative researchers may decide to combine and synthesize findings into one integrated representation. In the case of the graphic or figure, the individual elements still maintain their distinctiveness, but are brought together to reflect how they are related. In a composite however, rather than just showing that they are related (static), the audience actually gets to ‘see’ the elements interacting (dynamic). The integrated and interactive findings of a composite can take many forms. It might be a written narrative, such as a fictionalized case study that reflects of highlights the many aspects that emerged during analysis. It could be a poem, dance, painting or any other performance or medium. Ultimately, a composite offers an audience a meaningful and comprehensive expression of our findings. If you are choosing to utilize a composite, there is an underlying assumption that is conveyed: you are suggesting that the findings of your study are best understood holistically. By discussing each finding individually, they lose some of their potency or significance, so a composite is required to bring them together. As an example of a composite, consider that you are conducting research with a number of First Nations Peoples in Canada. After consulting with a number of Elders and learning about the importance of oral traditions and the significance of storytelling, you collaboratively determine that the best way to disseminate your findings will be to create and share a story as a means of presenting your research findings. The use of composites also assumes that the ‘truths’ revealed in our data can take many forms. The Transgender Youth Project hosted by the Mandala Center for Change, is an example of legislative theatre combining research, artistic expression, and political advocacy and a good example of action-oriented research.
Counts
While you haven’t heard much about numbers in our qualitative chapters, we’re going to break with tradition and speak briefly about them here. For many qualitative projects we do include some numeric information in our final product(s), mostly in the way of counts. Counts usually show up in the way of frequency of demographic characteristics of our sample or characteristics regarding our artifacts, if they aren’t people. These may be included as a table or they may be integrated into the narrative we provide, but in either case, our goal in including this information is to offer the reader information so they can better understand who or what our sample is representing. The other time we sometimes include count information is in respect to the frequency and coverage of the themes or categories that are represented in our data. Frequency information about a theme can help the reader to know how often an idea came up in our analysis, while coverage can help them to know how widely dispersed this idea was (e.g. did nearly everyone mention this, or was it a small group of participants).
Key Takeaways
- There are a wide variety of means by which you can deliver your qualitative research to the public. Choose one that takes into account the various considerations that we have discussed above and also honors the ethical commitments that we outlined early in this chapter.
- Presenting qualitative research requires some amount of creativity. Utilize the building blocks discussed in this chapter to help you consider how to most authentically and effectively convey your message to a wider audience.
Exercises
- What means of delivery will you be choosing for your dissemination plan?
- What building blocks will best convey your qualitative results to your audience?
- Kohli, R., & Pizarro, M. (2016). Fighting to educate our own: Teachers of Color, relational accountability, and the struggle for racial justice. Equity & Excellence in Education, 49(1), 72-84. ↵
- Karabanow, J., Gurman, E., & Naylor, T. (2012). Street youth labor as an Expression of survival and self-worth. Critical Social Work, 13(2). ↵
- Noonan, B. M., Gallor, S. M., Hensler-McGinnis, N. F., Fassinger, R. E., Wang, S., & Goodman, J. (2004). Challenge and success: A Qualitative study of the career development of highly achieving women with physical and sensory disabilities. Journal of Counseling Psychology, 51(1), 68. ↵
- Ede, L., & Starrin, B. (2014). Unresolved conflicts and shaming processes: risk factors for long-term sick leave for mental-health reasons. Nordic Journal of Social Research, 5, 39-54. ↵
Trustworthiness is a quality reflected by qualitative research that is conducted in a credible way; a way that should produce confidence in its findings.