12.4 Bias and cultural considerations
Learning Objectives
Learners will be able to…
- Identify the logic behind survey design as it relates to nomothetic causal explanations and quantitative methods
- Discuss sources of bias and error in surveys
- Apply criticisms of survey design to ensure more equitable research
The logic of survey design
It’s helpful to spell out the underlying logic behind survey design and how well it meets the criteria for nomothetic causal explanations. Because we are trying to isolate the association between our dependent and independent variable, we must try to control for as many possible confounding factors as possible. Researchers using survey design do this in multiple ways:
- Using well-established, valid, and reliable measures of key variables, including triangulating variables using multiple measures
- Measuring control variables and including them in their statistical analysis
- Avoiding biased wording, presentation, or procedures that might influence the sample to respond differently
- Pilot testing questionnaires, preferably with people similar to the sample
In other words, survey researchers go through a lot of trouble to make sure they are not the ones causing the changes they observe in their study. Of course, every study falls a little short of this ideal bias-free design, and some studies fall far short of it. This section is all about how bias and error can inhibit the ability of survey results to meaningfully tell us about causal relationships in the real world.
Bias in questionnaires, questions, and response options
[SOME OF THE FOLLOWING CONTENT MAY BELONG IN THE MEASUREMENT CHAPTER, FIGURE OUT HOW BEST TO ORGANIZE SO THAT MEASUREMENT CONCERNS ARE IN THAT CHAPTER WHILE CONCERNS RELATED SPECIFIC TO SURVEY DESIGN ARE IN THIS CHAPTER; I’M THINKING THERE COULD BE A BRIEF “RECALL THE TYPES OF MEASUREMENT BIAS/ERROR WE DISCUSSED IN CHAPTER xx AND THEN MOVE ON TO THE OTHER BIASES]
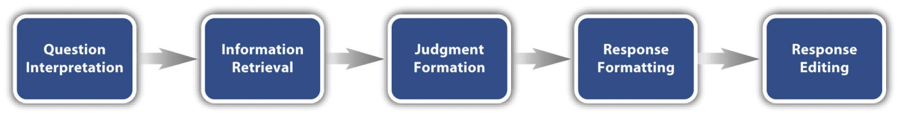
The use of surveys is based on methodological assumptions common to research in the postpositivist paradigm. Figure 12.1 presents a model the methodological assumptions behind survey design—what researchers assume is the cognitive processes that people engage in when responding to a survey item (Sudman, Bradburn, & Schwarz, 1996).[1] Respondents must interpret the question, retrieve relevant information from memory, form a tentative judgment, convert the tentative judgment into one of the response options provided (e.g., a rating on a 1-to-7 scale), and finally edit their response as necessary.
Consider, for example, the following questionnaire item:
- How many alcoholic drinks do you consume in a typical day?
-
- a lot more than average
- somewhat more than average
- average
- somewhat less than average
- much less than average
Although this item at first seems straightforward, it poses several difficulties for respondents. First, they must interpret the question. For example, they must decide whether “alcoholic drinks” include beer and wine (as opposed to just hard liquor) and whether a “typical day” is a typical weekday, typical weekend day, or both. Even though Chang and Krosnick (2003)[2] found that asking about “typical” behavior has been shown to be more valid than asking about “past” behavior, their study compared “typical week” to “past week” and may be different when considering typical weekdays or weekend days).
Once respondents have interpreted the question, they must retrieve relevant information from memory to answer it. But what information should they retrieve, and how should they go about retrieving it? They might think vaguely about some recent occasions on which they drank alcohol, they might carefully try to recall and count the number of alcoholic drinks they consumed last week, or they might retrieve some existing beliefs that they have about themselves (e.g., “I am not much of a drinker”). Then they must use this information to arrive at a tentative judgment about how many alcoholic drinks they consume in a typical day. For example, this mental calculation might mean dividing the number of alcoholic drinks they consumed last week by seven to come up with an average number per day. Then they must format this tentative answer in terms of the response options actually provided. In this case, the options pose additional problems of interpretation. For example, what does “average” mean, and what would count as “somewhat more” than average? Finally, they must decide whether they want to report the response they have come up with or whether they want to edit it in some way. For example, if they believe that they drink a lot more than average, they might not want to report that for fear of looking bad in the eyes of the researcher, so instead, they may opt to select the “somewhat more than average” response option.
At first glance, this question is clearly worded and includes a set of mutually exclusive, exhaustive, and balanced response options. However, it is difficult to follow the logic of what is truly being asked. Again, this complexity can lead to unintended influences on respondents’ answers. Confounds like this are often referred to as context effects because they are not related to the content of the item but to the context in which the item appears (Schwarz & Strack, 1990).[3] For example, there is an item-order effect when the order in which the items are presented affects people’s responses. One item can change how participants interpret a later item or change the information that they retrieve to respond to later items. For example, researcher Fritz Strack and his colleagues asked college students about both their general life satisfaction and their dating frequency (Strack, Martin, & Schwarz, 1988).[4] When the life satisfaction item came first, the correlation between the two was only −.12, suggesting that the two variables are only weakly related. But when the dating frequency item came first, the correlation between the two was +.66, suggesting that those who date more have a strong tendency to be more satisfied with their lives. Reporting the dating frequency first made that information more accessible in memory so that they were more likely to base their life satisfaction rating on it.
The response options provided can also have unintended effects on people’s responses (Schwarz, 1999).[5] For example, when people are asked how often they are “really irritated” and given response options ranging from “less than once a year” to “more than once a month,” they tend to think of major irritations and report being irritated infrequently. But when they are given response options ranging from “less than once a day” to “several times a month,” they tend to think of minor irritations and report being irritated frequently. People also tend to assume that middle response options represent what is normal or typical. So if they think of themselves as normal or typical, they tend to choose middle response options (i.e., fence-sitting). For example, people are likely to report watching more television when the response options are centered on a middle option of 4 hours than when centered on a middle option of 2 hours. To mitigate against order effects, rotate questions and response items when there is no natural order. Counterbalancing or randomizing the order of presentation of the questions in online surveys are good practices for survey questions and can reduce response order effects that show that among undecided voters, the first candidate listed in a ballot receives a 2.5% boost simply by virtue of being listed first![6]
Other context effects that can confound the causal relationship under examination in a survey include social desirability bias, recall bias, and common method bias. As we discussed in Chapter 10, social desirability bias occurs when we create questions that lead respondents to answer in ways that don’t reflect their genuine thoughts or feelings to avoid being perceived negatively. With negative questions such as, “do you think that your project team is dysfunctional?”, “is there a lot of office politics in your workplace?”, or “have you ever illegally downloaded music files from the Internet?”, the researcher may not get truthful responses. This tendency among respondents to “spin the truth” in order to portray themselves in a socially desirable manner is called social desirability bias, which hurts the validity of responses obtained from survey research. There is practically no way of overcoming social desirability bias in a questionnaire survey outside of wording questions using nonjudgmental language. However, in a quantitative interview, a researcher may be able to spot inconsistent answers and ask probing questions or use personal observations to supplement respondents’ comments.
As you can see, participants’ responses to survey questions often depend on their motivation, memory, and ability to respond. Particularly when dealing with events that happened in the distant past, respondents may not adequately remember their own motivations or behaviors, or perhaps their memory of such events may have evolved with time and are no longer retrievable. This phenomenon is know as recall bias. For instance, if a respondent is asked to describe their utilization of computer technology one year ago, their response may not be accurate due to difficulties with recall. One possible way of overcoming the recall bias is by anchoring the respondent’s memory in specific events as they happened, rather than asking them to recall their perceptions and motivations from memory.

Response Rate
The percentage or proportion of members of a sample who respond to a questionnaire is the response rate. Response rates have been declining for a long time. It’s rare that 100% of your sampled population will reply to your questionnaire. There are multiple factors that impact respondents’ ability to respond. Respondents could be busy with competing priorities, they have recently heard of scams that are happening in the area, have received too many robocalls and/or they may think that their confidentiality is not protected. With these known concerns, a researcher should tailor their recruitment measures to fit their desired population to increase the likelihood of getting responses. A researcher usually has a desired or anticipated response rate to run their desired statistical analysis. It is recommended to start with a large sample size because the response rate may be low.
The lower the response rate, the lower the likelihood that the sample is representative of the overall population; however, it is not impossible. A random sample taken from your randomly selected sample should still produce a randomized data report (National Social Norms Center, 2014)[7][8]. Just because there is a small response rate doesn’t mean its not representative. A researcher can investigate this by locating a known fact about their population (i.e., race or gender) and compare to their sample to assess if there is a “reasonably close match”. Reasonable is defined as what the researcher is comfortable with to move forward with their study.
A few examples of low response rates that still yielded a representative sample to the greater population are as follows:
One early example of a finding was reported by Visser, Krosnick, Marquette and Curtin (2000)[9] who showed that surveys with lower response rates (near 20%) yielded more accurate measurements than did surveys with higher response rates (near 60 or 70%). In another study, Keeter et al. (2006)[10] compared results of a 5-day survey employing the Pew Research Center’s usual methodology (with a 25% response rate) with results from a more rigorous survey conducted over a much longer field period and achieving a higher response rate of 50%. In 77 out of 84 comparisons, the two surveys yielded results that were statistically indistinguishable. Among the items that manifested significant differences across the two surveys, the differences in proportions of people giving a particular answer ranged from 4 percentage points to 8 percentage points.
A study by Curtin et al. (2000)[11] tested the effect of lower response rates on estimates of the Index of Consumer Sentiment (ICS). They assessed the impact of excluding respondents who initially refused to cooperate (which reduces the response rate 5–10 percentage points), respondents who required more than five calls to complete the interview (reducing the response rate about 25 percentage points), and those who required more than two calls (a reduction of about 50 percentage points). They found no effect of excluding these respondent groups on estimates of the ICS using monthly samples of hundreds of respondents. For yearly estimates, based on thousands of respondents, the exclusion of people who required more calls (though not of initial refusers) had a very small one.
Holbrook et al. (2005)[12] assessed whether lower response rates are associated with less unweighted demographic representativeness of a sample. By examining the results of 81 national surveys with response rates varying from 5 percent to 54 percent, they found that surveys with much lower response rates decreased demographic representativeness within the range examined, but not by much.
Though there is not a clear answer on what constitutes a good response rate, a researcher may want to consider the following when accepting the results and how this may impact their field of practice.
- Are these results believable? We all know how influential perceptions are. Will your audience believe that your survey data truly represents them?
- Have I considered the subgroups of my population? A researcher may have to plan on smaller scale surveys specifically for those groups, if they want to track changes in perception, use, and negative outcomes for those high-risk groups.
- Bias: the lower the response rate, the more chance that the respondent group is biased in some way. It can make longitudinal differences particularly difficult to interpret: If there is a change from the previous survey years, is that a real change or due to some bias in the response group (particularly if the respondents are not representative in terms of exposure to the intervention or risk).
- Do I have a demographic representativeness? Even with a high response rate, it is important for a researcher to still consider if there was a response from specific groups within their responses (i.e., race, gender, age)?
Bias in recruitment and response to surveys
So far, we have discussed errors that researchers make when they design questionnaires that accidentally influence participants to respond one way or another. However, even well designed questionnaires can produce biased results when administered to survey respondents because of the biases in who actually responds to your survey.
Survey research is notorious for its low response rates. A response rate of 15-20% is typical in a mail survey, even after two or three reminders. If the majority of the targeted respondents fail to respond to a survey, then a legitimate concern is whether non-respondents are not responding due to a systematic reason, which may raise questions about the validity and generalizability of the study’s results, especially as this relates to the representativeness of the sample. This is known as non-response bias. For instance, dissatisfied customers tend to be more vocal about their experience than satisfied customers, and are therefore more likely to respond to satisfaction questionnaires. Hence, any respondent sample is likely to have a higher proportion of dissatisfied customers than the underlying population from which it is drawn.[13] In this instance, the results would not be generalizable beyond this one biased sample. Here are several strategies for addressing non-response bias:
- Advance notification: A short letter sent in advance to the targeted respondents soliciting their participation in an upcoming survey can prepare them and improve likelihood of response. The letter should state the purpose and importance of the study, mode of data collection (e.g., via a phone call, a survey form in the mail, etc.), and appreciation for their cooperation. A variation of this technique may request the respondent to return a postage-paid postcard indicating whether or not they are willing to participate in the study.
- Ensuring that content is relevant: If a survey examines issues of relevance or importance to respondents, then they are more likely to respond.
- Creating a respondent-friendly questionnaire: Shorter survey questionnaires tend to elicit higher response rates than longer questionnaires. Furthermore, questions that are clear, inoffensive, and easy to respond to tend to get higher response rates.
- Having the project endorsed: For organizational surveys, it helps to gain endorsement from a senior executive attesting to the importance of the study to the organization. Such endorsements can be in the form of a cover letter or a letter of introduction, which can improve the researcher’s credibility in the eyes of the respondents.
- Providing follow-up requests: Multiple follow-up requests may coax some non-respondents to respond, even if their responses are late.
- Ensuring that interviewers are properly trained: Response rates for interviews can be improved with skilled interviewers trained on how to request interviews, use computerized dialing techniques to identify potential respondents, and schedule callbacks for respondents who could not be reached.
- Providing incentives: Response rates, at least with certain populations, may increase with the use of incentives in the form of cash or gift cards, giveaways such as pens or stress balls, entry into a lottery, draw or contest, discount coupons, the promise of contribution to charity, and so forth.
- Providing non-monetary incentives: Organizations in particular are more prone to respond to non-monetary incentives than financial incentives. An example of a non-monetary incentive can include sharing trainings and other resources based on the results of a project with a key stakeholder.
- Making participants fully aware of confidentiality and privacy: Finally, assurances that respondents’ private data or responses will not fall into the hands of any third party may help improve response rates.
Nonresponse bias impairs the ability of the researcher to generalize from the total number of respondents in the sample to the overall sampling frame. Of course, this assumes that the sampling frame is itself representative and generalizable to the larger target population. Sampling bias is present when the people in our sampling frame or the approach we use to sample them results in a sample that does not represent our population in some way. Telephone surveys conducted by calling a random sample of publicly available telephone numbers will systematically exclude people with unlisted telephone numbers, mobile phone numbers, and will include a disproportionate number of respondents who have land-line telephone service and stay home during much of the day, such as people who are unemployed, disabled, or of advanced age. Likewise, online surveys tend to include a disproportionate number of students and younger people who are more digitally connected, and systematically exclude people with limited or no access to computers or the Internet, such as the poor and the elderly. A different kind of sampling bias relates to generalizing from key informants to a target population, such as asking teachers (or parents) about the academic learning of their students (or children) or asking CEOs about operational details in their company. These sampling frames may provide a clearer picture of what key informants think and feel, rather than the target population.

Common Method Bias
Cross-sectional and retrospective surveys are particularly vulnerable to recall bias as well as common method bias. Common method bias can occur when measuring both the independent and dependent variables at the same time from the same person using the same instrument. For example, the fact that subjects are asked to report their own perceptions or impressions on two or more constructs in the same survey is likely to produce spurious correlations among the items measuring these constructs owing to response styles, social desirability, priming effects which are independent from the true correlations among the constructs being measured. In such cases, the phenomenon under investigation may not be adequately separated from measurement artifacts. Statistical tests such as Harmon’s single-factor test or Lindell and Whitney’s (2001)[14] market variable technique are available to test for common method bias (Podsakoff et al. 2003),[15],
Common method bias can be potentially avoided if the independent and dependent variables are measured at different points in time, using a longitudinal survey design, or if these variables are measured using different data sources, such as medical or student records rather than self-report questionnaires. Phillip Podsakoff et al. (2003)[16] made the following recommendations:
- Separate the independent and dependent variables temporarily by creating a short time lag between the measurements.
- Create an interesting study to separate the IV and DV psychologically such that the respondents may not perceive the measurement of the IV to be related or connected to the DV.
- Proximal technology is when a researcher separates the measure under which respondents complete the measurement of the IV and DV. For example, in a survey question, the researcher can use a Likert scale for the IV and a semantic differential for the DV. The goal is to reduce measure association.
- Measurement of the IV and DV can be obtained from different sources.
Cultural bias (provide a definition: a prejudice or difference in viewpoint which favors one culture over another.)
The acknowledgement that most research in social work and other adjacent fields is overwhelmingly based on so-called WEIRD (Western, educated, industrialized, rich and democratic) populations—a topic we discussed in Chapter 10—has given way to intensified research funding, publication, and visibility of collaborative cross-cultural studies across the social sciences that expand the geographical range of study populations. Many of the so-called non-WEIRD communities who increasingly participate in research are Indigenous, from low- and middle-income countries in the global South, live in post-colonial contexts, and/or are marginalized within their political systems, revealing and reproducing power differentials between researchers and researched (Whiteford & Trotter, 2008).[17] Cross-cultural research has historically been rooted in racist, capitalist ideas and motivations (Gordon, 1991).[18] Scholars have long debated whether research aiming to standardize cross-cultural measurements and analysis is tacitly engaged and/or continues to be rooted in colonial and imperialist practices (Kline et al., 2018; Stearman, 1984).[19] Given this history, it is critical that scientists reflect upon these issues and be accountable to their participants and colleagues for their research practices. We argue that cross-cultural research be grounded in the recognition of the historical, political, sociological and cultural forces acting on the communities and individuals of focus. These perspectives are often contrasted with ‘science’; here we argue that they are necessary as a foundation for the study of human behavior.
We stress that our goal is not to review the literature on colonial or neo-colonial research practices, to provide a comprehensive primer on decolonizing approaches to field research, nor to identify or admonish past harms in these respects—harms to which many of the authors of this piece would readily admit. Furthermore, we acknowledge that we ourselves are writing from a place of privilege as researchers educated and trained in disciplines with colonial pasts and presents. Our goal is simply to help students understand the broader issues in cross-cultural studies for appropriate consideration of diverse communities and culturally appropriate methodologies for research projects.
Equivalence of measures across cultures
Data collection methods largely stemming from WEIRD intellectual traditions are being exported to a range of cultural contexts. This is often done with insufficient consideration of the translatability (e.g. equivalence or applicability) or implementation of such concepts and methods in different contexts, as already well documented (e.g., Hruschka et al., 2018).[20] For example, in a developmental psychology study conducted by Broesch and colleagues (2011),[21] the research team exported a task to examine the development and variability of self-recognition in children across cultures. Typically, this milestone is measured by surreptitiously placing a mark on a child’s forehead and allowing them to discover their reflective image and the mark in a mirror. While self-recognition in WEIRD contexts typically manifests in children by 18 months of age, the authors tested found that only 2 out of 82 children (aged 1–6 years) ‘passed’ the test by removing the mark using the reflected image. The authors’ interpretation of these results was that the test produced false negatives and instead measured implicit compliance to the local authority figure who placed the mark on the child. This raises the possibility that the mirror test may lack construct validity in cross-cultural contexts—in other words, that it may not measure the theoretical construct it was designed to measure.
As we discussed previously, survey researchers want to make sure everyone receives the same questionnaire, but how can we be sure everyone understands the questionnaire in the same way? Cultural equivalence means that a measure produces comparable data when employed in different cultural populations (Van de Vijver & Poortinga, 1992).[22] If concepts differ in meaning across cultures, cultural bias may better explain what is going on with your key variables better than your hypotheses. Cultural bias may result because of poor item translation, inappropriate content of items, and unstandardized procedures (Waltz et al., 2010).[23] Of particular importance is construct bias, or “when the construct measured is not identical across cultures or when behaviors that characterize the construct are not identical across cultures” (Meiring et al., 2005, p. 2)[24] Construct bias emerges when there is: a) disagreement about the appropriateness of content, b) inadequate sampling, c) underrepresentation of the construct, and d) incomplete overlap of the construct across cultures (Van de Vijver & Poortinga, 1992).[25]
Addressing cultural bias
To address these issues, we propose careful scrutiny of (a) study site selection, (b) community involvement and (c) culturally appropriate research methods. Particularly for those initiating collaborative cross-cultural projects, we focus here on pragmatic and implementable steps. It is important for researchers to be aware of these issues and assess for them in the strengths and limitations of your own study, though the degree to which you can feasibly implement some of these measures will be impaired by a lack of resources.
Study site selection
Researchers are increasingly interested in cross-cultural research applicable outside of WEIRD contexts., but this has sometimes led to an uncritical and haphazard inclusion of ‘non-WEIRD’ populations in cross-cultural research without further regard for why specific populations should be included (Barrett, 2020).[26] One particularly egregious example is the grouping of all non-Western populations as a comparative sample to the cultural West (i.e. the ‘West versus rest’ approach) is often unwittingly adopted by researchers performing cross-cultural research (Henrich, 2010).[27] Other researcher errors include the exoticization of particular cultures or viewing non-Western cultures as a window into the past rather than cultures that have co-evolved over time.
Thus, some of the cultural biases in survey research emerge when researchers fail to identify a clear theoretical justification for inclusion of any subpopulation—WEIRD or not—based on knowledge of the relevant cultural and/or environmental context (see Tucker, 2017[28] for a good example). For example, a researcher asking about satisfaction with daycare must acquire the relevant cultural and environmental knowledge about a daycare that caters exclusively to Orthodox Jewish families. Simply including this study site without doing appropriate background research and identifying a specific aspect of this cultural group that is of theoretical interest in your study (e.g., spirituality and parenthood) indicates a lack of rigor in research. It undercuts the validity and generalizability of your findings by introducing sources of cultural bias that are unexamined in your study.
Sampling decisions are also important as they involve unique ethical and social challenges. For example, foreign researchers (as sources of power, information and resources) represent both opportunities for and threats to community members. These relationships are often complicated by power differentials due to unequal access to wealth, education and historical legacies of colonization. As such, it is important that investigators are alert to the possible bias among individuals who initially interact with researchers, to the potential negative consequences for those excluded, and to the (often unspoken) power dynamics between the researcher and their study participants (as well as among and between study participants).
We suggest that a necessary first step is to carefully consult existing resources outlining best practices for ethical principles of research before engaging in cross-cultural research. Many of these resources have been developed over years of dialogue in various academic and professional societies (e.g. American Anthropological Association, International Association for Cross Cultural Psychology, International Union of Psychological Science). Furthermore, communities themselves are developing and launching research-based codes of ethics and providing carefully curated open-access materials such as those from the Indigenous Peoples’ Health Research Centre, often written in consultation with ethicists in low- to middle-income countries (see Schroeder et al., 2019).[29]
Community involvement
Too often researchers engage in ‘extractive’ research, whereby a researcher selects a study community and collects the necessary data to exclusively further their own scientific and/or professional goals without benefiting the community. This reflects a long history of colonialism in social science. Extractive methods lead to methodological flaws and alienate participants from the scientific process, poisoning the well of scientific knowledge on a macro level. Many researchers are associated with institutions tainted with colonial, racist and sexist histories, sentiments and in some instances perpetuating into the present. Much cross-cultural research is carried out in former or contemporary colonies, and in the colonial language. Explicit and implicit power differentials create ethical challenges that can be acknowledged by researchers and in the design of their study (see Schuller, 2010[30] for an example in which the power and politics of various roles played by researchers).
An understanding of cultural norms may ensure that data collection and questionnaire design are culturally and linguistically relevant. This can be achieved by implementing several complementary strategies. A first step may be to collaborate with members of the study community to check the relevance of the instruments being used. Incorporating perspectives from the study community from the outset can reduce the likelihood of making scientific errors in measurement and inference (First Nations Information Governance Centre, 2014).[31]
An additional approach is to use mixed methods in data collection, such that each method ‘checks’ the data collected using the other methods. A recent paper by Fisher and Poortinga (2018)[32] provides suggestions for a rigorous methodological approach to conducting cross-cultural comparative psychology, underscoring the importance of using multiple methods with an eye towards a convergence of evidence. A mixed-method approach can incorporate a variety of qualitative methods over and on top of a quantitative survey including open-ended questions, focus groups, and interviews.
Research design and methods
It is critical that researchers translate the language, technological references and stimuli as well as examine the underlying cultural context of the original method for assumptions that rely upon WEIRD epistemologies (Hrushcka, 2020).[33] This extends to non-complex visual aids, attempting to ensure that even scales measure what the researcher is intending (see Purzycki and Lang, 2019[34] for discussion on the use of a popular economic experiment in small-scale societies).
For more information on assessing cultural equivalence, consult this free training from RTI International, a well-regarded non-profit research firm, entitled “The essential role of language in survey design” and this free training from the Center for Capacity Building in Survey Methods and Statistics entitled “Questionnaire design: For surveys in 3MC (multinational, multiregional, and multi cultural) contexts. These trainings guide researchers using survey design through the details of evaluating and writing survey questions using culturally sensitive language. Moreover, if you are planning to conduct cross-cultural research, you should consult this guide for assessing measurement equivalency and bias across cultures, as well.
Key Takeaways
- Bias can come from both how questionnaire items are presented to participants as well as how participants are recruited and respond to surveys.
- Cultural bias emerges from the differences in how people think and behave across cultures.
- Cross-cultural research requires a theoretically-informed sampling approach, evaluating measurement equivalency across cultures, and generalizing findings with caution.
Post-awareness check (Emotion)
How have the contents of this chapter impacted your level of motivation to continue to research your target population? Should you make any adjustments to your research question or study design?
Exercises
TRACK 1 (IF YOU ARE CREATING A RESEARCH PROPOSAL FOR THIS CLASS):
Review your questionnaire and assess it for potential sources of bias.
- Make any changes to your questionnaire (or sampling approach) you think would reduce the potential for bias in your study.
Create a first draft of your limitations section by identifying sources of bias in your survey.
- Write a bulleted list or paragraph or the potential sources of bias in your study.
- Remember that all studies, especially student-led studies, have limitations. To the extent you can address these limitations now and feasibly make changes, do so. But keep in mind that your goal should be more to correctly describe the bias in your study than to collect bias-free results. Ultimately, your study needs to get done!
TRACK 2 (IF YOU AREN’T CREATING A RESEARCH PROPOSAL FOR THIS CLASS):
You are interested in understanding more about the needs of unhoused individuals in rural communities, including how these needs vary based on demographic characteristics and personal identities.
- What types of bias might you encounter when attempting to answer your working research question using a cross-sectional survey design?
- What strategies might you employ to reduce the impact of these biases?
- Sudman, S., Bradburn, N. M., & Schwarz, N. (1996). Thinking about answers: The application of cognitive processes to survey methodology. San Francisco, CA: Jossey-Bass. ↵
- Chang, L., & Krosnick, J.A. (2003). Measuring the frequency of regular behaviors: Comparing the ‘typical week’ to the ‘past week’. Sociological Methodology, 33, 55-80. ↵
- Schwarz, N., & Strack, F. (1990). Context effects in attitude surveys: Applying cognitive theory to social research. In W. Stroebe & M. Hewstone (Eds.), European review of social psychology (Vol. 2, pp. 31–50). Chichester, UK: Wiley. ↵
- Strack, F., Martin, L. L., & Schwarz, N. (1988). Priming and communication: The social determinants of information use in judgments of life satisfaction. European Journal of Social Psychology, 18, 429–442. ↵
- Schwarz, N. (1999). Self-reports: How the questions shape the answers. American Psychologist, 54, 93–105. ↵
- Miller, J.M. & Krosnick, J.A. (1998). The impact of candidate name order on election outcomes. Public Opinion Quarterly, 62(3), 291-330. ↵
- null ↵
- National Social Norms Center. (2014). What is an acceptable response rate? https://socialnorms.org/what-is-an-acceptable-survey-response-rate/ ↵
- Visser, P.S., Krosnick, J.A., Marquette, J. & Curtin, M. (2000). Improving election forecasting: Allocation of undecided respondents, identification of likely voters, and response order effects. In P. Lavrakas & M. Traugott (Eds.). Election polls, the news media, and democracy. New York, NY: Chatham House. ↵
- Keeter, S., Kennedy, C., Dimock, M., Best, J., & Craighill, P. (2006). Gauging the impact of growing nonresponse on estimates from a national RDD telephone survey. Public Opinion Quarterly, 70(5), 759-779. https://doi.org/10.1093/poq/nfl035 ↵
- Curtin, R., Presser, S., & Singer, E. (2000). The effects of response rate changes on the Index of Consumer Sentiment. Public Opinion Quarterly, 64(4), 413-428. https://doi.org/10.1086/318638 ↵
- Holbrook, A. L., Krosnick, J., & Pfent, A. (2005). The causes and consequences of response rates in surveys by the news media and government contractor survey research firms. In M. Lepkowski, et al. (Eds.) Advances in Telephone Survey Methodology. https://doi.org/10.1002/9780470173404.ch23 ↵
- This is why my ratemyprofessor.com score is so low. Or that's what I tell myself. ↵
- Lindell, M. K., & Whitney, D. J. (2001). Accounting for common method variance in cross-sectional research designs. Journal of Applied Psychology, 86(1), 114. ↵
- Podsakoff, P. M., MacKenzie, S. B., Lee, J. Y., & Podsakoff, N. P. (2003). Common method biases in behavioral research: a critical review of the literature and recommended remedies. Journal of Applied Psychology, 88(5), 879. ↵
- Podsakoff, P. M., MacKenzie, S. B., Lee, J. Y., & Podsakoff, N. P. (2003). Common method biases in behavioral research: A critical review of the literature and recommended remedies. Journal of Applied Psychology, 88(5), 879–03. https://doi.apa.org/doiLanding?doi=10.1037%2F0021-9010.88.5.879 ↵
- Whiteford, L. M., & Trotter II, R. T. (2008). Ethics for anthropological research and practice. Waveland Press. ↵
- Gordon, E. T. (1991). Anthropology and liberation. In F V Harrison (ed.) Decolonizing anthropology: Moving further toward an anthropology for liberation (pp. 149-167). Arlington, VA: American Anthropological Association. ↵
- Kline, M. A., Shamsudheen, R., & Broesch, T. (2018). Variation is the universal: Making cultural evolution work in developmental psychology. Philosophical Transactions of the Royal Society B: Biological Sciences, 373(1743), 20170059. Stearman, A. M. (1984). The Yuquí connection: Another look at Sirionó deculturation. American Anthropologist, 86(3), 630-650. ↵
- Hruschka, D. J., Munira, S., Jesmin, K., Hackman, J., & Tiokhin, L. (2018). Learning from failures of protocol in cross-cultural research. Proceedings of the National Academy of Sciences, 115(45), 11428-11434. ↵
- Broesch, T., Callaghan, T., Henrich, J., Murphy, C., & Rochat, P. (2011). Cultural variations in children’s mirror self-recognition. Journal of Cross-Cultural Psychology, 42(6), 1018-1029. ↵
- Van de Vijver, F. J., & Poortinga, Y. H. (1992). Testing in culturally heterogeneous populations: When are cultural loadings undesirable?. European Journal of Psychological Assessment. ↵
- Waltz, C. F., Strickland, O. L., & Lenz, E. R. (Eds.). (2010). Measurement in nursing and health research (4th ed.). Springer. ↵
- Meiring, D., Van de Vijver, A. J. R., Rothmann, S., & Barrick, M. R. (2005). Construct, item and method bias of cognitive and personality tests in South Africa. SA Journal of Industrial Psychology, 31(1), 1-8. ↵
- Van de Vijver, F. J., & Poortinga, Y. H. (1992). Testing in culturally heterogeneous populations: When are cultural loadings undesirable?. European Journal of Psychological Assessment. ↵
- Barrett, H. C. (2020). Deciding what to observe: Thoughts for a post-WEIRD generation. Evolution and Human Behavior, 41(5), 445-453. ↵
- Henrich, J., Heine, S. J., & Norenzayan, A. (2010). Beyond WEIRD: Towards a broad-based behavioral science. Behavioral and Brain Sciences, 33(2-3), 111. ↵
- Tucker, B. (2017). From risk and time preferences to cultural models of causality: on the challenges and possibilities of field experiments, with examples from rural Southwestern Madagascar. Impulsivity, 61-114. ↵
- Schroeder, D., Chatfield, K., Singh, M., Chennells, R., & Herissone-Kelly, P. (2019). Equitable research partnerships: a global code of conduct to counter ethics dumping. Springer Nature. ↵
- Schuller, M. (2010). From activist to applied anthropologist to anthropologist? On the politics of collaboration. Practicing Anthropology, 32(1), 43-47. ↵
- First Nations Information Governance Centre. (2014). Ownership, control, access and possession (OCAP): The path to First Nations information governance. ↵
- Fischer, R., & Poortinga, Y. H. (2018). Addressing methodological challenges in culture-comparative research. Journal of Cross-Cultural Psychology, 49(5), 691-712. ↵
- Hruschka, D. J. (2020). What we look with” is as important as “What we look at. Evolution and Human Behavior, 41(5), 458-459. ↵
- Purzycki, B. G., & Lang, M. (2019). Identity fusion, outgroup relations, and sacrifice: a cross-cultural test. Cognition, 186, 1-6. ↵
unintended influences on respondents’ answers because they are not related to the content of the item but to the context in which the item appears.
when the order in which the items are presented affects people’s responses
Social desirability bias occurs when we create questions that lead respondents to answer in ways that don't reflect their genuine thoughts or feelings to avoid being perceived negatively.
When respondents have difficult providing accurate answers to questions due to the passage of time.
If the majority of the targeted respondents fail to respond to a survey, then a legitimate concern is whether non-respondents are not responding due to a systematic reason, which may raise questions about the validity of the study’s results, especially as this relates to the representativeness of the sample.
Sampling bias is present when our sampling process results in a sample that does not represent our population in some way.
Common method bias refers to the amount of spurious covariance shared between independent and dependent variables that are measured at the same point in time.
the concept that scores obtained from a measure are similar when employed in different cultural populations
spurious covariance between your independent and dependent variables that is in fact caused by systematic error introduced by culturally insensitive or incompetent research practices
"when the construct measured is not identical across cultures or when behaviors that characterize the construct are not identical across cultures" (Meiring et al., 2005, p. 2)