20.5 Data management: Keeping track of our data and our analysis
Learning Objectives
Learners will be able to…
- Explain how data management and data analysis in qualitative projects can present unique challenges or opportunities for demonstrating quality in the research process
- Plan for key elements to address or include in a data management plan that supports qualitative rigor in the study
Elements to think about
Once data collection begins, we need a plan for what we are going to do with it. As we talked about in our chapter devoted to qualitative data collection, this is often an important point of departure between quantitative and qualitative methods. Quantitative research tends to be much more sequential, meaning that first we collect all the data, then we analyze the data. If we didn’t do it this way, we wouldn’t know what numbers we are dealing with. However, with qualitative data, we are usually collecting and beginning to analyze our data simultaneously. This offers us a great opportunity to learn from our data as we are gathering it. However, it also means that if you don’t have a plan for how you are going to manage these dual processes of data collection and data analysis, you are going to get overwhelmed twice as fast! A rigorous process will have a clearly defined process for labeling and tracking your data artifacts, whether they are text documents (e.g. transcripts, newspaper clippings, advertisements), photos, videos, or audio recordings. These may be physical documents, but more often than not, they are electronic. In either case, a clear, documented labeling system is required. This becomes very important because you are going to need to come back to this artifact at some point during your analysis and you need to have a way of tracking it down. Let’s talk a bit more about this.
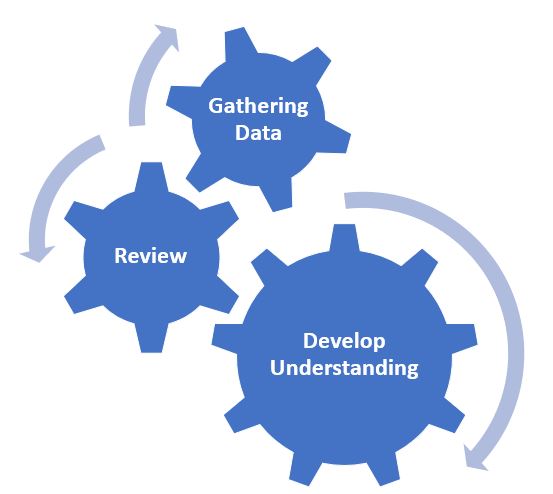
You were introduced to the term iterative process in our previous discussions about qualitative data analysis. As a reminder, an iterative process is one that involves repetition, so in the case of working with qualitative data, it means that we will be engaging in a repeating and evolving cycle of reviewing our data, noting our initial thoughts and reactions about what the data means, collecting more data, and going back to review the data again. Figure 19.1 depicts this iterative process. To adopt a rigorous approach to qualitative analysis, we need to think about how we will capture and document each point of this iterative process. This ishow we demonstrate transparency in our data analysis process, how we detail the work that we are doing as human instruments.
During this process, we need to consider:
- How will we capture our thoughts about the data, including what we are specifically responding to in the data?
- How do we introduce new data into this process?
- How do we record our evolving understanding of the data and what those changes are prompted by?
So we have already talked about the importance of labeling our artifacts, but each artifact is likely to contain many ideas. For instance, think about the many ideas that are shared in a single interview. Because of this, we need to also have a clear and standardized way of labeling smaller segments of data within each artifact that represent discrete or separate ideas. If you recall back to our analysis chapter, these labels are called units. You are likely to have many, many units in each artifact. Additionally, as suggested above, you need a way to capture your thought process as you respond to the data. This documentation is called memoing, a term you were introduced to in our analysis chapter. These various components, labeling your artifacts, labeling your units, and memoing, come together as you produce a rigorous plan for how you document your data analysis. Again, rigor here is closely associated with transparency. This means that you are using these tools to document a clear road map for how you got from your raw data to your findings. The term for this road map is an audit trail, and we will speak more about it in the next section. The test of this aspect of rigor becomes your ability to work backwards, or better yet, for someone else to work backwards. Could someone not connected with your project look at your findings, and using your audit trail, trace these ideas all the way back to specific points in your raw data? The term for this is having an external audit and will also be further explained below. If you can do this, we sometimes say that your findings are clearly “grounded in your data”.
What our plan for data management might look like.
If you are working with physical data, you will need a system of logging and storing your artifacts. In addition, as you break your artifacts down into units you may well be copying pieces of these artifacts onto small note cards or post-its that serve as your data units. These smaller units become easier to manipulate and move around as you think about what ideas go together and what they mean collectively. However, each of these smaller units need a label that links them back to their artifact. But why do I have to go through all this? Well, it isn’t just for the sake of transparency and being able to link your findings back to the original raw data, although that is certainly important. You also will likely reach a point in your analysis where themes are coming together and you are starting to make sense of things. When this occurs, you will have a pile of units from various artifacts under each of these themes. At this point you will want to know where the information in the units came from. If it was verbal data, you will want to know who said it or what source it came from. This offers us important information about the context of our findings and who/what they are connected to. We can’t determine this unless we have a good labeling system.
You will need to come up with a system that makes sense to you and fits for your data. As an example, I’m often working with transcripts from interviews or focus groups. As I am collecting my data, each transcript is numbered as I obtain it. Also, the transcripts themselves have continuous line numbers on them. When I start to break-up or deconstruct my data, each unit gets a label that consists of two numbers separated by a period. The number before the period is the transcript that the unit came from and the number after the period is the line number within that transcript so that I can find exactly where the information is. So, if I have a unit labeled 3.658, it means that this data can be found in my transcript labeled 3 and on line 658.
Now, I often use electronic versions of my transcripts when I break them up. As I showed in our data analysis chapter, I create an excel file where I can cut and paste the data units, their label, and the preliminary code I am assigning to this idea. I find excel useful because I can easily sort my data by codes and start to look for emerging themes. Furthermore, above I mentioned memoing, or recording my thoughts and responses to the data. I can easily do this in excel, by adding an additional column for memoing where I can put my thoughts/responses by a particular unit and date it, so I know when I was having that thought. Generally speaking, I find that excel makes it pretty easy for me to manipulate or move my data around while I’m making sense of it, while also documenting this. Of course, the qualitative data analysis software packages that I mentioned in our analysis chapter all have their own systems for activities such as assigning labels, coding, and memoing. And if you choose to use one of these, you will want to be well acquainted with how to do this before you start collecting data. That being said, you don’t need software or even excel to do this work. I know many qualitative researchers who prefer having physical data in front of them, allowing them to shift note cards around and more clearly visualize their emerging themes. If you elect for this, you just need to make sure you track the moves you are making and your thought process during the analysis. And be careful if you have a cat, mine would have a field day with piles of note cards left on my desk!
Key Takeaways
- Due to the dynamic and often iterative nature of qualitative research, we need to proactively consider how we will store and analyze our qualitative data, often at the same time we are collecting it.
- Whatever data management system we plan for, it needs to have consistent ways of documenting our evolving understanding of what our data mean. This documentation acts as an important bridge between our raw qualitative data and our qualitative research findings, helping to support rigor in our design.
An iterative approach means that after planning and once we begin collecting data, we begin analyzing as data as it is coming in. This early analysis of our (incomplete) data, then impacts our planning, ongoing data gathering and future analysis as it progresses.
The process of research is record and described in such a way that the steps the researcher took throughout the research process are clear.
discrete segments of data
Memoing is the act of recording your thoughts, reactions, quandaries as you are reviewing the data you are gathering.
Rigor is the process through which we demonstrate, to the best of our ability, that our research is empirically sound and reflects a scientific approach to knowledge building.
unprocessed data that researchers can analyze using quantitative and qualitative methods (e.g., responses to a survey or interview transcripts)
An audit trail is a system of documenting in qualitative research analysis that allows you to link your final results with your original raw data. Using an audit trail, an independent researcher should be able to start with your results and trace the research process backwards to the raw data. This helps to strengthen the trustworthiness of the research.
Having an objective person, someone not connected to your study, try to start with your findings and trace them back to your raw data using your audit trail. A tool to help demonstrate rigor in qualitative research.
Context is the circumstances surrounding an artifact, event, or experience.
A code is a label that we place on segment of data that seems to represent the main idea of that segment.
Part of the qualitative data analysis process where we begin to interpret and assign meaning to the data.