13.1 Writing effective survey questions and questionnaires
Learning Objectives
Learners will be able to…
- Describe some of the ways that survey questions might confuse respondents and how to word questions and responses clearly
- Create mutually exclusive, exhaustive, and balanced response options
- Define fence-sitting and floating
- Describe the considerations involved in constructing a well-designed questionnaire
- Discuss why pilot testing is important
In the previous chapter, we reviewed how researchers collect data using surveys. Guided by their sampling approach and research context, researchers should choose the survey approach that provides the most favorable tradeoffs in strengths and challenges. With this information in hand, researchers need to write their questionnaire and revise it before beginning data collection. Each method of delivery requires a questionnaire, but they vary a bit based on how they will be used by the researcher. Since phone surveys are read aloud, researchers will pay more attention to how the questionnaire sounds than how it looks. Online surveys can use advanced tools to require the completion of certain questions, present interactive questions and answers, and otherwise afford greater flexibility in how questionnaires are designed. As you read this chapter, consider how your method of delivery impacts the type of questionnaire you will design.

Start with operationalization
The first thing you need to do to write effective survey questions is identify what exactly you wish to know. As silly as it sounds to state what seems so completely obvious, we can’t stress enough how easy it is to forget to include important questions when designing a survey. Begin by looking at your research question and refreshing your memory of the operational definitions you developed for those variables from Chapter 11. You should have a pretty firm grasp of your operational definitions before starting the process of questionnaire design. You may have taken those operational definitions from other researchers’ methods, found established scales and indices for your measures, or created your own questions and answer options.
Exercises
TRACK 1 (IF YOU ARE CREATING A RESEARCH PROPOSAL FOR THIS CLASS)
STOP! Make sure you have a complete operational definition for the dependent and independent variables in your research question. A complete operational definition contains the variable being measured, the measure used, and how the researcher interprets the measure. Let’s make sure you have what you need from Chapter 11 to begin writing your questionnaire.
List all of the dependent and independent variables in your research question.
- It’s normal to have one dependent or independent variable. It’s also normal to have more than one of either.
- Make sure that your research question (and this list) contain all of the variables in your hypothesis. Your hypothesis should only include variables from you research question.
For each variable in your list:
- Write out the measure you will use (the specific questions and answers) for each variable.
- If you don’t have questions and answers finalized yet, write a first draft and revise it based on what you read in this section.
- If you are using a measure from another researcher, you should be able to write out all of the questions and answers associated with that measure. If you only have the name of a scale or a few questions, you need to access to the full text and some documentation on how to administer and interpret it before you can finish your questionnaire.
- Describe how you will use each measure to draw conclusions about the variable in the operational definition.
- For example, an interpretation might be “there are five 7-point Likert scale questions…point values are added across all five items for each participant…and scores below 10 indicate the participant has low self-esteem”
- Don’t introduce other variables into the mix here. All we are concerned with is how you will measure each variable by itself. The connection between variables is done using statistical tests, not operational definitions.
- Detail any validity or reliability issues uncovered by previous researchers using the same measures. If you have concerns about validity and reliability, note them, as well.
TRACK 2 (IF YOU AREN’T CREATING A RESEARCH PROPOSAL FOR THIS CLASS)
You are interested in researching the decision-making processes of parents of elementary-aged children during the beginning of the COVID-19 pandemic in 2020. Specifically, you want to if and how parents’ socioeconomic class impacted their decisions about whether to send their children to school in-person or instead opt for online classes or homeschooling.
- Create a working research question for this topic.
- What is the dependent variable in this research question? The independent variable? What other variables might you want to control?
For the independent variable, dependent variable, and at least one control variable from your list:
- What measure (the specific question and answers) might you use for each one? Write out a first draft based on what you read in this section.
If you completed the exercise above and listed out all of the questions and answer choices you will use to measure the variables in your research question, you have already produced a pretty solid first draft of your questionnaire! Congrats! In essence, questionnaires are all of the self-report measures in your operational definitions for the independent, dependent, and control variables in your study arranged into one document and administered to participants. There are a few questions on a questionnaire (like name or ID#) that are not associated with the measurement of variables. These are the exception, and it’s useful to think of a questionnaire as a list of measures for variables. Of course, researchers often use more than one measure of a variable (i.e., triangulation) so they can more confidently assert that their findings are true. A questionnaire should contain all of the measures researchers plan to collect about their variables by asking participants to self-report.
Sticking close to your operational definitions is important because it helps you avoid an everything-but-the-kitchen-sink approach that includes every possible question that occurs to you. Doing so puts an unnecessary burden on your survey respondents. Remember that you have asked your participants to give you their time and attention and to take care in responding to your questions; show them your respect by only asking questions that you actually plan to use in your analysis. For each question in your questionnaire, ask yourself how this question measures a variable in your study. An operational definition should contain the questions, response options, and how the researcher will draw conclusions about the variable based on participants’ responses.
Writing questions
So, almost all of the questions on a questionnaire are measuring some variable. For many variables, researchers will create their own questions rather than using one from another researcher. This section will provide some tips on how to create good questions to accurately measure variables in your study. First, questions should be as clear and to the point as possible. This is not the time to show off your creative writing skills; a survey is a technical instrument and should be written in a way that is as direct and concise as possible. As I’ve mentioned earlier, your survey respondents have agreed to give their time and attention to your survey. The best way to show your appreciation for their time is to not waste it. Ensuring that your questions are clear and concise will go a long way toward showing your respondents the gratitude they deserve. Pilot testing the questionnaire with friends or colleagues can help identify these issues. This process is commonly called pretesting, but to avoid any confusion with pretesting in experimental design, we refer to it as pilot testing.
Related to the point about not wasting respondents’ time, make sure that every question you pose will be relevant to every person you ask to complete it. This means two things: first, that respondents have knowledge about whatever topic you are asking them about, and second, that respondents have experienced the events, behaviors, or feelings you are asking them to report. If you are asking participants for second-hand knowledge—asking clinicians about clients’ feelings, asking teachers about students’ feelings, and so forth—you may want to clarify that the variable you are asking about is the key informant’s perception of what is happening in the target population. A well-planned sampling approach ensures that participants are the most knowledgeable population to complete your survey.
If you decide that you do wish to include questions about matters with which only a portion of respondents will have had experience, make sure you know why you are doing so. For example, if you are asking about MSW student study patterns, and you decide to include a question on studying for the social work licensing exam, you may only have a small subset of participants who have begun studying for the graduate exam or took the bachelor’s-level exam. If you decide to include this question that speaks to a minority of participants’ experiences, think about why you are including it. Are you interested in how studying for class and studying for licensure differ? Are you trying to triangulate study skills measures? Researchers should carefully consider whether questions relevant to only a subset of participants is likely to produce enough valid responses for quantitative analysis.
Many times, questions that are relevant to a subsample of participants are conditional on an answer to a previous question. A participant might select that they rent their home, and as a result, you might ask whether they carry renter’s insurance. That question is not relevant to homeowners, so it would be wise not to ask them to respond to it. In that case, the question of whether someone rents or owns their home is a filter question, designed to identify some subset of survey respondents who are asked additional questions that are not relevant to the entire sample. Figure 13.1 presents an example of how to accomplish this on a paper survey by adding instructions to the participant that indicate what question to proceed to next based on their response to the first one. Using online survey tools, researchers can use filter questions to only present relevant questions to participants.
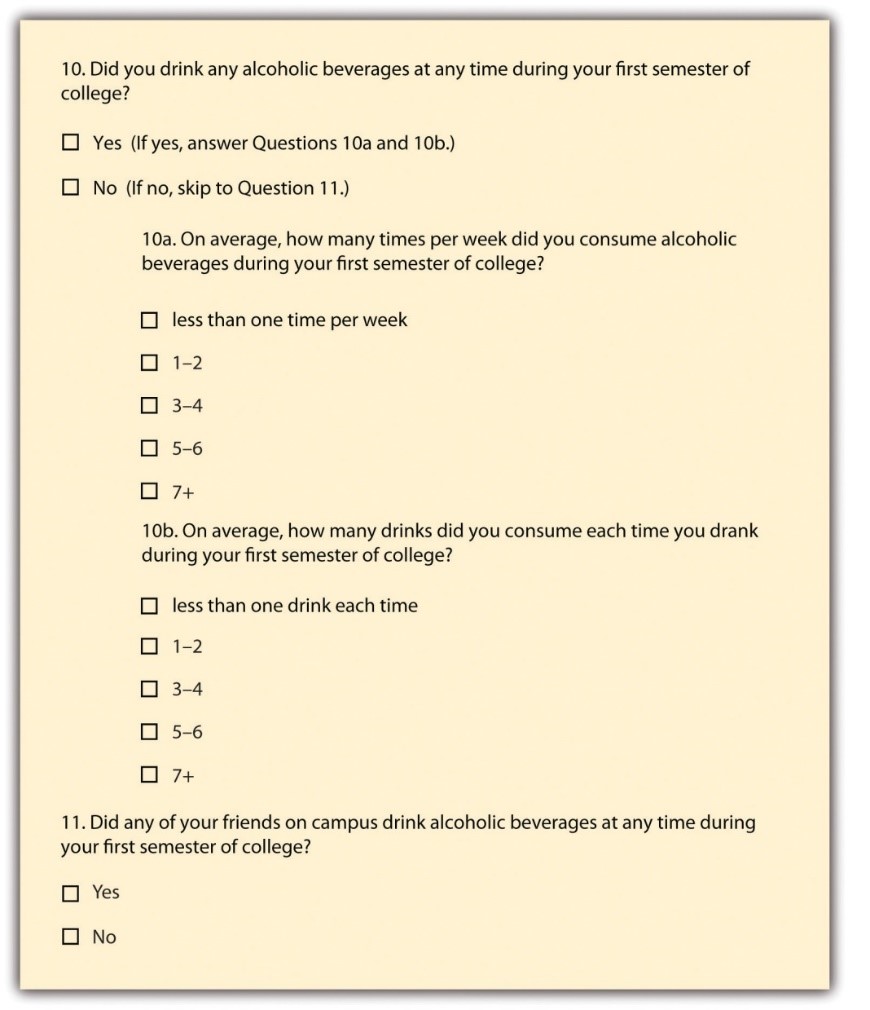
Researchers should eliminate questions that ask about things participants don’t know to minimize confusion. Assuming the question is relevant to the participant, other sources of confusion come from how the question is worded. The use of negative wording can be a source of potential confusion. Taking the question from Figure 13.1 about drinking as our example, what if we had instead asked, “Did you not abstain from drinking during your first semester of college?” This is a double negative, and it’s not clear how to answer the question accurately. It is a good idea to avoid negative phrasing, when possible. For example, “did you not drink alcohol during your first semester of college?” is less clear than “did you drink alcohol your first semester of college?”
Another 877777771`issue arises when you use jargon, or technical language, that people do not commonly know. For example, if you asked adolescents how they experience imaginary audience, they would find it difficult to link those words to the concepts from David Elkind’s theory. The words you use in your questions must be understandable to your participants. If you find yourself using jargon or slang, break it down into terms that are more universal and easier to understand.
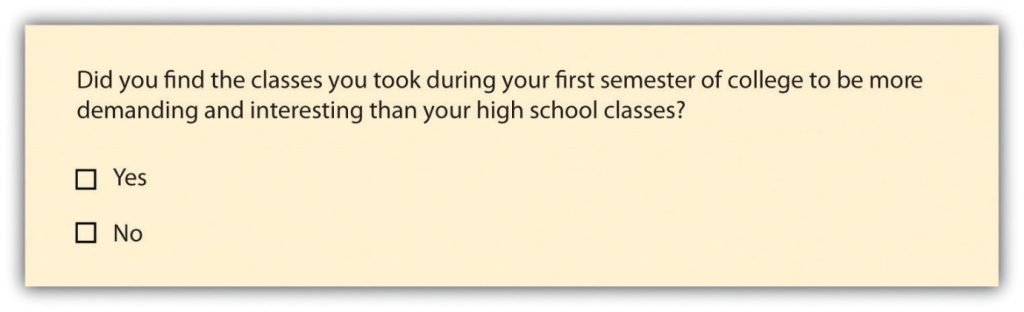
Asking multiple questions as though they are a single question can also confuse survey respondents. There’s a specific term for this sort of question; it is called a double-barreled question. Figure 13.2 shows a double-barreled question. Do you see what makes the question double-barreled? How would someone respond if they felt their college classes were more demanding but also more boring than their high school classes? Or less demanding but more interesting? Because the question combines “demanding” and “interesting,” there is no way to respond yes to one criterion but no to the other.
Another thing to avoid when constructing survey questions is the problem of social desirability. We all want to look good, right? And we all probably know the politically correct response to a variety of questions whether we agree with the politically correct response or not. In survey research, social desirability refers to the idea that respondents will try to answer questions in a way that will present them in a favorable light. (You may recall we covered social desirability bias in Chapter 11.)
Perhaps we decide that to understand the transition to college, we need to know whether respondents ever cheated on an exam in high school or college for our research project. We all know that cheating on exams is generally frowned upon (at least I hope we all know this). So, it may be difficult to get people to admit to cheating on a survey. But if you can guarantee respondents’ confidentiality, or even better, their anonymity, chances are much better that they will be honest about having engaged in this socially undesirable behavior. Another way to avoid problems of social desirability is to try to phrase difficult questions in the most benign way possible. Earl Babbie (2010) [1] offers a useful suggestion for helping you do this—simply imagine how you would feel responding to your survey questions. If you would be uncomfortable, chances are others would as well.
Exercises
TRACK 1 (IF YOU ARE CREATING A RESEARCH PROPOSAL FOR THIS CLASS)
Try to step outside your role as researcher for a second, and imagine you were one of your participants. Evaluate the following:
- Is the question too general? Sometimes, questions that are too general may not accurately convey respondents’ perceptions. If you asked someone how they liked a certain book and provide a response scale ranging from “not at all” to “extremely well”, and if that person selected “extremely well,” what do they mean? Instead, ask more specific behavioral questions, such as “Will you recommend this book to others?” or “Do you plan to read other books by the same author?”
- Is the question too detailed? Avoid unnecessarily detailed questions that serve no specific research purpose. For instance, do you need the age of each child in a household or is just the number of children in the household acceptable? However, if unsure, it is better to err on the side of details than generality.
- Is the question presumptuous? Does your question make assumptions? For instance, if you ask, “what do you think the benefits of a tax cut would be?” you are presuming that the participant sees the tax cut as beneficial. But many people may not view tax cuts as beneficial. Some might see tax cuts as a precursor to less funding for public schools and fewer public services such as police, ambulance, and fire department. Avoid questions with built-in presumptions.
- Does the question ask the participant to imagine something? Is the question imaginary? A popular question on many television game shows is “if you won a million dollars on this show, how will you plan to spend it?” Most participants have never been faced with this large amount of money and have never thought about this scenario. In fact, most don’t even know that after taxes, the value of the million dollars will be greatly reduced. In addition, some game shows spread the amount over a 20-year period. Without understanding this “imaginary” situation, participants may not have the background information necessary to provide a meaningful response.
TRACK 2 (IF YOU AREN’T CREATING A RESEARCH PROPOSAL FOR THIS CLASS)
You are interested in researching the decision-making processes of parents of elementary-aged children during the beginning of the COVID-19 pandemic in 2020. Specifically, you want to if and how parents’ socioeconomic class impacted their decisions about whether to send their children to school in-person or instead opt for online classes or homeschooling.
Try to step outside your role as researcher for a second, and imagine you were one of your participants. Use the following prompts to evaluate your draft questions from the previous exercise:
- Is the question too general? Sometimes, questions that are too general may not accurately convey respondents’ perceptions. If you asked someone how they liked a certain book and provide a response scale ranging from “not at all” to “extremely well”, and if that person selected “extremely well,” what do they mean? Instead, ask more specific behavioral questions, such as “Will you recommend this book to others?” or “Do you plan to read other books by the same author?”
- Is the question too detailed? Avoid unnecessarily detailed questions that serve no specific research purpose. For instance, do you need the age of each child in a household or is just the number of children in the household acceptable? However, if unsure, it is better to err on the side of details than generality.
- Is the question presumptuous? Does your question make assumptions? For instance, if you ask, “what do you think the benefits of a tax cut would be?” you are presuming that the participant sees the tax cut as beneficial. But many people may not view tax cuts as beneficial. Some might see tax cuts as a precursor to less funding for public schools and fewer public services such as police, ambulance, and fire department. Avoid questions with built-in presumptions.
- Does the question ask the participant to imagine something? Is the question imaginary? A popular question on many television game shows is “if you won a million dollars on this show, how will you plan to spend it?” Most participants have never been faced with this large amount of money and have never thought about this scenario. In fact, most don’t even know that after taxes, the value of the million dollars will be greatly reduced. In addition, some game shows spread the amount over a 20-year period. Without understanding this “imaginary” situation, participants may not have the background information necessary to provide a meaningful response.
Cultural considerations
When researchers write items for questionnaires, they must be conscientious to avoid culturally biased questions that may be inappropriate or difficult for certain populations.
[insert information related to asking about demographics and how this might make some people uncomfortable based on their identity(ies) and how to potentially address]
You should also avoid using terms or phrases that may be regionally or culturally specific (unless you are absolutely certain all your respondents come from the region or culture whose terms you are using). When I first moved to southwest Virginia, I didn’t know what a holler was. Where I grew up in New Jersey, to holler means to yell. Even then, in New Jersey, we shouted and screamed, but we didn’t holler much. In southwest Virginia, my home at the time, a holler also means a small valley in between the mountains. If I used holler in that way on my survey, people who live near me may understand, but almost everyone else would be totally confused.
Testing questionnaires before using them
Finally, it is important to get feedback on your survey questions from as many people as possible, especially people who are like those in your sample. Now is not the time to be shy. Ask your friends for help, ask your mentors for feedback, ask your family to take a look at your survey as well. The more feedback you can get on your survey questions, the better the chances that you will come up with a set of questions that are understandable to a wide variety of people and, most importantly, to those in your sample.
In sum, in order to pose effective survey questions, researchers should do the following:
- Identify how each question measures an independent, dependent, or control variable in their study.
- Keep questions clear and succinct.
- Make sure respondents have relevant lived experience to provide informed answers to your questions.
- Use filter questions to avoid getting answers from uninformed participants.
- Avoid questions that are likely to confuse respondents—including those that use double negatives, use culturally specific terms or jargon, and pose more than one question at a time.
- Imagine how respondents would feel responding to questions.
- Get feedback, especially from people who resemble those in the researcher’s sample.
Table 13.1 offers one model for writing effective questionnaire items.
| Criterion | Poor | Effective |
| B- Brief | “Are you now or have you ever been the possessor of a firearm?” | Have you ever possessed a firearm? |
| R- Relevant | “Who did you vote for in the last election?” | Note: Only include items that are relevant to your study. |
| U- Unambiguous | “Are you a gun person?” | Do you currently own a gun?” |
| S- Specific | How much have you read about the new gun control measure and sales tax?” | “How much have you read about the new sales tax on firearm purchases?” |
| O- Objective | “How much do you support the beneficial new gun control measure?” | “What is your view of the new gun control measure?” |
Exercises
TRACK 1 (IF YOU ARE CREATING A RESEARCH PROPOSAL FOR THIS CLASS)
Let’s complete a first draft of your questions.
- In the first exercise, you wrote out the questions and answers for each measure of your independent and dependent variables. Evaluate each question using the criteria listed above on effective survey questions.
- Type out questions for your control variables and evaluate them, as well. Consider what response options you want to offer participants.
Now, let’s revise any questions that do not meet your standards!
- Use the BRUSO model in Table 13.1 for an illustration of how to address deficits in question wording. Keep in mind that you are writing a first draft in this exercise, and it will take a few drafts and revisions before your questions are ready to distribute to participants.
TRACK 2 (IF YOU AREN’T CREATING A RESEARCH PROPOSAL FOR THIS CLASS)
You are interested in researching the decision-making processes of parents of elementary-aged children during the beginning of the COVID-19 pandemic in 2020. Specifically, you want to if and how parents’ socioeconomic class impacted their decisions about whether to send their children to school in-person or instead opt for online classes or homeschooling.
Let’s complete a first draft of your questions.
- In the first exercise, you wrote out the question and answers for your independent, dependent, and at least one control variable. Evaluate each question using the criteria listed above on effective survey questions.
Now, let’s revise any questions that do not meet your standards!
- Use the BRUSO model in Table 13.1 for an illustration of how to address deficits in question wording. In real research, it will take a few drafts and revisions before your questions are ready to distribute to participants.

Writing response options
While posing clear and understandable questions in your survey is certainly important, so too is providing respondents with unambiguous response options. Response options are the answers that you provide to the people completing your questionnaire. Generally, respondents will be asked to choose a single (or best) response to each question you pose. We call questions in which the researcher provides all of the response options closed-ended questions. Keep in mind, closed-ended questions can also instruct respondents to choose multiple response options, rank response options against one another, or assign a percentage to each response option. But be cautious when experimenting with different response options! Accepting multiple responses to a single question may add complexity when it comes to quantitatively analyzing and interpreting your data.
Surveys need not be limited to closed-ended questions. Sometimes survey researchers include open-ended questions in their survey instruments as a way to gather additional details from respondents. An open-ended question does not include response options; instead, respondents are asked to reply to the question in their own way, using their own words. These questions are generally used to find out more about a survey participant’s experiences or feelings about whatever they are being asked to report in the survey. If, for example, a survey includes closed-ended questions asking respondents to report on their involvement in extracurricular activities during college, an open-ended question could ask respondents why they participated in those activities or what they gained from their participation. While responses to such questions may also be captured using a closed-ended format, allowing participants to share some of their responses in their own words can make the experience of completing the survey more satisfying to respondents and can also reveal new motivations or explanations that had not occurred to the researcher. This is particularly important for mixed-methods research. It is possible to analyze open-ended response options quantitatively using content analysis (i.e., counting how often a theme is represented in a transcript looking for statistical patterns). However, for most researchers, qualitative data analysis will be needed to analyze open-ended questions, and researchers need to think through how they will analyze any open-ended questions as part of their data analysis plan. Open-ended questions cannot be operationally defined because you don’t know what responses you will get. We will address qualitative data analysis in greater detail in Chapter 19.
To write an effective response options for closed-ended questions, there are a couple of guidelines worth following. First, be sure that your response options are mutually exclusive. Look back at Figure 13.1, which contains questions about how often and how many drinks respondents consumed. Do you notice that there are no overlapping categories in the response options for these questions? This is another one of those points about question construction that seems fairly obvious but that can be easily overlooked. Response options should also be exhaustive. In other words, every possible response should be covered in the set of response options that you provide. For example, note that in question 10a in Figure 13.1, we have covered all possibilities—those who drank, say, an average of once per month can choose the first response option (“less than one time per week”) while those who drank multiple times a day each day of the week can choose the last response option (“7+”). All the possibilities in between these two extremes are covered by the middle three response options, and every respondent fits into one of the response options we provided.
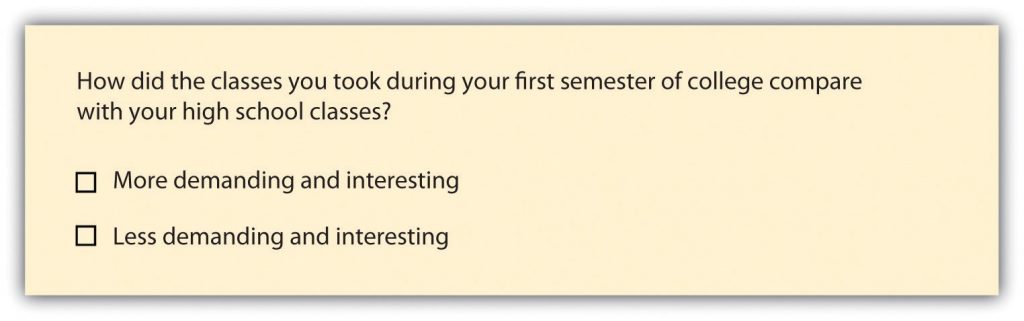
Earlier in this section, we discussed double-barreled questions. Response options can also be double barreled, and this should be avoided. Figure 13.3 is an example of a question that uses double-barreled response options. Other tips about questions are also relevant to response options, including that participants should be knowledgeable enough to select or decline a response option as well as avoiding jargon and cultural idioms.
Even if you phrase questions and response options clearly, participants are influenced by how many response options are presented on the questionnaire. For Likert scales, five or seven response options generally allow about as much precision as respondents are capable of. However, numerical scales with more options can sometimes be appropriate. For dimensions such as attractiveness, pain, and likelihood, a 0-to-10 scale will be familiar to many respondents and easy for them to use. Regardless of the number of response options, the most extreme ones should generally be “balanced” around a neutral or modal midpoint. An example of an unbalanced rating scale measuring perceived likelihood might look like this:
Unlikely | Somewhat Likely | Likely | Very Likely | Extremely Likely
Because we have four rankings of likely and only one ranking of unlikely, the scale is unbalanced and most responses will be biased toward “likely” rather than “unlikely.” A balanced version might look like this:
Extremely Unlikely | Somewhat Unlikely | As Likely as Not | Somewhat Likely |Extremely Likely
In this example, the midpoint is halfway between likely and unlikely. Of course, a middle or neutral response option does not have to be included. Researchers sometimes choose to leave it out because they want to encourage respondents to think more deeply about their response and not simply choose the middle option by default. Fence-sitters are respondents who choose neutral response options, even if they have an opinion. Some people will be drawn to respond, “no opinion” even if they have an opinion, particularly if their true opinion is the not a socially desirable opinion. Floaters, on the other hand, are those that choose a substantive answer to a question when really, they don’t understand the question or don’t have an opinion.
As you can see, floating is the flip side of fence-sitting. Thus, the solution to one problem is often the cause of the other. How you decide which approach to take depends on the goals of your research. Sometimes researchers specifically want to learn something about people who claim to have no opinion. In this case, allowing for fence-sitting would be necessary. Other times researchers feel confident their respondents will all be familiar with every topic in their survey. In this case, perhaps it is okay to force respondents to choose one side or another (e.g., agree or disagree) without a middle option (e.g., neither agree nor disagree) or to not include an option like “don’t know enough to say” or “not applicable.” There is no always-correct solution to either problem. But in general, including middle option in a response set provides a more exhaustive set of response options than one that excludes one.
==This came from 10.3 under “Measuring unidimensional concepts” but it seems more appropriate in the chapter about writing survey questions. We need to make sure this section flows well. Maybe there should be a better organized subsection on rating scales? Where does this go? Does it need any revision?===
The number of response options on a typical rating scale is usually five or seven, though it can range from three to 11. Five-point scales are best for unipolar scales where only one construct is tested, such as frequency (Never, Rarely, Sometimes, Often, Always). Seven-point scales are best for bipolar scales where there is a dichotomous spectrum, such as liking (Like very much, Like somewhat, Like slightly, Neither like nor dislike, Dislike slightly, Dislike somewhat, Dislike very much). For bipolar questions, it is useful to offer an earlier question that branches them into an area of the scale; if asking about liking ice cream, first ask “Do you generally like or dislike ice cream?” Once the respondent chooses like or dislike, refine it by offering them relevant choices from the seven-point scale. Branching improves both reliability and validity (Krosnick & Berent, 1993).[2] Although you often see scales with numerical labels, it is best to only present verbal labels to the respondents but convert them to numerical values in the analyses. Avoid partial labels or length or overly specific labels. In some cases, the verbal labels can be supplemented with (or even replaced by) meaningful graphics. The last rating scale shown in Figure 10.1 is a visual-analog scale, on which participants make a mark somewhere along the horizontal line to indicate the magnitude of their response.
Finalizing Response Options
The most important check before your finalize your response options is to align them with your operational definitions. As we’ve discussed before, your operational definitions include your measures (questions and responses options) as well as how to interpret those measures in terms of the variable being measured. In particular, you should be able to interpret all response options to a question based on your operational definition of the variable it measures. If you wanted to measure the variable “social class,” you might ask one question about a participant’s annual income and another about family size. Your operational definition would need to provide clear instructions on how to interpret response options. Your operational definition is basically like this social class calculator from Pew Research, though they include a few more questions in their definition.
To drill down a bit more, as Pew specifies in the section titled “how the income calculator works,” the interval/ratio data respondents enter is interpreted using a formula combining a participant’s four responses to the questions posed by Pew categorizing their household into three categories—upper, middle, or lower class. So, the operational definition includes the four questions comprising the measure and the formula or interpretation which converts responses into the three final categories that we are familiar with: lower, middle, and upper class.
It’s perfectly normal for operational definitions to change levels of measurement, and it’s also perfectly normal for the level of measurement to stay the same. The important thing is that each response option a participant can provide is accounted for by the operational definition. Throw any combination of family size, location, or income at the Pew calculator, and it will define you into one of those three social class categories.
Unlike Pew’s definition, the operational definitions in your study may not need their own webpage to define and describe. For many questions and answers, interpreting response options is easy. If you were measuring “income” instead of “social class,” you could simply operationalize the term by asking people to list their total household income before taxes are taken out. Higher values indicate higher income, and lower values indicate lower income. Easy. Regardless of whether your operational definitions are simple or more complex, every response option to every question on your survey (with a few exceptions) should be interpretable using an operational definition of a variable. Just like we want to avoid an everything-but-the-kitchen-sink approach to questions on our questionnaire, you want to make sure your final questionnaire only contains response options that you will use in your study.
One note of caution on interpretation (sorry for repeating this). We want to remind you again that an operational definition should not mention more than one variable. In our example above, your operational definition could not say “a family of three making under $50,000 is lower class; therefore, they are more likely to experience food insecurity.” That last clause about food insecurity may well be true, but it’s not a part of the operational definition for social class. Each variable (food insecurity and class) should have its own operational definition. If you are talking about how to interpret the relationship between two variables, you are talking about your data analysis plan. We will discuss how to create your data analysis plan beginning in Chapter 14. For now, one consideration is that depending on the statistical test you use to test relationships between variables, you may need nominal, ordinal, or interval/ratio data. Your questions and response options should match the level of measurement you need with the requirements of the specific statistical tests in your data analysis plan. Once you finalize your data analysis plan, return to your questionnaire to confirm the level of measurement matches with the statistical test you’ve chosen.
In summary, to write effective response options researchers should do the following:
- Avoid wording that is likely to confuse respondents—including double negatives, use culturally specific terms or jargon, and double-barreled response options.
- Ensure response options are relevant to participants’ knowledge and experience so they can make an informed and accurate choice.
- Present mutually exclusive and exhaustive response options.
- Consider fence-sitters and floaters, and the use of neutral or “not applicable” response options.
- Define how response options are interpreted as part of an operational definition of a variable.
- Check level of measurement matches operational definitions and the statistical tests in the data analysis plan (once you develop one in the future)
Exercises
TRACK 1 (IF YOU ARE CREATING A RESEARCH PROPOSAL FOR THIS CLASS)
Look back at the response options you drafted in the previous exercise. Make sure you have a first draft of response options for each closed-ended question on your questionnaire.
- Using the criteria above, evaluate the wording of the response options for each question on your questionnaire.
- Revise your questions and response options until you have a complete first draft.
- Do your first read-through and provide a dummy answer to each question. Make sure you can link each response option and each question to an operational definition.
TRACK 2 (IF YOU AREN’T CREATING A RESEARCH PROPOSAL FOR THIS CLASS)
You are interested in researching the decision-making processes of parents of elementary-aged children during the beginning of the COVID-19 pandemic in 2020. Specifically, you want to if and how parents’ socioeconomic class impacted their decisions about whether to send their children to school in-person or instead opt for online classes or homeschooling.
Look back at the response options you drafted in the previous exercise.
- Using the criteria above, evaluate the wording of the response options for each question on your questionnaire.
- Revise your questions and response options until you have a complete first draft.
From this discussion, we hope it is clear why researchers using quantitative methods spell out all of their plans ahead of time. Ultimately, there should be a straight line from operational definition through measures on your questionnaire to the data analysis plan. If your questionnaire includes response options that are not aligned with operational definitions or not included in the data analysis plan, the responses you receive back from participants won’t fit with your conceptualization of the key variables in your study. If you do not fix these errors and proceed with collecting unstructured data, you will lose out on many of the benefits of survey research and face overwhelming challenges in answering your research question.

Designing questionnaires
Based on your work in the previous section, you should have a first draft of the questions and response options for the key variables in your study. Now, you’ll also need to think about how to present your written questions and response options to survey respondents. It’s time to write a final draft of your questionnaire and make it look nice. Designing questionnaires takes some thought. First, consider the route of administration for your survey. What we cover in this section will apply equally to paper and online surveys, but if you are planning to use online survey software, you should watch tutorial videos and explore the features of of the survey software you will use.
Informed consent & instructions
Writing effective items is only one part of constructing a survey. For one thing, every survey should have a written or spoken introduction that serves two basic functions (Peterson, 2000).[3] One is to encourage respondents to participate in the survey. In many types of research, such encouragement is not necessary either because participants do not know they are in a study (as in naturalistic observation) or because they are part of a subject pool and have already shown their willingness to participate by signing up and showing up for the study. Survey research usually catches respondents by surprise when they answer their phone, go to their mailbox, or check their e-mail—and the researcher must make a good case for why they should agree to participate. Thus, the introduction should briefly explain the purpose of the survey and its importance, provide information about the sponsor of the survey (university-based surveys tend to generate higher response rates), acknowledge the importance of the respondent’s participation, and describe any incentives for participating.
The second function of the introduction is to establish informed consent. Remember that this involves describing to respondents everything that might affect their decision to participate. This includes the topics covered by the survey, the amount of time it is likely to take, the respondent’s option to withdraw at any time, confidentiality issues, and other ethical considerations we covered in Chapter 6. Written consent forms are not always used in survey research (when the research is of minimal risk and completion of the survey instrument is often accepted by the IRB as evidence of consent to participate), so it is important that this part of the introduction be well documented and presented clearly and in its entirety to every respondent.
Organizing items to be easy and intuitive to follow
The introduction should be followed by the substantive questionnaire items. But first, it is important to present clear instructions for completing the questionnaire, including examples of how to use any unusual response scales. Remember that the introduction is the point at which respondents are usually most interested and least fatigued, so it is good practice to start with the most important items for purposes of the research and proceed to less important items. Items should also be grouped by topic or by type. For example, items using the same rating scale (e.g., a 5-point agreement scale) should be grouped together if possible to make things faster and easier for respondents. Demographic items are often presented last. This can be because they are easy to answer in the event respondents have become tired or bored, because they are least interesting to participants, or because they can raise concerns for respondents from marginalized groups who may see questions about their identities as a potential red flag. Of course, any survey should end with an expression of appreciation to the respondent.
Questions are often organized thematically. If our survey were measuring social class, perhaps we’d have a few questions asking about employment, others focused on education, and still others on housing and community resources. Those may be the themes around which we organize our questions. Or perhaps it would make more sense to present any questions we had about parents’ income and then present a series of questions about estimated future income. Grouping by theme is one way to be deliberate about how you present your questions. Keep in mind that you are surveying people, and these people will be trying to follow the logic in your questionnaire. Jumping from topic to topic can give people a bit of whiplash and may make participants less likely to complete it.
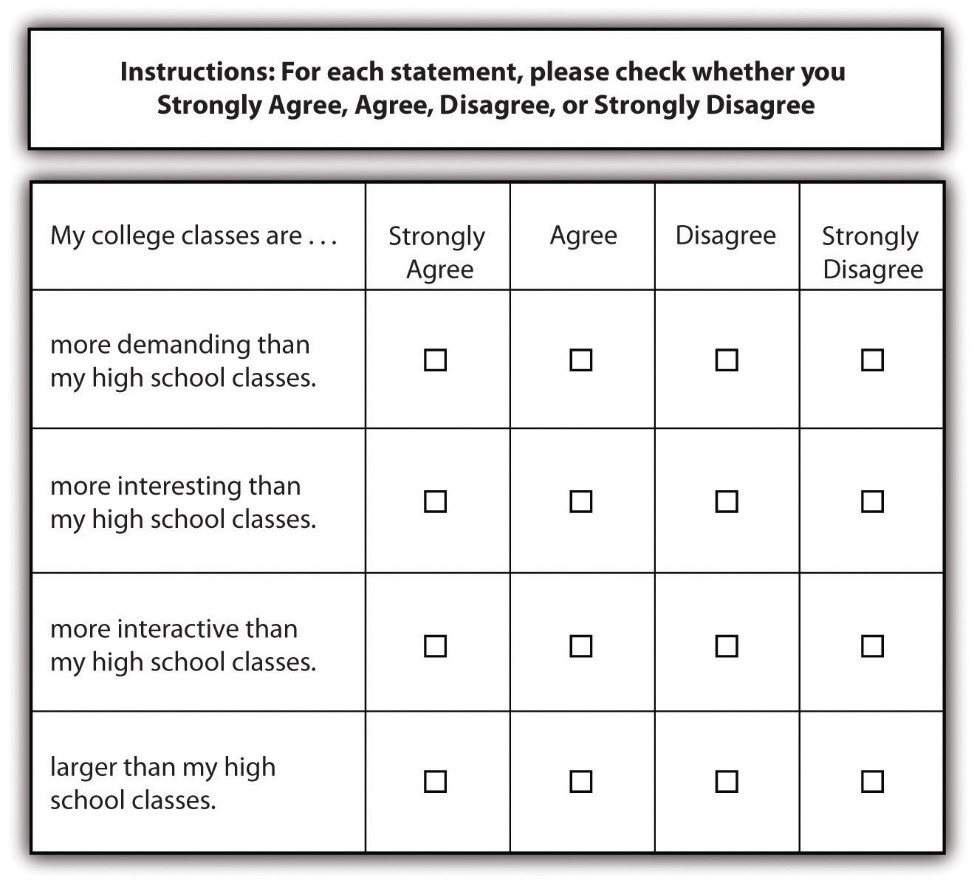
Using a matrix is a nice way of streamlining response options for similar questions. A matrix is a question type that lists a set of questions for which the answer categories are all the same. If you have a set of questions for which the response options are the same, it may make sense to create a matrix rather than posing each question and its response options individually. Not only will this save you some space in your survey but it will also help respondents progress through your survey more easily. A sample matrix can be seen in Figure 13.4.
Once you have grouped similar questions together, you’ll need to think about the order in which to present those question groups. Most survey researchers agree that it is best to begin a survey with questions that will want to make respondents continue (Babbie, 2010; Dillman, 2000; Neuman, 2003).[4] In other words, don’t bore respondents, but don’t scare them away either. There’s some disagreement over where on a survey to place demographic questions, such as those about a person’s age, gender, and race. On the one hand, placing them at the beginning of the questionnaire may lead respondents to think the survey is boring, unimportant, and not something they want to bother completing. On the other hand, if your survey deals with some very sensitive topic, such as child sexual abuse or criminal convictions, you don’t want to scare respondents away or shock them by beginning with your most intrusive questions.
Your participants are human. They will react emotionally to questionnaire items, and they will also try to uncover your research questions and hypotheses. In truth, the order in which you present questions on a survey is best determined by the unique characteristics of your research. When feasible, you should consult with key informants from your target population determine how best to order your questions. If it is not feasible to do so, think about the unique characteristics of your topic, your questions, and most importantly, your sample. Keeping in mind the characteristics and needs of the people you will ask to complete your survey should help guide you as you determine the most appropriate order in which to present your questions. None of your decisions will be perfect, and all studies have limitations.
Questionnaire length
You’ll also need to consider the time it will take respondents to complete your questionnaire. Surveys vary in length, from just a page or two to a dozen or more pages, which means they also vary in the time it takes to complete them. How long to make your survey depends on several factors. First, what is it that you wish to know? Wanting to understand how grades vary by gender and year in school certainly requires fewer questions than wanting to know how people’s experiences in college are shaped by demographic characteristics, college attended, housing situation, family background, college major, friendship networks, and extracurricular activities. Keep in mind that even if your research question requires a sizable number of questions be included in your questionnaire, do your best to keep the questionnaire as brief as possible. Any hint that you’ve thrown in a bunch of useless questions just for the sake of it will turn off respondents and may make them not want to complete your survey.
Second, and perhaps more important, how long are respondents likely to be willing to spend completing your questionnaire? If you are studying college students, asking them to use their very limited time to complete your survey may mean they won’t want to spend more than a few minutes on it. But if you ask them to complete your survey during down-time between classes and there is little work to be done, students may be willing to give you a bit more of their time. Think about places and times that your sampling frame naturally gathers and whether you would be able to either recruit participants or distribute a survey in that context. Estimate how long your participants would reasonably have to complete a survey presented to them during this time. The more you know about your population (such as what weeks have less work and more free time), the better you can target questionnaire length.
The time that survey researchers ask respondents to spend on questionnaires varies greatly. Some researchers advise that surveys should not take longer than about 15 minutes to complete (as cited in Babbie 2010),[5] whereas others suggest that up to 20 minutes is acceptable (Hopper, 2010).[6] As with question order, there is no clear-cut, always-correct answer about questionnaire length. The unique characteristics of your study and your sample should be considered to determine how long to make your questionnaire. For example, if you planned to distribute your questionnaire to students in between classes, you will need to make sure it is short enough to complete before the next class begins.
When designing a questionnaire, a researcher should consider:
- Weighing strengths and limitations of the method of delivery, including the advanced tools in online survey software or the simplicity of paper questionnaires.
- Grouping together items that ask about the same thing.
- Moving any questions about sensitive items to the end of the questionnaire, so as not to scare respondents off.
- Moving any questions that engage the respondent to answer the questionnaire at the beginning, so as not to bore them.
- Timing the length of the questionnaire with a reasonable length of time you can ask of your participants.
- Dedicating time to visual design and ensure the questionnaire looks professional.
Exercises
TRACK 1 (IF YOU ARE CREATING A RESEARCH PROPOSAL FOR THIS CLASS)
Type out a final draft of your questionnaire in a word processor or online survey tool.
- Evaluate your questionnaire using the guidelines above, revise it, and get it ready to share with other student researchers.
TRACK 2 (IF YOU AREN’T CREATING A RESEARCH PROPOSAL FOR THIS CLASS)
You are interested in researching the decision-making processes of parents of elementary-aged children during the beginning of the COVID-19 pandemic in 2020. Specifically, you want to if and how parents’ socioeconomic class impacted their decisions about whether to send their children to school in-person or instead opt for online classes or homeschooling.
- Take a look at the question drafts you have completed and decide on an order for your questions. Evaluate your draft questionnaire using the guidelines above, and revise as needed.

Pilot testing and revising questionnaires
A good way to estimate the time it will take respondents to complete your questionnaire (and other potential challenges) is through pilot testing. Pilot testing allows you to get feedback on your questionnaire so you can improve it before you actually administer it. It can be quite expensive and time consuming if you wish to pilot test your questionnaire on a large sample of people who very much resemble the sample to whom you will eventually administer the finalized version of your questionnaire. But you can learn a lot and make great improvements to your questionnaire simply by pilot testing with a small number of people to whom you have easy access (perhaps you have a few friends who owe you a favor). By pilot testing your questionnaire, you can find out how understandable your questions are, get feedback on question wording and order, find out whether any of your questions are boring or offensive, and learn whether there are places where you should have included filter questions. You can also time pilot testers as they take your survey. This will give you a good idea about the estimate to provide respondents when you administer your survey and whether you have some wiggle room to add additional items or need to cut a few items.
Perhaps this goes without saying, but your questionnaire should also have an attractive design. A messy presentation style can confuse respondents or, at the very least, annoy them. Be brief, to the point, and as clear as possible. Avoid cramming too much into a single page. Make your font size readable (at least 12 point or larger, depending on the characteristics of your sample), leave a reasonable amount of space between items, and make sure all instructions are exceptionally clear. If you are using an online survey, ensure that participants can complete it via mobile, computer, and tablet devices. Think about books, documents, articles, or web pages that you have read yourself—which were relatively easy to read and easy on the eyes and why? Try to mimic those features in the presentation of your survey questions. While online survey tools automate much of visual design, word processors are designed for writing all kinds of documents and may need more manual adjustment as part of visual design.
Realistically, your questionnaire will continue to evolve as you develop your data analysis plan over the next few chapters. By now, you should have a complete draft of your questionnaire grounded in an underlying logic that ties together each question and response option to a variable in your study. Once your questionnaire is finalized, you will need to submit it for ethical approval from your IRB. If your study requires IRB approval, it may be worthwhile to submit your proposal before your questionnaire is completely done. Revisions to IRB protocols are common and it takes less time to review a few changes to questions and answers than it does to review the entire study, so give them the whole study as soon as you can. Once the IRB approves your questionnaire, you cannot change it without their okay.
Key Takeaways
- A questionnaire is comprised of self-report measures of variables in a research study.
- Make sure your survey questions will be relevant to all respondents and that you use filter questions when necessary.
- Effective survey questions and responses take careful construction by researchers, as participants may be confused or otherwise influenced by how items are phrased.
- The questionnaire should start with informed consent and instructions, flow logically from one topic to the next, engage but not shock participants, and thank participants at the end.
- Pilot testing can help identify any issues in a questionnaire before distributing it to participants, including language or length issues.
Exercises
TRACK 1 (IF YOU ARE CREATING A RESEARCH PROPOSAL FOR THIS CLASS)
It’s a myth that researchers work alone! Get together with a few of your fellow students and swap questionnaires for pilot testing.
- Use the criteria in each section above (questions, response options, questionnaires) and provide your peers with the strengths and weaknesses of their questionnaires.
- See if you can guess their research question and hypothesis based on the questionnaire alone.
TRACK 2 (IF YOU AREN’T CREATING A RESEARCH PROPOSAL FOR THIS CLASS)
You are interested in researching the decision-making processes of parents of elementary-aged children during the beginning of the COVID-19 pandemic in 2020. Specifically, you want to if and how parents’ socioeconomic class impacted their decisions about whether to send their children to school in-person or instead opt for online classes or homeschooling.
It’s a myth that researchers work alone! Get together with a few of your fellow students and compare draft questionnaires.
- What are the strengths and limitations of your questionnaire as compared to those of your peers?
- Is there anything you would like to use from your peers’ questionnaires in your own?
- Babbie, E. (2010). The practice of social research (12th ed.). Belmont, CA: Wadsworth. ↵
- Krosnick, J.A. & Berent, M.K. (1993). Comparisons of party identification and policy preferences: The impact of survey question format. American Journal of Political Science, 27(3), 941-964. ↵
- Peterson, R. A. (2000). Constructing effective questionnaires. Thousand Oaks, CA: Sage. ↵
- Babbie, E. (2010). The practice of social research (12th ed.). Belmont, CA: Wadsworth; Dillman, D. A. (2000). Mail and Internet surveys: The tailored design method (2nd ed.). New York, NY: Wiley; Neuman, W. L. (2003). Social research methods: Qualitative and quantitative approaches (5th ed.). Boston, MA: Pearson. ↵
- Babbie, E. (2010). The practice of social research (12th ed.). Belmont, CA: Wadsworth. ↵
- Hopper, J. (2010). How long should a survey be? Retrieved from http://www.verstaresearch.com/blog/how-long-should-a-survey-be ↵
According to the APA Dictionary of Psychology, an operational definition is "a description of something in terms of the operations (procedures, actions, or processes) by which it could be observed and measured. For example, the operational definition of anxiety could be in terms of a test score, withdrawal from a situation, or activation of the sympathetic nervous system. The process of creating an operational definition is known as operationalization."
Triangulation of data refers to the use of multiple types, measures or sources of data in a research project to increase the confidence that we have in our findings.
Testing out your research materials in advance on people who are not included as participants in your study.
items on a questionnaire designed to identify some subset of survey respondents who are asked additional questions that are not relevant to the entire sample
a question that asks more than one thing at a time, making it difficult to respond accurately
When a participant answers in a way that they believe is socially the most acceptable answer.
the answers researchers provide to participants to choose from when completing a questionnaire
questions in which the researcher provides all of the response options
Questions for which the researcher does not include response options, allowing for respondents to answer the question in their own words
respondents to a survey who choose neutral response options, even if they have an opinion
respondents to a survey who choose a substantive answer to a question when really, they don’t understand the question or don’t have an opinion
An ordered outline that includes your research question, a description of the data you are going to use to answer it, and the exact analyses, step-by-step, that you plan to run to answer your research question.
A process through which the researcher explains the research process, procedures, risks and benefits to a potential participant, usually through a written document, which the participant than signs, as evidence of their agreement to participate.
a type of survey question that lists a set of questions for which the response options are all the same in a grid layout